Grundlæggende statistik
| Institutionelle ejere | 98 total, 98 long only, 0 short only, 0 long/short - change of 16,47% MRQ |
| Gennemsnitlig porteføljeallokering | 0.3082 % - change of 12,67% MRQ |
| Institutionelle aktier (lange) | 5.593.077 (ex 13D/G) - change of 0,97MM shares 20,96% MRQ |
| Institutionel værdi (lang) | $ 301.987 USD ($1000) |
Institutionelt ejerskab og aktionærer
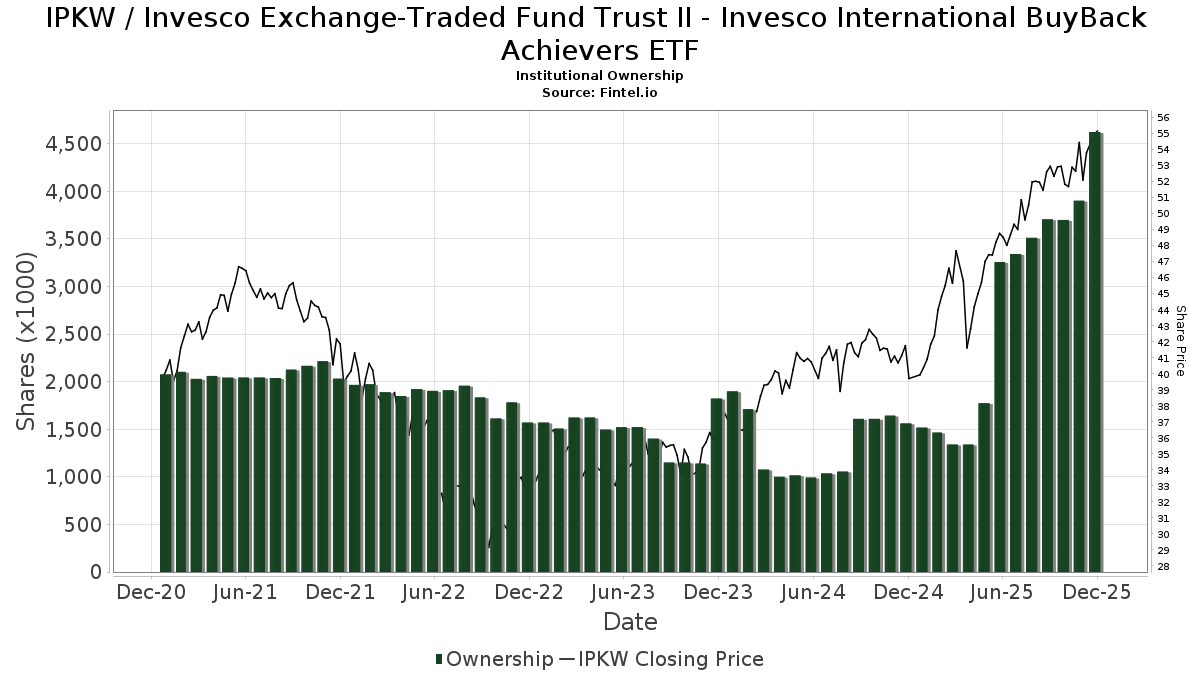
Invesco Exchange-Traded Fund Trust II - Invesco International BuyBack Achievers ETF (US:IPKW) har 98 institutionelle ejere og aktionærer, der har indsendt 13D/G- eller 13F-formularer til Securities Exchange Commission (SEC). Disse institutioner har i alt 5,593,077 aktier. Største aktionærer omfatter Raymond James Financial Inc, Bank Of America Corp /de/, Morgan Stanley, LPL Financial LLC, Kellett Schaffner Wealth Advisors LLC, Park Edge Advisors, LLC, Arkadios Wealth Advisors, Wealth Enhancement Advisory Services, Llc, Brookstone Capital Management, and UBS Group AG .
Invesco Exchange-Traded Fund Trust II - Invesco International BuyBack Achievers ETF (NasdaqGM:IPKW) institutionel ejerskabsstruktur viser aktuelle positioner i virksomheden efter institutioner og fonde, samt seneste ændringer i positionsstørrelse. Større aktionærer kan omfatte individuelle investorer, investeringsforeninger, hedgefonde eller institutioner. Skema 13D angiver, at investoren besidder (eller besidder) mere end 5 % af virksomheden og har til hensigt (eller har til hensigt at) aktivt at forfølge en ændring i forretningsstrategi. Skema 13G indikerer en passiv investering på over 5%.
The share price as of March 26, 2026 is 54,80 / share. Previously, on March 27, 2025, the share price was 46,43 / share. This represents an increase of 18,02% over that period.
Fondens stemningsscore
Fund Sentiment Score (fka Ownership Accumulation Score) finder de aktier, der bliver mest købt af fonde. Det er resultatet af en sofistikeret, multi-faktor kvantitativ model, der identificerer virksomheder med de højeste niveauer af institutionel akkumulering. Scoringsmodellen bruger en kombination af den samlede stigning i oplyste ejere, ændringerne i porteføljeallokeringer i disse ejere og andre målinger. Tallet går fra 0 til 100, hvor højere tal indikerer et højere niveau af akkumulering for sine jævnaldrende, og 50 er gennemsnittet.
Opdateringsfrekvens: Dagligt
Se Ownership Explorer, som giver en liste over højest rangerende virksomheder.
AI+ Ask Fintel’s AI assistant about Invesco Exchange-Traded Fund Trust II - Invesco International BuyBack Achievers ETF.
Select a question to share a public post with an AI-crafted answer.
Thinking of good questions…
Institutionel Put/Call-forhold
Ud over at indberette standardaktie- og gældsudstedelser skal institutter med mere end 100 mill. aktiver under forvaltning også oplyse deres put- og call-optionsbeholdninger. Da salgsoptioner generelt indikerer negativ stemning, og købsoptioner indikerer positiv stemning, kan vi få en fornemmelse af den overordnede institutionelle stemning ved at plotte forholdet mellem put og kald. Diagrammet til højre viser det historiske put/call-forhold for dette instrument.
Brug af Put/Call Ratio som en indikator for investorernes stemning overvinder en af de vigtigste mangler ved at bruge totalt institutionelt ejerskab, som er, at en betydelig mængde af aktiver under forvaltning investeres passivt for at spore indekser. Passivt forvaltede fonde køber typisk ikke optioner, så indikatoren for put/call-forholdet følger mere nøje følelsen af aktivt forvaltede fonde.
13F og NPORT arkivering
Detaljer om 13F-arkivering er gratis. Detaljer om NP-ansøgninger kræver et premium-medlemskab. Grønne rækker angiver nye positioner. Røde rækker angiver lukkede positioner. Klik på linket ikon for at se den fulde transaktionshistorik.
Opgrader
for at låse premium-data op og eksportere til Excel ![]() .
.
| Fil dato | Kilde | Investor | Type | Gennemsnitlig pris (Øst) |
Aktier | Δ Aktier (%) |
Rapporteret Værdi ($1000) |
Δ Værdi (%) |
Port Alloc (%) |
|
|---|---|---|---|---|---|---|---|---|---|---|
| 2026-02-12 | 13F | Commonwealth Equity Services, Llc | 7.752 | 25,07 | 431 | |||||
| 2026-01-14 | 13F | WESPAC Advisors, LLC | 37.574 | 15,48 | 2.088 | 21,82 | ||||
| 2026-01-23 | 13F | Valley National Advisers Inc | 4.127 | 0,00 | 0 | |||||
| 2026-02-13 | 13F | Mml Investors Services, Llc | 42.676 | 5,29 | 2.372 | 11,05 | ||||
| 2026-02-13 | 13F | Kane Investment Management, Inc. | 3.747 | 208 | ||||||
| 2026-02-13 | 13F | Mariner, LLC | 3.630 | 202 | ||||||
| 2026-01-29 | 13F | ProVise Management Group, LLC | 5.770 | 2,83 | 321 | 8,47 | ||||
| 2026-02-06 | 13F | GPS Wealth Strategies Group, LLC | 39.447 | -72,98 | 2.192 | -71,50 | ||||
| 2026-02-13 | 13F | Arkadios Wealth Advisors | 159.033 | 6,53 | 8.838 | 12,36 | ||||
| 2026-02-13 | 13F | Morgan Stanley | 569.476 | 24,06 | 31.647 | 30,85 | ||||
| 2026-02-17 | 13F | Private Advisor Group, LLC | 65.678 | 16,07 | 3.650 | 22,41 | ||||
| 2026-02-12 | 13F | Wagner Wealth Management, Corp | 20.487 | 1.139 | ||||||
| 2026-01-16 | 13F | Park Edge Advisors, LLC | 207.652 | -4,57 | 11.540 | 0,65 | ||||
| 2026-02-17 | 13F | Cetera Investment Advisers | 89.120 | 58,09 | 4.953 | 66,73 | ||||
| 2026-01-13 | 13F | Synergy Financial Management, LLC | 0 | -100,00 | 0 | |||||
| 2026-02-06 | 13F | Principle Wealth Partners Llc | 56.137 | 198,49 | 3.120 | 215,05 | ||||
| 2026-02-11 | 13F | Insight Advisors, LLC/ PA | 4.567 | 1,00 | 254 | 6,30 | ||||
| 2026-01-27 | 13F | Belpointe Asset Management LLC | 23.745 | 18,27 | 1.320 | 24,79 | ||||
| 2026-02-13 | 13F | Gts Securities Llc | 0 | -100,00 | 0 | |||||
| 2026-02-13 | 13F | Stifel Financial Corp | 15.435 | 19,45 | 858 | 26,03 | ||||
| 2026-01-09 | 13F | Breakwater Capital Group | 129.163 | 14,67 | 7.178 | 20,95 | ||||
| 2026-01-29 | 13F | Nbc Securities, Inc. | 200 | 0,00 | 11 | 10,00 | ||||
| 2025-09-29 | NP | SMILX - SMI 50/40/10 Fund | 13.570 | -13,12 | 671 | -4,42 | ||||
| 2026-01-26 | 13F | PFG Investments, LLC | 18.775 | 27,39 | 1.043 | 34,41 | ||||
| 2026-02-13 | 13F | Wells Fargo & Company/mn | 1.447 | 80 | ||||||
| 2026-01-21 | 13F | Flagship Harbor Advisors, Llc | 2.840 | 158 | ||||||
| 2026-02-11 | 13F | Gateway Wealth Partners, LLC | 21.532 | 12,45 | 1.197 | 18,65 | ||||
| 2026-01-02 | 13F | Insight Wealth Strategies, LLC | 5.502 | 5,91 | 306 | 11,72 | ||||
| 2026-01-22 | 13F | Vista Investment Partners Ii, Llc | 37.996 | 5,76 | 2.112 | 11,52 | ||||
| 2026-01-22 | 13F | Iron Financial, LLC | 3.943 | 219 | ||||||
| 2026-02-09 | 13F | Harbour Investments, Inc. | 9.124 | -0,98 | 507 | 4,54 | ||||
| 2025-09-29 | NP | SMIFX - Sound Mind Investing Fund | 58.510 | -14,41 | 2.894 | -5,86 | ||||
| 2026-01-07 | 13F | Private Client Services, Llc | 4.100 | 0,00 | 228 | 5,09 | ||||
| 2026-01-28 | 13F | Geneos Wealth Management Inc. | 140 | 0,00 | 8 | 0,00 | ||||
| 2025-11-04 | 13F | Money Concepts Capital Corp | 0 | -100,00 | 0 | |||||
| 2026-01-29 | 13F | Kestra Private Wealth Services, Llc | 53.994 | 4,90 | 3.001 | 10,62 | ||||
| 2026-02-17 | 13F | Ameriprise Financial Inc | 83.315 | 49,18 | 4.630 | 57,38 | ||||
| 2026-02-17 | 13F | Jones Financial Companies Lllp | 95.036 | 32,47 | 5.281 | 40,27 | ||||
| 2026-02-13 | 13F | MAI Capital Management | 758 | 42 | ||||||
| 2026-02-17 | 13F | Ancora Advisors, LLC | 1.969 | 0,00 | 109 | 5,83 | ||||
| 2026-01-23 | 13F | Financial Enhancement Group LLC | 72.657 | -0,37 | 4.129 | 6,94 | ||||
| 2026-01-16 | 13F | Aspire Capital Advisors LLC | 18.780 | -25,00 | 1.044 | -20,92 | ||||
| 2026-01-26 | 13F | Cwm, Llc | 268 | 61,45 | 0 | |||||
| 2026-01-29 | 13F | UBS Group AG | 131.752 | 36,21 | 7.322 | 43,66 | ||||
| 2026-02-13 | 13F | Flow Traders U.s. Llc | 0 | -100,00 | 0 | |||||
| 2026-02-10 | 13F | Sarver Vrooman Wealth Advisors | 463 | 26 | ||||||
| 2026-01-15 | 13F | Nikulski Financial, Inc. | 117.436 | 113,31 | 6.526 | 125,03 | ||||
| 2026-01-27 | 13F | Mainstay Capital Management Llc /adv | 3.833 | 213 | ||||||
| 2026-02-17 | 13F | Susquehanna International Group, Llp | 59.112 | 49,91 | 3.285 | 58,16 | ||||
| 2026-02-17 | 13F | Royal Bank Of Canada | 69.667 | 13,29 | 3.872 | 19,51 | ||||
| 2026-01-29 | 13F | Comerica Bank | 624 | -0,79 | 35 | 3,03 | ||||
| 2026-02-11 | 13F | Janney Montgomery Scott LLC | 76.950 | -0,53 | 4 | 0,00 | ||||
| 2026-02-04 | 13F | Horizon Wealth Management, LLC | 83.577 | 4.645 | ||||||
| 2026-01-08 | 13F | Wealth Enhancement Advisory Services, Llc | 147.635 | 0,24 | 8.346 | 6,97 | ||||
| 2026-01-20 | 13F | Stratos Wealth Advisors, LLC | 25.759 | 4,20 | 1.432 | 9,91 | ||||
| 2026-02-17 | 13F | Bank Of America Corp /de/ | 587.637 | 27,79 | 32.657 | 34,79 | ||||
| 2026-01-29 | 13F | Sanctuary Advisors, LLC | 98.641 | 3,76 | 5.482 | 9,42 | ||||
| 2026-01-07 | 13F | Cyndeo Wealth Partners, LLC | 3.633 | 202 | ||||||
| 2026-01-15 | 13F | Brookstone Capital Management | 142.454 | 7,37 | 7.917 | 13,25 | ||||
| 2026-01-29 | 13F | Verdence Capital Advisors LLC | 9.208 | 1,32 | 512 | 6,24 | ||||
| 2026-02-11 | 13F | O'shaughnessy Asset Management, Llc | 180 | 0,00 | 10 | 11,11 | ||||
| 2026-02-13 | 13F | Kestra Advisory Services, LLC | 1.286 | 71 | ||||||
| 2026-02-06 | 13F | Fortis Group Advisors, LLC | 19.606 | 0,88 | 1.145 | 12,05 | ||||
| 2026-02-09 | 13F | Kingsview Wealth Management, LLC | 18.072 | 1.004 | ||||||
| 2026-02-10 | 13F | Envestnet Asset Management Inc | 28.550 | 3,53 | 1.587 | 9,23 | ||||
| 2026-02-17 | 13F | Clark Capital Management Group, Inc. | 21.528 | 83,70 | 1.196 | 93,84 | ||||
| 2026-02-17 | 13F | Advisor Group Holdings, Inc. | 8.012 | -23,53 | 445 | -18,35 | ||||
| 2026-02-12 | 13F | Triumph Capital Management | 1.579 | 3,54 | 88 | 8,75 | ||||
| 2026-02-17 | 13F | Vista Investment Management | 60.627 | 12,39 | 3.369 | 18,54 | ||||
| 2026-02-02 | 13F | Mutual Advisors, LLC | 4.869 | 8,13 | 271 | 15,38 | ||||
| 2026-01-26 | 13F | Private Trust Co Na | 582 | 0,00 | 32 | 6,67 | ||||
| 2026-02-10 | 13F | Thoroughbred Financial Services, Llc | 5.151 | 3,14 | 0 | |||||
| 2025-11-12 | 13F | Huntington National Bank | 40 | 8,33 | ||||||
| 2026-02-05 | 13F | Dana Investment Advisors, Inc. | 24.991 | 23,58 | 1.389 | 30,33 | ||||
| 2026-01-26 | 13F | AE Wealth Management LLC | 278 | 58,86 | 15 | 66,67 | ||||
| 2026-02-05 | 13F | Atria Investments Llc | 82.653 | -2,34 | 4.593 | 3,01 | ||||
| 2026-02-11 | 13F | Daner Wealth Management, LLC | 11.782 | -1,17 | 706 | 15,17 | ||||
| 2026-02-09 | 13F | Leavell Investment Management, Inc. | 4.912 | 273 | ||||||
| 2026-01-26 | 13F | United Advisor Group, LLC | 7.933 | 58,12 | 441 | 66,67 | ||||
| 2026-02-17 | 13F | Advisory Services Network, LLC | 0 | -100,00 | 0 | |||||
| 2026-02-13 | 13F | Navis Wealth Advisors, LLC | 10.602 | 589 | ||||||
| 2026-02-17 | 13F | Raymond James Financial Inc | 650.553 | 32,38 | 36.153 | 39,62 | ||||
| 2026-02-05 | 13F | Allworth Financial LP | 538 | 1,32 | 30 | 3,57 | ||||
| 2025-10-21 | 13F | Brookwood Investment Group LLC | 0 | -100,00 | 0 | |||||
| 2026-02-02 | 13F | Total Clarity Wealth Management, Inc. | 7.669 | -0,90 | 426 | 4,67 | ||||
| 2026-02-05 | 13F | Cambridge Investment Research Advisors, Inc. | 65.637 | 112,13 | 4 | 200,00 | ||||
| 2025-11-13 | 13F | Fmr Llc | 0 | -100,00 | 0 | -100,00 | ||||
| 2026-01-16 | 13F | Trust Co Of Vermont | 500 | 28 | ||||||
| 2026-01-26 | 13F | Patriot Financial Group Insurance Agency, LLC | 13.675 | 15,64 | 760 | 21,83 | ||||
| 2026-01-29 | 13F | Camelot Portfolios, LLC | 231 | 13 | ||||||
| 2026-02-11 | 13F | LPL Financial LLC | 551.633 | 27,34 | 30.656 | 34,30 | ||||
| 2026-01-28 | 13F | Trademark Financial Management, LLC | 6.755 | 2,64 | 375 | 8,38 | ||||
| 2026-01-23 | 13F | Kellett Schaffner Wealth Advisors LLC | 246.102 | 3,65 | 13.677 | 9,32 | ||||
| 2026-02-06 | 13F | McKinley Carter Wealth Services, Inc. | 3.877 | 0,00 | 215 | 5,39 | ||||
| 2026-02-10 | 13F | Root Financial Partners, LLC | 1.944 | 0,00 | 108 | 5,88 | ||||
| 2026-02-12 | 13F | Steward Partners Investment Advisory, Llc | 123 | -93,44 | 7 | -92,41 | ||||
| 2026-01-23 | 13F | Farther Finance Advisors, LLC | 37.788 | -14,79 | 2.100 | -10,10 | ||||
| 2026-02-05 | 13F | USAdvisors Wealth Management, LLC | 4.725 | 0,00 | 0 | |||||
| 2026-02-06 | 13F | Global Retirement Partners, LLC | 282 | 0,00 | 16 | 7,14 | ||||
| 2026-02-10 | 13F | Essex Financial Services, Inc. | 8.028 | 0,00 | 446 | 5,69 | ||||
| 2026-02-13 | 13F | QTR Family Wealth, LLC | 5.488 | -2,52 | 329 | 10,81 | ||||
| 2026-02-12 | 13F | Jane Street Group, Llc | 50.000 | 1.131,83 | 2.779 | 1.204,23 | ||||
| 2026-02-19 | 13F | ATX Financial Planning, LLC | 14.458 | 803 | ||||||
| 2026-02-10 | 13F/A | Northwestern Mutual Wealth Management Co | 24.583 | 1.366 | ||||||
| 2026-02-17 | 13F | Equitable Holdings, Inc. | 36.172 | 2,25 | 2.010 | 7,89 | ||||
| 2026-02-12 | 13F | Federation des caisses Desjardins du Quebec | 1.070 | -10,83 | 59 | -6,35 | ||||
| 2025-11-06 | 13F | Ameritas Advisory Services, LLC | 0 | -100,00 | 0 |