Grundlæggende statistik
| Institutionelle ejere | 147 total, 147 long only, 0 short only, 0 long/short - change of 4,96% MRQ |
| Gennemsnitlig porteføljeallokering | 0.2479 % - change of -18,38% MRQ |
| Institutionelle aktier (lange) | 19.228.538 (ex 13D/G) - change of -6,08MM shares -24,03% MRQ |
| Institutionel værdi (lang) | $ 1.267.233 USD ($1000) |
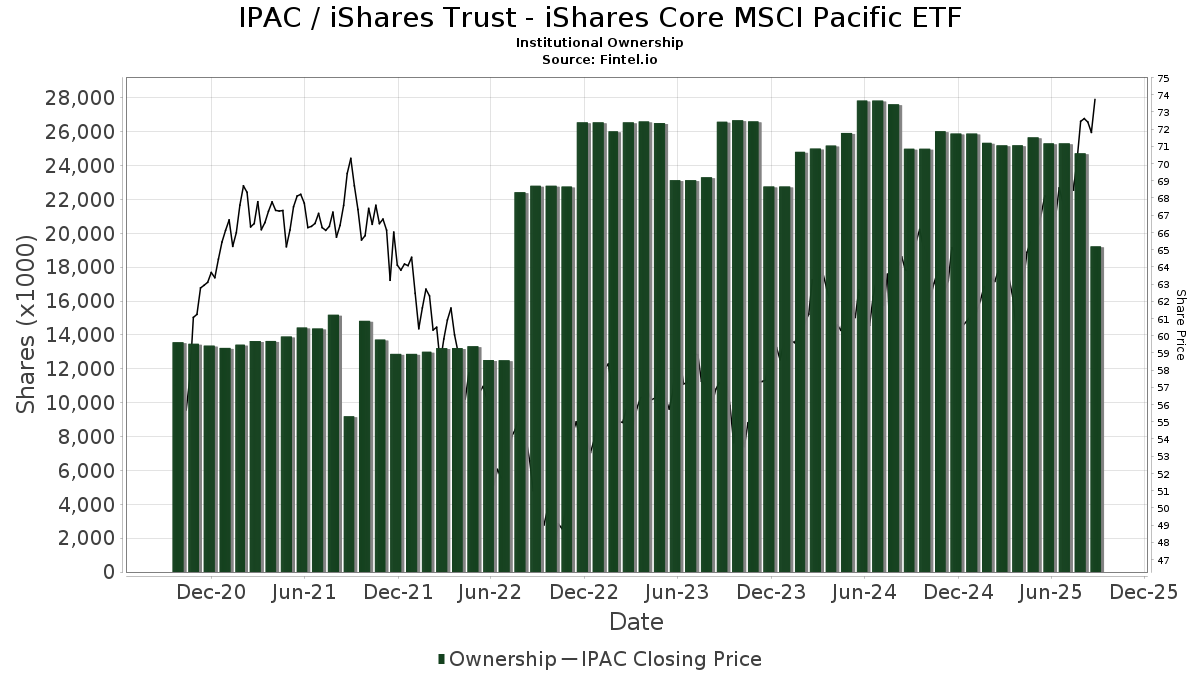
Institutionelt ejerskab og aktionærer
iShares Trust - iShares Core MSCI Pacific ETF (US:IPAC) har 147 institutionelle ejere og aktionærer, der har indsendt 13D/G- eller 13F-formularer til Securities Exchange Commission (SEC). Disse institutioner har i alt 19,228,538 aktier. Største aktionærer omfatter Ronald Blue Trust, Inc., Jpmorgan Chase & Co, Assetmark, Inc, Charles Schwab Investment Management Inc, Morgan Stanley, Mather Group, Llc., Envestnet Asset Management Inc, Stifel Financial Corp, Elm Partners Management LLC, and Cetera Investment Advisers .
iShares Trust - iShares Core MSCI Pacific ETF (ARCA:IPAC) institutionel ejerskabsstruktur viser aktuelle positioner i virksomheden efter institutioner og fonde, samt seneste ændringer i positionsstørrelse. Større aktionærer kan omfatte individuelle investorer, investeringsforeninger, hedgefonde eller institutioner. Skema 13D angiver, at investoren besidder (eller besidder) mere end 5 % af virksomheden og har til hensigt (eller har til hensigt at) aktivt at forfølge en ændring i forretningsstrategi. Skema 13G indikerer en passiv investering på over 5%.
The share price as of September 18, 2025 is 74,24 / share. Previously, on September 19, 2024, the share price was 65,77 / share. This represents an increase of 12,88% over that period.
Fondens stemningsscore
Fund Sentiment Score (fka Ownership Accumulation Score) finder de aktier, der bliver mest købt af fonde. Det er resultatet af en sofistikeret, multi-faktor kvantitativ model, der identificerer virksomheder med de højeste niveauer af institutionel akkumulering. Scoringsmodellen bruger en kombination af den samlede stigning i oplyste ejere, ændringerne i porteføljeallokeringer i disse ejere og andre målinger. Tallet går fra 0 til 100, hvor højere tal indikerer et højere niveau af akkumulering for sine jævnaldrende, og 50 er gennemsnittet.
Opdateringsfrekvens: Dagligt
Se Ownership Explorer, som giver en liste over højest rangerende virksomheder.
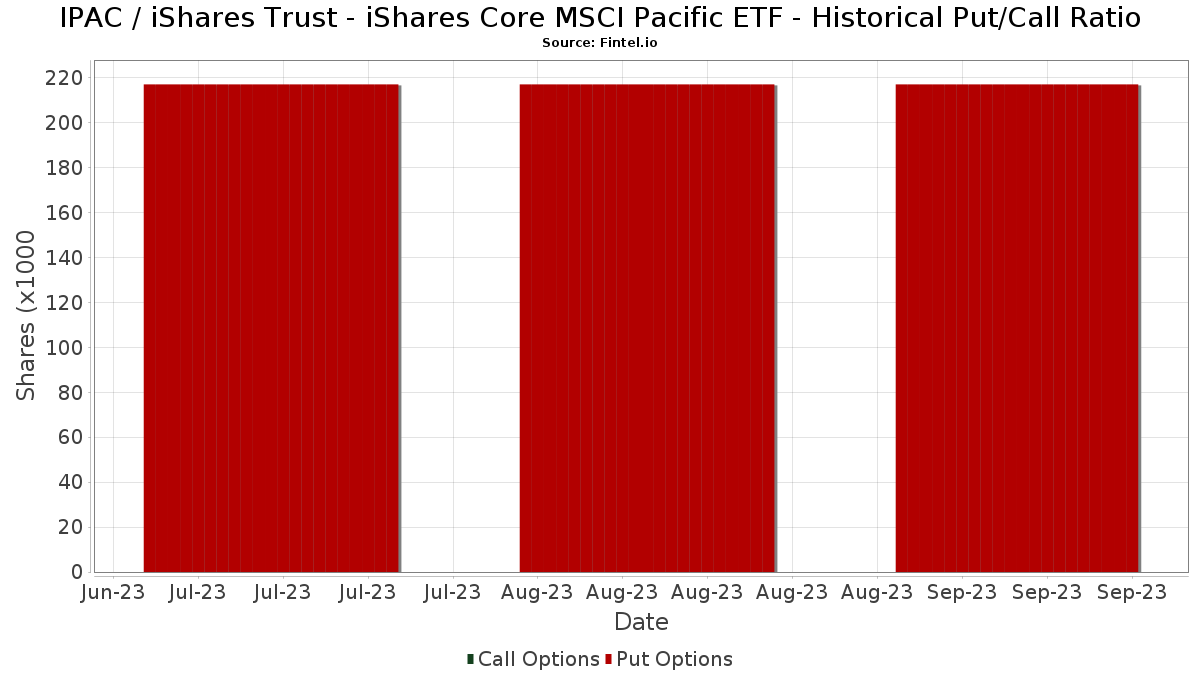
Institutionel Put/Call-forhold
Ud over at indberette standardaktie- og gældsudstedelser skal institutter med mere end 100 mill. aktiver under forvaltning også oplyse deres put- og call-optionsbeholdninger. Da salgsoptioner generelt indikerer negativ stemning, og købsoptioner indikerer positiv stemning, kan vi få en fornemmelse af den overordnede institutionelle stemning ved at plotte forholdet mellem put og kald. Diagrammet til højre viser det historiske put/call-forhold for dette instrument.
Brug af Put/Call Ratio som en indikator for investorernes stemning overvinder en af de vigtigste mangler ved at bruge totalt institutionelt ejerskab, som er, at en betydelig mængde af aktiver under forvaltning investeres passivt for at spore indekser. Passivt forvaltede fonde køber typisk ikke optioner, så indikatoren for put/call-forholdet følger mere nøje følelsen af aktivt forvaltede fonde.
13F og NPORT arkivering
Detaljer om 13F-arkivering er gratis. Detaljer om NP-ansøgninger kræver et premium-medlemskab. Grønne rækker angiver nye positioner. Røde rækker angiver lukkede positioner. Klik på linket ikon for at se den fulde transaktionshistorik.
Opgrader
for at låse premium-data op og eksportere til Excel ![]() .
.
| Fil dato | Kilde | Investor | Type | Gennemsnitlig pris (Øst) |
Aktier | Δ Aktier (%) |
Rapporteret Værdi ($1000) |
Δ Værdi (%) |
Port Alloc (%) |
|
|---|---|---|---|---|---|---|---|---|---|---|
| 2025-08-14 | 13F | Quantinno Capital Management LP | 18.392 | 1.264 | ||||||
| 2025-07-24 | 13F | Robertson Stephens Wealth Management, LLC | 39.972 | -13,33 | 2.746 | -4,32 | ||||
| 2025-08-08 | 13F | Avantax Advisory Services, Inc. | 3.998 | -26,11 | 275 | -18,45 | ||||
| 2025-07-08 | 13F | Lowe Wealth Advisors, LLC | 2.325 | 0,00 | 160 | 10,42 | ||||
| 2025-08-06 | 13F | Hoxton Planning & Management, LLC | 3.050 | 210 | ||||||
| 2025-05-01 | 13F | Bleakley Financial Group, LLC | 0 | -100,00 | 0 | -100,00 | ||||
| 2025-07-10 | 13F | Global Financial Private Client, LLC | 17.315 | 0,41 | 1.190 | 10,81 | ||||
| 2025-07-02 | 13F | Central Pacific Bank - Trust Division | 9 | 0,00 | 1 | |||||
| 2025-07-16 | 13F | Perigon Wealth Management, LLC | 28.158 | 1.934 | ||||||
| 2025-07-30 | 13F | Bogart Wealth, LLC | 710 | 0,00 | 49 | 9,09 | ||||
| 2025-07-30 | 13F | Rehmann Capital Advisory Group | 6.089 | 0,00 | 418 | 10,58 | ||||
| 2025-04-30 | 13F | Sofos Investments, Inc. | 56.255 | 9,77 | 3.501 | 11,71 | ||||
| 2025-08-14 | 13F | Royal Bank Of Canada | 26.625 | -47,21 | 1.829 | -41,71 | ||||
| 2025-05-09 | 13F | GeoWealth Management, LLC | 0 | -100,00 | 0 | |||||
| 2025-07-29 | 13F | Yoffe Investment Management, LLC | 9.221 | 0,25 | 633 | 10,66 | ||||
| 2025-07-10 | 13F | Wedmont Private Capital | 0 | -100,00 | 0 | |||||
| 2025-07-15 | 13F | Mather Group, Llc. | 653.467 | 8,97 | 44.893 | 20,28 | ||||
| 2025-08-13 | 13F | Invesco Ltd. | 0 | -100,00 | 0 | |||||
| 2025-07-10 | 13F | Security National Bank | 2.080 | 143 | ||||||
| 2025-07-09 | 13F | VisionPoint Advisory Group, LLC | 8.494 | 584 | ||||||
| 2025-08-25 | 13F/A | Promus Capital, LLC | 214 | -33,33 | 15 | -26,32 | ||||
| 2025-07-18 | 13F | Tanager Wealth Management LLP | 10.635 | 731 | ||||||
| 2025-08-15 | 13F | Tower Research Capital LLC (TRC) | 0 | -100,00 | 0 | |||||
| 2025-07-09 | 13F | Sapient Capital Llc | 8.317 | 571 | ||||||
| 2025-07-24 | 13F | Blair William & Co/il | 139 | 10 | ||||||
| 2025-08-14 | 13F | GWM Advisors LLC | 5.410 | -0,92 | 372 | 9,44 | ||||
| 2025-07-16 | 13F | John W. Brooker & Co., CPAs | 0 | -100,00 | 0 | |||||
| 2025-08-04 | 13F | Municipal Employees' Retirement System of Michigan | 0 | -100,00 | 0 | |||||
| 2025-07-28 | 13F | Harbour Investments, Inc. | 21 | 0,00 | 1 | 0,00 | ||||
| 2025-07-08 | 13F | Nbc Securities, Inc. | 349 | 0,00 | 0 | |||||
| 2025-08-12 | 13F | Proequities, Inc. | 0 | 0 | ||||||
| 2025-07-11 | 13F | Mandatum Life Insurance Co Ltd | 155.637 | 24,06 | 10.692 | 36,94 | ||||
| 2025-07-24 | 13F | Ronald Blue Trust, Inc. | 6.996.027 | -3,37 | 480.627 | 6,66 | ||||
| 2025-07-31 | 13F | GenTrust, LLC | 137.140 | -2,23 | 9.422 | 7,93 | ||||
| 2025-07-23 | 13F | Family Legacy, Inc. | 24.220 | 1,59 | 1.664 | 12,14 | ||||
| 2025-08-12 | 13F | BlackRock, Inc. | 205 | 0,00 | 14 | 16,67 | ||||
| 2025-08-05 | 13F | Elm Partners Management LLC | 476.862 | 24,89 | 32.760 | 37,86 | ||||
| 2025-08-12 | 13F | Howe & Rusling Inc | 0 | -100,00 | 0 | -100,00 | ||||
| 2025-08-14 | 13F | Qube Research & Technologies Ltd | 0 | -100,00 | 0 | |||||
| 2025-08-08 | 13F | Compass Wealth Management LLC | 2.961 | -3,27 | 203 | 6,84 | ||||
| 2025-08-14 | 13F | Cardiff Park Advisors, Llc | 1.291 | 0,00 | 89 | 10,00 | ||||
| 2025-07-25 | 13F | Cwm, Llc | 33.730 | 2.558,00 | 2 | |||||
| 2025-08-07 | 13F | Resources Investment Advisors, LLC. | 4.974 | 0,48 | 342 | 10,71 | ||||
| 2025-08-08 | 13F | Creative Planning | 54.251 | -3,60 | 3.727 | 6,42 | ||||
| 2025-08-11 | 13F | United Capital Financial Advisers, Llc | 83.749 | -6,14 | 5.754 | 3,60 | ||||
| 2025-08-08 | 13F | ERTS Wealth Advisors, LLC | 135.449 | -38,78 | 9.305 | -32,43 | ||||
| 2025-08-14 | 13F | Raymond James Financial Inc | 6.076 | 1,57 | 417 | 12,10 | ||||
| 2025-08-15 | 13F | Morgan Stanley | 882.289 | 0,37 | 60.613 | 10,79 | ||||
| 2025-08-07 | 13F | Allworth Financial LP | 3.998 | 0,00 | 275 | 7,45 | ||||
| 2025-08-12 | 13F | Charles Schwab Investment Management Inc | 965.523 | -3,54 | 66.331 | 6,47 | ||||
| 2025-07-31 | 13F | CVA Family Office, LLC | 1.085 | 0,00 | 75 | 10,45 | ||||
| 2025-08-07 | 13F | Addison Advisors LLC | 2.690 | 0,00 | 185 | 10,18 | ||||
| 2025-07-31 | 13F | Wealthfront Advisers Llc | 0 | -100,00 | 0 | |||||
| 2025-07-10 | 13F | Redhawk Wealth Advisors, Inc. | 0 | -100,00 | 0 | |||||
| 2025-08-04 | 13F | Savvy Advisors, Inc. | 3.336 | 229 | ||||||
| 2025-08-19 | 13F | Delos Wealth Advisors, LLC | 10 | 1 | ||||||
| 2025-08-06 | 13F | Legacy Investment Solutions, LLC | 43 | 0,00 | 3 | 0,00 | ||||
| 2025-08-14 | 13F | Mml Investors Services, Llc | 3.900 | 18,47 | 0 | |||||
| 2025-08-08 | 13F | Pnc Financial Services Group, Inc. | 31 | -24,39 | 2 | 0,00 | ||||
| 2025-08-12 | 13F | CIBC Private Wealth Group, LLC | 973 | 13,80 | 67 | 40,43 | ||||
| 2025-05-15 | 13F | Mercer Global Advisors Inc /adv | 0 | -100,00 | 0 | |||||
| 2025-08-08 | 13F | Financial Gravity Companies, Inc. | 59.306 | 16,37 | 4.074 | 30,87 | ||||
| 2025-08-12 | 13F | Atlas Capital Advisors Llc | 27.968 | -13,96 | 1.921 | -5,04 | ||||
| 2025-07-08 | 13F/A | Salem Investment Counselors Inc | 301 | 0,00 | 21 | 11,11 | ||||
| 2025-08-05 | 13F | Harel Insurance Investments & Financial Services Ltd. | 5.434 | 0,00 | 0 | |||||
| 2025-05-09 | 13F | TD Waterhouse Canada Inc. | 0 | -100,00 | 0 | |||||
| 2025-08-11 | 13F | Private Advisor Group, LLC | 4.098 | 282 | ||||||
| 2025-08-06 | 13F | Walkner Condon Financial Advisors LLC | 4.772 | 0,91 | 328 | 11,22 | ||||
| 2025-08-12 | 13F | MAI Capital Management | 2.223 | 0,00 | 153 | 10,14 | ||||
| 2025-08-05 | 13F | Dunhill Financial, LLC | 194 | 13 | ||||||
| 2025-07-21 | 13F | Greenwood Capital Associates Llc | 163.950 | 4,53 | 11.263 | 15,39 | ||||
| 2025-08-14 | 13F | Integrated Wealth Concepts LLC | 3.732 | 2,70 | 256 | 13,27 | ||||
| 2025-08-06 | 13F | Legacy Wealth Managment, LLC/ID | 43 | 0,00 | 3 | 0,00 | ||||
| 2025-05-02 | 13F | Signaturefd, Llc | 0 | -100,00 | 0 | |||||
| 2025-04-04 | 13F | Quent Capital, LLC | 0 | -100,00 | 0 | |||||
| 2025-08-15 | 13F | Captrust Financial Advisors | 4.164 | 0,87 | 286 | 11,72 | ||||
| 2025-08-12 | 13F | Steward Partners Investment Advisory, Llc | 376 | 14,98 | 26 | 25,00 | ||||
| 2025-07-24 | 13F | Williams & Novak, LLC | 10.765 | -12,23 | 740 | -3,15 | ||||
| 2025-08-14 | 13F | Susquehanna International Group, Llp | 75.291 | 234,42 | 5.172 | 269,16 | ||||
| 2025-08-14 | 13F | IHT Wealth Management, LLC | 3.613 | 248 | ||||||
| 2025-08-11 | 13F | Strategic Wealth Partners, Ltd. | 1.484 | 102 | ||||||
| 2025-05-14 | 13F | Capital Analysts, Inc. | 0 | -100,00 | 0 | |||||
| 2025-08-20 | 13F/A | Coppell Advisory Solutions LLC | 6.428 | 442 | ||||||
| 2025-08-01 | 13F | Envestnet Asset Management Inc | 603.458 | -5,69 | 41.453 | 4,09 | ||||
| 2025-07-22 | 13F | Coastal Investment Advisors, Inc. | 4 | 0,00 | 0 | |||||
| 2025-08-13 | 13F | EverSource Wealth Advisors, LLC | 6 | 0,00 | 0 | |||||
| 2025-07-21 | 13F | Mirae Asset Global Investments Co., Ltd. | 7.730 | 6,47 | 531 | 16,70 | ||||
| 2025-07-24 | 13F | JNBA Financial Advisors | 0 | -100,00 | 0 | |||||
| 2025-07-23 | 13F | Vontobel Holding Ltd. | 20.403 | 1,57 | 1.402 | 12,08 | ||||
| 2025-08-14 | 13F | UBS Group AG | 89.476 | -6,53 | 6.147 | 3,19 | ||||
| 2025-07-24 | 13F | Stonebridge Financial Group, LLC | 0 | -100,00 | 0 | |||||
| 2025-08-08 | 13F | Cetera Investment Advisers | 399.916 | -10,49 | 27.474 | -1,20 | ||||
| 2025-07-23 | 13F | Prime Capital Investment Advisors, LLC | 71.965 | -1,06 | 4.944 | 9,19 | ||||
| 2025-08-14 | 13F | Comerica Bank | 916 | 0,00 | 63 | 8,77 | ||||
| 2025-07-23 | 13F | Integris Wealth Management, LLC | 79.110 | -1,05 | 5.435 | 9,20 | ||||
| 2025-08-12 | 13F | Jpmorgan Chase & Co | 1.823.056 | 61,26 | 125.244 | 78,00 | ||||
| 2025-04-22 | 13F/A | NorthRock Partners, LLC | 0 | -100,00 | 0 | -100,00 | ||||
| 2025-05-09 | 13F | Atria Wealth Solutions, Inc. | 0 | -100,00 | 0 | |||||
| 2025-08-04 | 13F | B&l Asset Management Llc | 8.750 | 601 | ||||||
| 2025-08-28 | NP | ELM - Elm Market Navigator ETF | 293.528 | 11,04 | 20.165 | 22,57 | ||||
| 2025-08-04 | 13F | AlphaStar Capital Management, LLC | 175.984 | 0,86 | 12.090 | 11,34 | ||||
| 2025-08-12 | 13F | LPL Financial LLC | 93.974 | 7,34 | 6.456 | 18,50 | ||||
| 2025-07-25 | 13F | Inman Jager Wealth Management, LLC | 14.139 | -3,85 | 971 | 6,12 | ||||
| 2025-07-22 | 13F | Belpointe Asset Management LLC | 4.739 | -3,13 | 326 | 6,91 | ||||
| 2025-08-05 | 13F | Bank Of Montreal /can/ | 482 | -15,44 | 33 | -5,71 | ||||
| 2025-08-15 | 13F | CI Private Wealth, LLC | 9.644 | -1,03 | 663 | 9,24 | ||||
| 2025-08-07 | 13F | FDx Advisors, Inc. | 48.948 | -5,47 | 3 | 0,00 | ||||
| 2025-08-14 | 13F | Vident Advisory, LLC | 140.242 | 2,67 | 9.635 | 13,31 | ||||
| 2025-07-22 | 13F | Iron Horse Wealth Management, LLC | 340 | 19,72 | 23 | 35,29 | ||||
| 2025-08-15 | 13F | Blue Edge Capital, LLC | 120.729 | 0,01 | 8.294 | 10,40 | ||||
| 2025-07-17 | 13F | Guyasuta Investment Advisors Inc | 4.077 | 0,00 | 280 | 10,67 | ||||
| 2025-07-03 | 13F | Garde Capital, Inc. | 142.939 | 0,64 | 9.820 | 11,09 | ||||
| 2025-07-07 | 13F | Kings Path Partners LLC | 586 | -47,58 | 40 | -42,03 | ||||
| 2025-08-14 | 13F | Vista Private Wealth Partners. LLC | 37.724 | 7,60 | 2.592 | 18,74 | ||||
| 2025-08-14 | 13F | Ameriprise Financial Inc | 6.284 | -6,64 | 432 | 3,11 | ||||
| 2025-07-29 | 13F | APCM Wealth Management for Individuals | 3.014 | 207 | ||||||
| 2025-08-11 | 13F | HighTower Advisors, LLC | 13.670 | 7,63 | 939 | 18,86 | ||||
| 2025-08-13 | 13F | Millington Financial Advisors, LLC | 26.822 | -8,28 | 1.886 | 7,53 | ||||
| 2025-08-04 | 13F | Assetmark, Inc | 989.465 | -10,59 | 67.976 | -1,31 | ||||
| 2025-08-13 | 13F | Allie Family Office LLC | 3.167 | 0,00 | 218 | 3,33 | ||||
| 2025-08-06 | 13F | AE Wealth Management LLC | 570 | 216,67 | 39 | 254,55 | ||||
| 2025-08-14 | 13F | Fmr Llc | 7.556 | -2,39 | 519 | 7,90 | ||||
| 2025-08-14 | 13F | Wells Fargo & Company/mn | 138.231 | 15,03 | 9.496 | 26,97 | ||||
| 2025-08-08 | 13F | Gts Securities Llc | 10.241 | 704 | ||||||
| 2025-08-11 | 13F | PAX Financial Group, LLC | 26.661 | -15,13 | 1.832 | -6,34 | ||||
| 2025-08-14 | 13F | Citadel Advisors Llc | 313.669 | 1.532,08 | 21.549 | 1.701,76 | ||||
| 2025-08-06 | 13F | Csenge Advisory Group | 9.073 | -3,46 | 612 | 5,15 | ||||
| 2025-07-31 | 13F | Cambridge Investment Research Advisors, Inc. | 8.558 | 24,79 | 1 | |||||
| 2025-07-25 | 13F | Richardson Financial Services Inc. | 19.560 | -9,31 | 1.339 | -0,30 | ||||
| 2025-08-05 | 13F | Mission Wealth Management, Lp | 3.650 | 0,00 | 251 | 10,13 | ||||
| 2025-08-14 | 13F | Lazard Asset Management Llc | 94.159 | -19,32 | 6 | -14,29 | ||||
| 2025-07-29 | 13F | Koshinski Asset Management, Inc. | 2.998 | 206 | ||||||
| 2025-07-15 | 13F | LVZ Advisors, Inc. | 0 | -100,00 | 0 | |||||
| 2025-05-01 | 13F | Ballentine Partners, LLC | 0 | -100,00 | 0 | |||||
| 2025-07-24 | 13F | Brandywine Oak Private Wealth Llc | 9.446 | 0,00 | 649 | 10,39 | ||||
| 2025-09-04 | 13F/A | Advisor Group Holdings, Inc. | 196.038 | 116,28 | 12.724 | 125,51 | ||||
| 2025-07-25 | 13F | Presilium Private Wealth, Llc | 28.112 | -45,32 | 1.931 | -39,66 | ||||
| 2025-04-16 | 13F | Wealth Enhancement Advisory Services, Llc | 0 | -100,00 | 0 | |||||
| 2025-07-30 | 13F | TFB Advisors LLC | 3.094 | -5,38 | 213 | 4,43 | ||||
| 2025-08-13 | 13F | Northwestern Mutual Wealth Management Co | 2.056 | 34,47 | 141 | 48,42 | ||||
| 2025-07-14 | 13F | Southland Equity Partners LLC | 4.223 | -0,66 | 290 | 9,85 | ||||
| 2025-08-11 | 13F | Principal Securities, Inc. | 0 | -100,00 | 0 | |||||
| 2025-07-18 | 13F | Truist Financial Corp | 40.441 | -0,94 | 2.778 | 9,37 | ||||
| 2025-08-12 | 13F | AlphaCore Capital LLC | 195 | 0,00 | 13 | 8,33 | ||||
| 2025-07-31 | 13F | Brian Low Financial Group, Llc | 4.724 | 325 | ||||||
| 2025-08-11 | 13F | Aptus Capital Advisors, LLC | 56 | 5,66 | 4 | 0,00 | ||||
| 2025-08-06 | 13F | Commonwealth Equity Services, Llc | 12.264 | -15,26 | 1 | |||||
| 2025-08-13 | 13F | Willis Johnson & Associates, Inc. | 34.776 | -4,92 | 2.389 | 4,96 | ||||
| 2025-08-15 | 13F | Keel Point, LLC | 3.122 | 214 | ||||||
| 2025-08-14 | 13F | Bank Of America Corp /de/ | 232.501 | -27,57 | 15.973 | -20,06 | ||||
| 2025-08-14 | 13F | CoreCap Advisors, LLC | 16 | 0,00 | 1 | |||||
| 2025-07-23 | 13F | BankPlus Trust Department | 38 | 0,00 | 3 | 0,00 | ||||
| 2025-07-11 | 13F | Farther Finance Advisors, LLC | 4.679 | -5,30 | 321 | 4,56 | ||||
| 2025-07-23 | 13F | Godsey & Gibb Associates | 0 | -100,00 | 0 | |||||
| 2025-07-24 | 13F | Us Bancorp \de\ | 8.030 | 0,51 | 552 | 10,87 | ||||
| 2025-07-18 | 13F | Dogwood Wealth Management LLC | 31.748 | -9,17 | 2.145 | -1,38 | ||||
| 2025-08-08 | 13F | Smithfield Trust Co | 352.399 | 12,00 | 24 | 26,32 | ||||
| 2025-05-12 | 13F | Aveo Capital Partners, LLC | 0 | -100,00 | 0 | |||||
| 2025-07-23 | 13F | Columbus Macro, LLC | 88.990 | -26,47 | 6.114 | -18,85 | ||||
| 2025-08-14 | 13F | Jane Street Group, Llc | 0 | -100,00 | 0 | |||||
| 2025-08-13 | 13F | Northern Trust Corp | 10.565 | 0,00 | 726 | 10,35 | ||||
| 2025-08-14 | 13F | Stifel Financial Corp | 549.389 | 2,05 | 37.743 | 12,65 | ||||
| 2025-07-21 | 13F | Fortis Capital Advisors, LLC | 4.739 | -3,01 | 326 | 6,91 | ||||
| 2025-08-13 | 13F | Jones Financial Companies Lllp | 1.213 | 16,97 | 83 | 27,69 | ||||
| 2025-08-14 | 13F | Modern Wealth Management, LLC | 3.021 | 208 | ||||||
| 2025-08-01 | 13F | Bessemer Group Inc | 206.182 | 22,26 | 14 | 40,00 | ||||
| 2025-08-12 | 13F | O'shaughnessy Asset Management, Llc | 594 | 4.142,86 | 41 | |||||
| 2025-08-08 | 13F | Capital Investment Advisory Services, LLC | 1.646 | -5,78 | 113 | 4,63 | ||||
| 2025-07-23 | 13F | Element Wealth, LLC | 8.878 | -7,16 | 610 | 2,35 | ||||
| 2025-08-12 | 13F | Pathstone Holdings, LLC | 3.930 | 0,00 | 270 | 10,25 | ||||
| 2025-08-12 | 13F | Global Retirement Partners, LLC | 236 | -7,45 | 16 | 6,67 | ||||
| 2025-04-24 | 13F | Wingate Wealth Advisors, Inc. | 0 | -100,00 | 0 | |||||
| 2025-08-11 | 13F | Edgemoor Investment Advisors, Inc. | 5.310 | 0,00 | 365 | 10,30 | ||||
| 2025-08-13 | 13F | Amundi | 87.887 | -9,65 | 6.027 | 2,90 | ||||
| 2025-05-15 | 13F | Oxford Financial Group Ltd | 0 | -100,00 | 0 | |||||
| 2025-08-06 | 13F | Hallmark Capital Management Inc | 158.671 | -3,71 | 10.901 | 6,28 | ||||
| 2025-07-25 | 13F | Concurrent Investment Advisors, LLC | 7.279 | 500 | ||||||
| 2025-08-14 | 13F | Hrt Financial Lp | 0 | -100,00 | 0 |
Other Listings
| MX:IPAC |