Grundlæggende statistik
| Institutionelle ejere | 87 total, 87 long only, 0 short only, 0 long/short - change of 22,54% MRQ |
| Gennemsnitlig porteføljeallokering | 0.2070 % - change of 9,30% MRQ |
| Institutionelle aktier (lange) | 11.976.082 (ex 13D/G) - change of 4,73MM shares 66,18% MRQ |
| Institutionel værdi (lang) | $ 284.697 USD ($1000) |
Institutionelt ejerskab og aktionærer
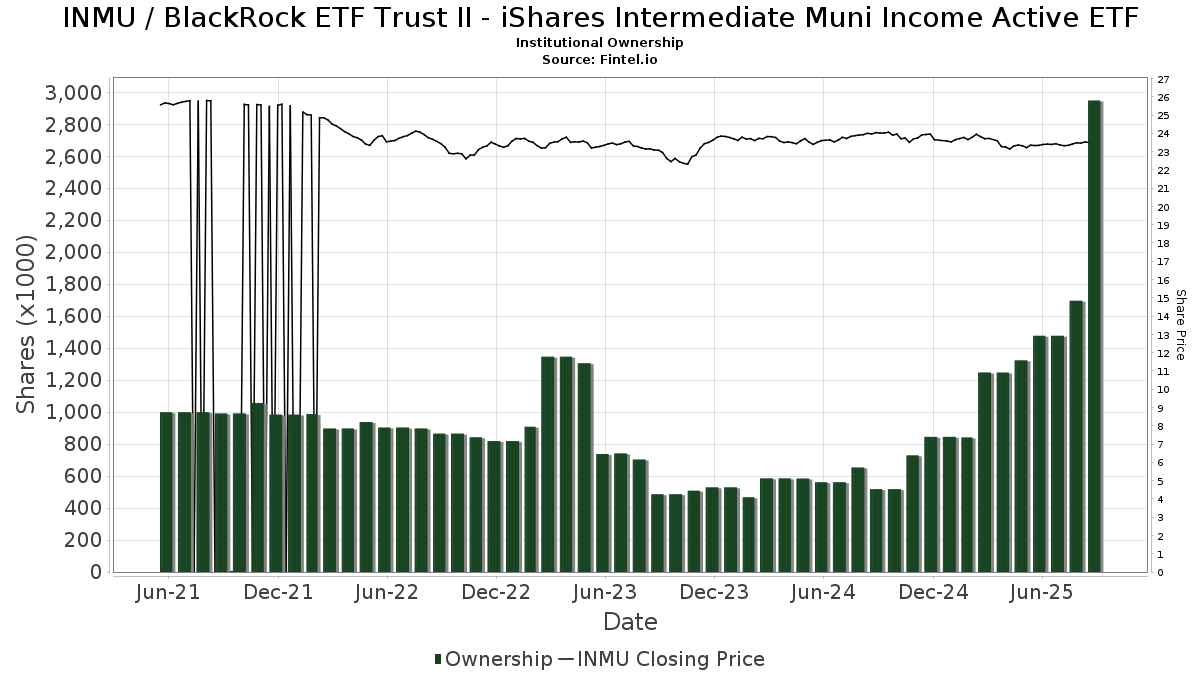
BlackRock ETF Trust II - iShares Intermediate Muni Income Active ETF (US:INMU) har 87 institutionelle ejere og aktionærer, der har indsendt 13D/G- eller 13F-formularer til Securities Exchange Commission (SEC). Disse institutioner har i alt 11,976,082 aktier. Største aktionærer omfatter Dynasty Wealth Management, Llc, Jpmorgan Chase & Co, LPL Financial LLC, Sagespring Wealth Partners, Llc, Larson Financial Group LLC, OpenArc Corporate Advisory, LLC, Commonwealth Equity Services, Llc, Envestnet Asset Management Inc, Cetera Investment Advisers, and Keystone Financial Group, Inc. .
BlackRock ETF Trust II - iShares Intermediate Muni Income Active ETF (ARCA:INMU) institutionel ejerskabsstruktur viser aktuelle positioner i virksomheden efter institutioner og fonde, samt seneste ændringer i positionsstørrelse. Større aktionærer kan omfatte individuelle investorer, investeringsforeninger, hedgefonde eller institutioner. Skema 13D angiver, at investoren besidder (eller besidder) mere end 5 % af virksomheden og har til hensigt (eller har til hensigt at) aktivt at forfølge en ændring i forretningsstrategi. Skema 13G indikerer en passiv investering på over 5%.
The share price as of April 17, 2026 is 24,16 / share. Previously, on April 21, 2025, the share price was 23,10 / share. This represents an increase of 4,59% over that period.
Fondens stemningsscore
Fund Sentiment Score (fka Ownership Accumulation Score) finder de aktier, der bliver mest købt af fonde. Det er resultatet af en sofistikeret, multi-faktor kvantitativ model, der identificerer virksomheder med de højeste niveauer af institutionel akkumulering. Scoringsmodellen bruger en kombination af den samlede stigning i oplyste ejere, ændringerne i porteføljeallokeringer i disse ejere og andre målinger. Tallet går fra 0 til 100, hvor højere tal indikerer et højere niveau af akkumulering for sine jævnaldrende, og 50 er gennemsnittet.
Opdateringsfrekvens: Dagligt
Se Ownership Explorer, som giver en liste over højest rangerende virksomheder.
AI+ Ask Fintel’s AI assistant about BlackRock ETF Trust II - iShares Intermediate Muni Income Active ETF.
Select a question to share a public post with an AI-crafted answer.
Thinking of good questions…
Institutionel Put/Call-forhold
Ud over at indberette standardaktie- og gældsudstedelser skal institutter med mere end 100 mill. aktiver under forvaltning også oplyse deres put- og call-optionsbeholdninger. Da salgsoptioner generelt indikerer negativ stemning, og købsoptioner indikerer positiv stemning, kan vi få en fornemmelse af den overordnede institutionelle stemning ved at plotte forholdet mellem put og kald. Diagrammet til højre viser det historiske put/call-forhold for dette instrument.
Brug af Put/Call Ratio som en indikator for investorernes stemning overvinder en af de vigtigste mangler ved at bruge totalt institutionelt ejerskab, som er, at en betydelig mængde af aktiver under forvaltning investeres passivt for at spore indekser. Passivt forvaltede fonde køber typisk ikke optioner, så indikatoren for put/call-forholdet følger mere nøje følelsen af aktivt forvaltede fonde.
13F og NPORT arkivering
Detaljer om 13F-arkivering er gratis. Detaljer om NP-ansøgninger kræver et premium-medlemskab. Grønne rækker angiver nye positioner. Røde rækker angiver lukkede positioner. Klik på linket ikon for at se den fulde transaktionshistorik.
Opgrader
for at låse premium-data op og eksportere til Excel ![]() .
.
| Fil dato | Kilde | Investor | Type | Gennemsnitlig pris (Øst) |
Aktier | Δ Aktier (%) |
Rapporteret Værdi ($1000) |
Δ Værdi (%) |
Port Alloc (%) |
|
|---|---|---|---|---|---|---|---|---|---|---|
| 2026-04-08 | 13F | Archer Investment Management, LLC | 127.835 | 504,36 | 3.057 | 501,57 | ||||
| 2026-01-06 | 13F | Unique Wealth, Llc | 172.440 | 4.145 | ||||||
| 2026-02-13 | 13F | Morgan Stanley | 1 | 0,00 | 0 | |||||
| 2026-02-17 | 13F | Tower Research Capital LLC (TRC) | 459 | 11 | ||||||
| 2026-02-13 | 13F | Kestra Advisory Services, LLC | 1.495 | 36 | ||||||
| 2026-02-17 | 13F | Elequin Capital Lp | 22.316 | -33,81 | 536 | -33,50 | ||||
| 2026-02-06 | 13F | Frisch Financial Group, Inc. | 57.806 | 1.390 | ||||||
| 2026-02-13 | 13F | SRS Capital Advisors, Inc. | 32.767 | 788 | ||||||
| 2026-02-13 | 13F | Colony Group, LLC | 45.172 | 260,48 | 1.086 | 262,88 | ||||
| 2026-02-06 | 13F | Envestnet Portfolio Solutions, Inc. | 0 | -100,00 | 0 | |||||
| 2026-01-16 | 13F | Keystone Financial Group, Inc. | 267.005 | 7,70 | 6.419 | 8,19 | ||||
| 2026-02-06 | 13F | Larson Financial Group LLC | 900.674 | 10,95 | 21.652 | 11,44 | ||||
| 2026-04-07 | 13F | U.S. Capital Wealth Advisors, LLC | 17.034 | 407 | ||||||
| 2026-02-02 | 13F | Truist Financial Corp | 32.626 | 88,92 | 784 | 89,83 | ||||
| 2025-11-06 | 13F | Ameritas Advisory Services, LLC | 0 | -100,00 | 0 | -100,00 | ||||
| 2026-04-20 | 13F | Ronald Blue Trust, Inc. | 2.885 | -21,86 | 69 | -22,73 | ||||
| 2026-02-12 | 13F | Commonwealth Equity Services, Llc | 493.058 | 690,61 | 11.853 | 1.185.200,00 | ||||
| 2026-02-11 | 13F | Liberty Square Wealth Partners Llc | 10.758 | 259 | ||||||
| 2026-02-05 | 13F | Intrua Financial, LLC | 51.530 | 14,01 | 1.239 | 14,52 | ||||
| 2026-01-26 | 13F | Lansing Street Advisors | 39.470 | 39,62 | 949 | 40,24 | ||||
| 2025-11-12 | 13F | Palo Alto Wealth Advisors, Llc | 8.725 | -1,66 | 211 | 1,45 | ||||
| 2026-01-20 | 13F | Chatterton & Associates Inc. | 9.115 | 219 | ||||||
| 2026-04-20 | 13F | McKinley Carter Wealth Services, Inc. | 140.269 | 3,86 | 3.354 | 3,30 | ||||
| 2026-01-12 | 13F | PUREfi Wealth, LLC | 24.064 | 578 | ||||||
| 2026-02-17 | 13F | Advisory Services Network, LLC | 0 | -100,00 | 0 | |||||
| 2026-04-16 | 13F | Capital Advisors, Ltd. LLC | 4.302 | 0,00 | 0 | |||||
| 2026-02-13 | 13F | OpenArc Corporate Advisory, LLC | 544.745 | 13.096 | ||||||
| 2026-04-07 | 13F | Park Avenue Securities Llc | 43.176 | 1 | ||||||
| 2026-02-12 | 13F | Jane Street Group, Llc | 67.452 | 80,93 | 1.622 | 81,73 | ||||
| 2026-02-13 | 13F | LGT Financial Advisors LLC | 0 | -100,00 | 0 | |||||
| 2026-02-18 | 13F | GWM Advisors LLC | 56.361 | 4,94 | 1.355 | 5,37 | ||||
| 2026-01-27 | 13F | Belpointe Asset Management LLC | 10.430 | -7,94 | 251 | -7,75 | ||||
| 2026-04-20 | 13F | Apella Capital, LLC | 56.978 | 1.377 | ||||||
| 2025-10-23 | 13F | StoneCrest Wealth Management, Inc. | 0 | -100,00 | 0 | |||||
| 2026-02-10 | 13F | Goldman Sachs Group Inc | 8.890 | 214 | ||||||
| 2026-04-09 | 13F | Park Place Capital Corp | 1.510 | -1,05 | 36 | 0,00 | ||||
| 2026-02-17 | 13F | Citadel Advisors Llc | 0 | -100,00 | 0 | |||||
| 2026-02-03 | 13F | Apeiron RIA LLC | 11.559 | 281 | ||||||
| 2026-01-29 | 13F | Dunhill Financial, LLC | 10 | 0,00 | ||||||
| 2026-02-09 | 13F | Fidelis Capital Partners, LLC | 8.865 | 0,00 | 213 | 0,47 | ||||
| 2026-04-08 | 13F | Mma Asset Management Llc | 41.467 | 12,97 | 991 | 12,36 | ||||
| 2026-02-05 | 13F | Paulson Wealth Management Inc. | 200.971 | -1,83 | 4.831 | -1,41 | ||||
| 2026-02-12 | 13F | BlackRock, Inc. | 3.689 | -19,80 | 89 | -20,00 | ||||
| 2026-02-09 | 13F | Kingsview Wealth Management, LLC | 11.065 | 5,03 | 266 | 5,56 | ||||
| 2026-02-20 | 13F | Kovitz Investment Group Partners, LLC | 0 | -100,00 | 0 | |||||
| 2026-04-15 | 13F | Silverlake Wealth Management Llc | 39.745 | 950 | ||||||
| 2026-02-05 | 13F | Cambridge Investment Research Advisors, Inc. | 37.741 | 3,37 | 1 | |||||
| 2026-04-15 | 13F | DAVENPORT & Co LLC | 9.806 | 2,62 | 234 | 2,18 | ||||
| 2026-04-17 | 13F | AdvisorNet Financial, Inc | 1.498 | -9,92 | 36 | -10,26 | ||||
| 2025-11-12 | 13F | Creative Financial Designs Inc /adv | 0 | -100,00 | 0 | |||||
| 2026-02-13 | 13F | Mml Investors Services, Llc | 49.445 | -58,11 | 1.189 | -57,95 | ||||
| 2026-04-10 | 13F | Novem Group | 19.490 | 8,63 | 466 | 7,89 | ||||
| 2026-02-17 | 13F | Advisor Group Holdings, Inc. | 44.280 | 69,57 | 1.064 | 70,79 | ||||
| 2026-04-14 | 13F | Centerline Wealth Advisors, LLC | 101.214 | -18,05 | 2.420 | -18,49 | ||||
| 2026-02-06 | 13F | HighTower Advisors, LLC | 114.285 | 35,39 | 2.747 | 35,99 | ||||
| 2026-01-07 | 13F | Magnus Financial Group LLC | 0 | -100,00 | 0 | |||||
| 2026-02-02 | 13F | Cornerstone Planning Group LLC | 145 | -55,25 | 4 | -57,14 | ||||
| 2026-02-05 | 13F | Cornerstone Wealth Management, LLC | 8.355 | 201 | ||||||
| 2026-02-12 | 13F | Principal Securities, Inc. | 0 | -100,00 | 0 | -100,00 | ||||
| 2026-04-13 | 13F | Massmutual Trust Co Fsb/adv | 15.065 | 360 | ||||||
| 2026-01-23 | 13F | SimpliFi, Inc. | 44.259 | -2,59 | 1.064 | -2,21 | ||||
| 2026-02-13 | 13F | Beacon Capital Management, LLC | 8.378 | 201 | ||||||
| 2026-01-23 | 13F | Financial Connections Group, Inc. | 6.587 | 0 | ||||||
| 2026-02-10 | 13F | Beto Financial Group, Llc | 9.473 | 230 | ||||||
| 2026-04-13 | 13F | Cyndeo Wealth Partners, LLC | 87.949 | 4,10 | 2.103 | 3,55 | ||||
| 2026-02-06 | 13F | Magnolia Private Wealth, LLC | 13.013 | 313 | ||||||
| 2026-01-26 | 13F | Cwm, Llc | 34.785 | 2,45 | 1 | |||||
| 2026-04-07 | 13F | Farther Finance Advisors, LLC | 1.034 | -61,83 | 25 | -63,08 | ||||
| 2026-02-11 | 13F | Capital Analysts, Inc. | 0 | -100,00 | 0 | |||||
| 2026-02-06 | 13F | Global Retirement Partners, LLC | 1.323 | 0,00 | 32 | 0,00 | ||||
| 2026-02-09 | 13F | Syverson Strege & Co | 19.822 | 0,00 | 477 | 0,42 | ||||
| 2026-02-13 | 13F | Wells Fargo & Company/mn | 13.015 | 0,00 | 313 | 0,32 | ||||
| 2026-01-22 | 13F | Apollon Wealth Management, LLC | 12.400 | 25,25 | 298 | 26,27 | ||||
| 2026-01-29 | 13F | Mattern Capital Management, Llc | 15.964 | -1,19 | 384 | -0,78 | ||||
| 2026-01-29 | 13F | UBS Group AG | 0 | -100,00 | 0 | |||||
| 2026-04-10 | 13F | Financial Partners Group, Inc | 9.138 | 218 | ||||||
| 2026-02-17 | 13F | Wiley Bros.-aintree Capital, Llc | 38.758 | 17,48 | 932 | 18,00 | ||||
| 2026-02-12 | 13F | Logan Capital Management Inc | 0 | -100,00 | 0 | -100,00 | ||||
| 2026-02-05 | 13F | Landmark Wealth Management, LLC | 41.708 | 1,24 | 1.003 | 1,62 | ||||
| 2026-02-05 | 13F | Evergreen Wealth Partners LLC | 25.908 | 623 | ||||||
| 2026-01-16 | 13F | Forte Asset Management Llc | 150.000 | 0,00 | 3.606 | 0,45 | ||||
| 2026-02-13 | 13F | Aptus Capital Advisors, LLC | 701 | -48,11 | 17 | -50,00 | ||||
| 2025-11-14 | 13F | Susquehanna International Group, Llp | 0 | -100,00 | 0 | |||||
| 2026-01-26 | 13F | Private Trust Co Na | 4.838 | 116 | ||||||
| 2026-04-15 | 13F | LongView Wealth Management | 58.898 | 1,55 | 1.420 | 1,21 | ||||
| 2026-02-10 | 13F | Envestnet Asset Management Inc | 329.925 | -63,95 | 7.931 | -63,80 | ||||
| 2026-02-11 | 13F | LPL Financial LLC | 1.584.106 | 17,53 | 38.082 | 18,05 | ||||
| 2026-04-15 | 13F | Merit Financial Group, LLC | 252.938 | 121,71 | 6.048 | 120,53 | ||||
| 2026-02-03 | 13F | We Are One Seven, LLC | 62.643 | 201,98 | 1.506 | 203,43 | ||||
| 2026-04-20 | 13F | Fairvoy Private Wealth, LLC | 8.379 | -7,64 | 200 | -8,26 | ||||
| 2026-02-12 | 13F | Advisory Resource Group | 131.752 | 16,48 | 3.167 | 16,99 | ||||
| 2026-01-21 | 13F | Crews Bank & Trust | 4.300 | 0,00 | 103 | 0,98 | ||||
| 2026-04-20 | 13F | Skyline Advisors, Inc. | 123.923 | 30,98 | 2.963 | 30,30 | ||||
| 2026-01-07 | 13F | Sagespring Wealth Partners, Llc | 1.182.559 | 28.429 | ||||||
| 2026-02-13 | 13F | Smartleaf Asset Management LLC | 8 | -99,55 | 0 | -100,00 | ||||
| 2026-04-08 | 13F | Dynamic Advisor Solutions LLC | 57.330 | 17,38 | 1.371 | 16,70 | ||||
| 2026-02-05 | 13F | Tennessee Valley Asset Management Partners | 20.871 | 8,38 | 502 | 8,91 | ||||
| 2026-02-11 | 13F | Invst, LLC | 0 | -100,00 | 0 | |||||
| 2026-02-13 | 13F | MAI Capital Management | 3.342 | 0,00 | 80 | 1,27 | ||||
| 2026-02-10 | 13F | Dynasty Wealth Management, Llc | 1.744.800 | 41.945 | ||||||
| 2026-02-11 | 13F | Jpmorgan Chase & Co | 1.628.368 | 2.260,88 | 39.146 | 2.272,42 | ||||
| 2026-02-17 | 13F | Cetera Investment Advisers | 272.253 | 6,96 | 6.545 | 7,42 | ||||
| 2026-01-22 | 13F | Pinnacle Bancorp, Inc. | 601 | 35,06 | 14 | 40,00 |