Grundlæggende statistik
| Institutionelle ejere | 142 total, 141 long only, 1 short only, 0 long/short - change of -9,49% MRQ |
| Gennemsnitlig porteføljeallokering | 0.0143 % - change of -56,30% MRQ |
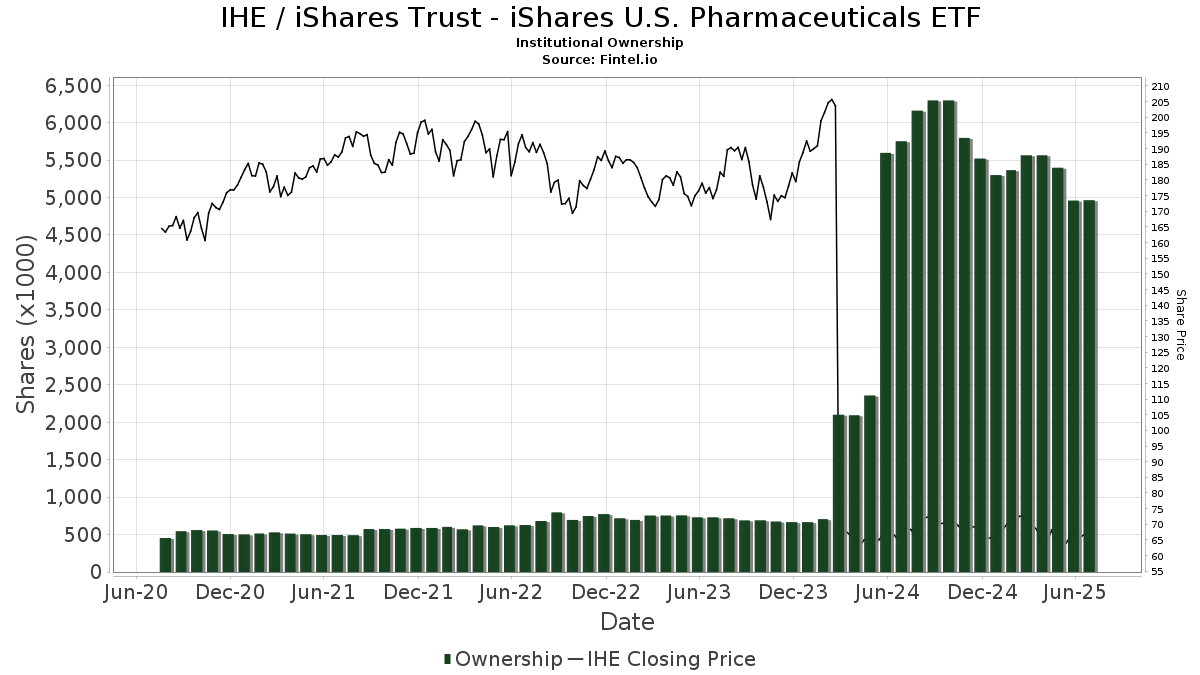
| Institutionelle aktier (lange) | 4.978.755 (ex 13D/G) - change of 0,02MM shares 0,41% MRQ |
| Institutionel værdi (lang) | $ 318.634 USD ($1000) |
Institutionelt ejerskab og aktionærer
iShares Trust - iShares U.S. Pharmaceuticals ETF (US:IHE) har 142 institutionelle ejere og aktionærer, der har indsendt 13D/G- eller 13F-formularer til Securities Exchange Commission (SEC). Disse institutioner har i alt 5,031,815 aktier. Største aktionærer omfatter Fisher Asset Management, LLC, Bnp Paribas Arbitrage, Sa, Morgan Stanley, Goldman Sachs Group Inc, Bank Of America Corp /de/, LPL Financial LLC, Royal Bank Of Canada, Jpmorgan Chase & Co, Brown Advisory Inc, and Raymond James Financial Inc .
iShares Trust - iShares U.S. Pharmaceuticals ETF (ARCA:IHE) institutionel ejerskabsstruktur viser aktuelle positioner i virksomheden efter institutioner og fonde, samt seneste ændringer i positionsstørrelse. Større aktionærer kan omfatte individuelle investorer, investeringsforeninger, hedgefonde eller institutioner. Skema 13D angiver, at investoren besidder (eller besidder) mere end 5 % af virksomheden og har til hensigt (eller har til hensigt at) aktivt at forfølge en ændring i forretningsstrategi. Skema 13G indikerer en passiv investering på over 5%.
The share price as of September 18, 2025 is 70,72 / share. Previously, on September 19, 2024, the share price was 72,20 / share. This represents a decline of 2,05% over that period.
Fondens stemningsscore
Fund Sentiment Score (fka Ownership Accumulation Score) finder de aktier, der bliver mest købt af fonde. Det er resultatet af en sofistikeret, multi-faktor kvantitativ model, der identificerer virksomheder med de højeste niveauer af institutionel akkumulering. Scoringsmodellen bruger en kombination af den samlede stigning i oplyste ejere, ændringerne i porteføljeallokeringer i disse ejere og andre målinger. Tallet går fra 0 til 100, hvor højere tal indikerer et højere niveau af akkumulering for sine jævnaldrende, og 50 er gennemsnittet.
Opdateringsfrekvens: Dagligt
Se Ownership Explorer, som giver en liste over højest rangerende virksomheder.
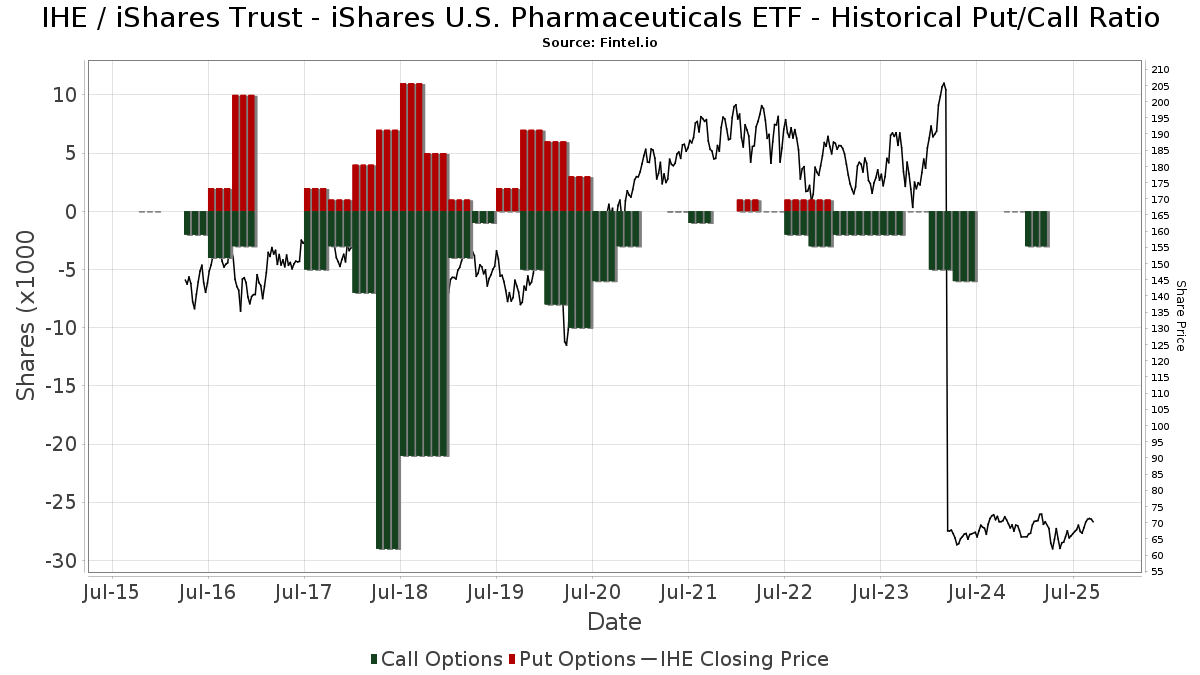
Institutionel Put/Call-forhold
Ud over at indberette standardaktie- og gældsudstedelser skal institutter med mere end 100 mill. aktiver under forvaltning også oplyse deres put- og call-optionsbeholdninger. Da salgsoptioner generelt indikerer negativ stemning, og købsoptioner indikerer positiv stemning, kan vi få en fornemmelse af den overordnede institutionelle stemning ved at plotte forholdet mellem put og kald. Diagrammet til højre viser det historiske put/call-forhold for dette instrument.
Brug af Put/Call Ratio som en indikator for investorernes stemning overvinder en af de vigtigste mangler ved at bruge totalt institutionelt ejerskab, som er, at en betydelig mængde af aktiver under forvaltning investeres passivt for at spore indekser. Passivt forvaltede fonde køber typisk ikke optioner, så indikatoren for put/call-forholdet følger mere nøje følelsen af aktivt forvaltede fonde.
13F og NPORT arkivering
Detaljer om 13F-arkivering er gratis. Detaljer om NP-ansøgninger kræver et premium-medlemskab. Grønne rækker angiver nye positioner. Røde rækker angiver lukkede positioner. Klik på linket ikon for at se den fulde transaktionshistorik.
Opgrader
for at låse premium-data op og eksportere til Excel ![]() .
.
| Fil dato | Kilde | Investor | Type | Gennemsnitlig pris (Øst) |
Aktier | Δ Aktier (%) |
Rapporteret Værdi ($1000) |
Δ Værdi (%) |
Port Alloc (%) |
|
|---|---|---|---|---|---|---|---|---|---|---|
| 2025-08-07 | 13F | Atala Financial Inc | 0 | -100,00 | 0 | |||||
| 2025-08-01 | 13F | Envestnet Asset Management Inc | 8.633 | 2,84 | 566 | -4,56 | ||||
| 2025-08-06 | 13F | Texas Yale Capital Corp. | 12.675 | -1,97 | 831 | -8,99 | ||||
| 2025-08-13 | 13F | Quadrature Capital Ltd | 0 | -100,00 | 0 | |||||
| 2025-07-24 | 13F | IFP Advisors, Inc | 704 | -25,42 | 46 | -30,30 | ||||
| 2025-08-14 | 13F | Peapack Gladstone Financial Corp | 32.835 | -3,69 | 2 | 0,00 | ||||
| 2025-07-30 | 13F | IMG Wealth Management, Inc. | 56 | 0,00 | 4 | 0,00 | ||||
| 2025-08-14 | 13F | Mercer Global Advisors Inc /adv | 3.865 | -3,04 | 253 | -9,96 | ||||
| 2025-04-30 | 13F | Stonebrook Private Inc. | 0 | -100,00 | 0 | |||||
| 2025-07-08 | 13F | Arlington Trust Co LLC | 450 | 0,00 | 29 | -6,45 | ||||
| 2025-08-14 | 13F | Raymond James Financial Inc | 63.564 | 3,17 | 4.166 | -4,16 | ||||
| 2025-04-22 | 13F/A | NorthRock Partners, LLC | 0 | -100,00 | 0 | -100,00 | ||||
| 2025-07-28 | 13F | Axxcess Wealth Management, Llc | 7.063 | 0,47 | 463 | -6,85 | ||||
| 2025-08-04 | 13F | Assetmark, Inc | 306 | -29,17 | 20 | -33,33 | ||||
| 2025-08-13 | 13F | Brown Advisory Inc | 75.432 | -17,17 | 4.944 | -23,07 | ||||
| 2025-08-14 | 13F | Fwl Investment Management, Llc | 84 | -53,33 | 6 | -58,33 | ||||
| 2025-08-08 | 13F | Creative Planning | 6.127 | -3,19 | 402 | -10,09 | ||||
| 2025-08-14 | 13F | Bank Of America Corp /de/ | 121.669 | -13,61 | 7.974 | -19,75 | ||||
| 2025-07-08 | 13F | Nbc Securities, Inc. | 430 | 0,70 | 0 | |||||
| 2025-08-15 | 13F | Provenance Wealth Advisors, LLC | 0 | -100,00 | 0 | -100,00 | ||||
| 2025-07-21 | 13F | Ameriflex Group, Inc. | 291 | 0,00 | 19 | -5,00 | ||||
| 2025-07-09 | 13F | Bruce G. Allen Investments, LLC | 1.404 | 0,50 | 92 | -7,14 | ||||
| 2025-07-25 | 13F | Sequoia Financial Advisors, LLC | 3.433 | 0,00 | 225 | -7,44 | ||||
| 2025-08-04 | 13F | Spinnaker Trust | 18.154 | 0,00 | 1.190 | -7,11 | ||||
| 2025-08-07 | 13F | Cahill Financial Advisors Inc | 20.220 | 0,16 | 1.325 | -6,95 | ||||
| 2025-07-15 | 13F | North Star Investment Management Corp. | 11 | 0,00 | 1 | |||||
| 2025-08-14 | 13F | Sunbelt Securities, Inc. | 3.702 | 243 | ||||||
| 2025-05-15 | 13F | Integrated Wealth Concepts LLC | 0 | -100,00 | 0 | -100,00 | ||||
| 2025-08-08 | 13F | Family Firm, Inc. | 0 | -100,00 | 0 | |||||
| 2025-08-11 | 13F | Y.D. More Investments Ltd | 2.700 | 0,00 | 177 | -7,37 | ||||
| 2025-08-18 | 13F | V2 Financial group LLC | 3.300 | 0,00 | 216 | -6,90 | ||||
| 2025-08-15 | 13F | Kestra Advisory Services, LLC | 4.790 | -9,00 | 314 | -15,63 | ||||
| 2025-07-22 | 13F | Gsa Capital Partners Llp | 0 | -100,00 | 0 | |||||
| 2025-08-11 | 13F | Private Advisor Group, LLC | 4.310 | -7,39 | 282 | -14,02 | ||||
| 2025-08-14 | 13F | Susquehanna International Group, Llp | Call | 0 | -100,00 | 0 | ||||
| 2025-08-12 | 13F | Steward Partners Investment Advisory, Llc | 315 | 21 | ||||||
| 2025-08-15 | 13F | Morgan Stanley | 183.115 | -13,62 | 12.001 | -19,76 | ||||
| 2025-07-28 | 13F | Private Wealth Asset Management, LLC | 150 | 0,00 | 10 | -10,00 | ||||
| 2025-08-14 | 13F | Stifel Financial Corp | 9.600 | -5,04 | 629 | -11,78 | ||||
| 2025-07-28 | 13F | Duncker Streett & Co Inc | 300 | 0,00 | 20 | -9,52 | ||||
| 2025-08-13 | 13F | Jones Financial Companies Lllp | 27.741 | -6,63 | 1.818 | -10,80 | ||||
| 2025-08-12 | 13F | Clearbridge Investments, LLC | 0 | -100,00 | 0 | |||||
| 2025-08-11 | 13F | One Capital Management, LLC | 19.866 | -13,41 | 1.302 | -19,53 | ||||
| 2025-07-14 | 13F | U.S. Capital Wealth Advisors, LLC | 6.668 | 24,13 | 437 | 15,30 | ||||
| 2025-07-31 | 13F | Oppenheimer & Co Inc | 6.786 | 0,00 | 445 | -7,11 | ||||
| 2025-07-16 | 13F | Arkansas Financial Group, Inc. | 7.185 | 7,03 | 477 | 16,63 | ||||
| 2025-08-01 | 13F | Liberty Wealth Management Llc | 0 | -100,00 | 0 | -100,00 | ||||
| 2025-08-14 | 13F | Colony Group, LLC | 3.117 | 0,58 | 204 | -6,42 | ||||
| 2025-08-14 | 13F | GWM Advisors LLC | 1.212 | -43,97 | 79 | -48,03 | ||||
| 2025-04-01 | 13F | Modus Advisors, LLC | 0 | -100,00 | 0 | |||||
| 2025-07-31 | 13F | Jackson Hole Capital Partners, LLC | 750 | 0,00 | 49 | -5,77 | ||||
| 2025-09-04 | 13F/A | Advisor Group Holdings, Inc. | 9.894 | 19,71 | 650 | 11,32 | ||||
| 2025-08-12 | 13F | AlphaCore Capital LLC | 0 | -100,00 | 0 | |||||
| 2025-08-05 | 13F | Bank Of Montreal /can/ | 6.686 | -13,86 | 438 | -19,93 | ||||
| 2025-08-14 | 13F | Private Capital Management, LLC | 3.425 | 0,00 | 224 | -7,05 | ||||
| 2025-08-12 | 13F | Jpmorgan Chase & Co | 110.936 | 781,56 | 7.271 | 719,62 | ||||
| 2025-08-11 | 13F | TD Waterhouse Canada Inc. | 645 | 0,00 | 43 | -2,33 | ||||
| 2025-08-12 | 13F | LPL Financial LLC | 117.808 | -1,72 | 7.721 | -8,70 | ||||
| 2025-08-14 | 13F | Goldman Sachs Group Inc | 138.478 | 32,12 | 9.076 | 22,72 | ||||
| 2025-08-12 | 13F | Manchester Capital Management LLC | 3.000 | 0,00 | 197 | -7,11 | ||||
| 2025-05-15 | 13F | Two Sigma Investments, Lp | 0 | -100,00 | 0 | |||||
| 2025-08-13 | 13F | Russell Investments Group, Ltd. | 318 | 41,33 | 21 | 33,33 | ||||
| 2025-08-13 | 13F | Cary Street Partners Financial Llc | 3.327 | 0,00 | 218 | -6,84 | ||||
| 2025-08-08 | 13F | Cetera Investment Advisers | 13.220 | 12,85 | 866 | 4,84 | ||||
| 2025-08-14 | 13F | Guardian Wealth Advisors, Llc / Nc | 87 | 1,16 | 6 | -16,67 | ||||
| 2025-07-23 | 13F | Massachusetts Wealth Management | 15.720 | 2,11 | 1.030 | -5,16 | ||||
| 2025-07-29 | 13F | Harbor Asset Planning, Inc. | 412 | 27 | ||||||
| 2025-08-08 | 13F | Islay Capital Management, Llc | 630 | 0,00 | 41 | -6,82 | ||||
| 2025-08-14 | 13F | Warren Averett Asset Management, LLC | 3.910 | 0,00 | 256 | -6,91 | ||||
| 2025-08-15 | 13F | Equitable Holdings, Inc. | 0 | -100,00 | 0 | |||||
| 2025-07-18 | 13F | Union Bancaire Privee, UBP SA | 660 | 0,00 | 37 | -12,20 | ||||
| 2025-08-14 | 13F | Murphy & Mullick Capital Management Corp | 0 | -100,00 | 0 | |||||
| 2025-07-17 | 13F | Raleigh Capital Management Inc. | 1 | 0,00 | 0 | |||||
| 2025-07-22 | 13F | Wealthcare Advisory Partners LLC | 4.898 | 4,28 | 321 | -3,02 | ||||
| 2025-08-14 | 13F | Wiley Bros.-aintree Capital, Llc | 0 | -100,00 | 0 | |||||
| 2025-05-15 | 13F | D. E. Shaw & Co., Inc. | 0 | -100,00 | 0 | |||||
| 2025-08-13 | 13F | Raab & Moskowitz Asset Management LLC | 4.693 | -2,29 | 308 | -9,17 | ||||
| 2025-08-04 | 13F | Spire Wealth Management | 4.055 | -11,17 | 266 | -17,70 | ||||
| 2025-07-25 | 13F | Cwm, Llc | 264 | -19,27 | 0 | |||||
| 2025-05-09 | 13F | Commonwealth Retirement Investments LLC | 0 | -100,00 | 0 | |||||
| 2025-08-12 | 13F | Wayfinding Financial, LLC | 0 | -100,00 | 0 | |||||
| 2025-07-31 | 13F | Guardian Asset Advisors, LLC | 0 | -100,00 | 0 | |||||
| 2025-08-11 | 13F | Rothschild Investment Llc | 390 | 0,00 | 26 | -7,41 | ||||
| 2025-08-11 | 13F | HighTower Advisors, LLC | 14.066 | 5,15 | 922 | -2,33 | ||||
| 2025-08-14 | 13F | Mariner, LLC | 26.469 | -2,98 | 1.735 | -9,92 | ||||
| 2025-04-21 | 13F | Ronald Blue Trust, Inc. | 0 | -100,00 | 0 | |||||
| 2025-05-09 | 13F | Scotia Capital Inc. | 0 | -100,00 | 0 | |||||
| 2025-07-31 | 13F | Boothe Investment Group, Inc. | 9.189 | 602 | ||||||
| 2025-07-28 | 13F | Patten & Patten Inc/tn | 26.383 | -1,01 | 1.729 | -8,03 | ||||
| 2025-08-13 | 13F | Northwestern Mutual Wealth Management Co | 1.899 | -15,30 | 124 | -21,52 | ||||
| 2025-08-12 | 13F | Global Retirement Partners, LLC | 293 | -2,66 | 19 | 0,00 | ||||
| 2025-08-26 | 13F/A | Thrivent Financial For Lutherans | 37.636 | 4,73 | 2 | 0,00 | ||||
| 2025-07-22 | 13F | Grimes & Company, Inc. | 22.396 | 1.468 | ||||||
| 2025-07-16 | 13F/A | CX Institutional | 29 | -30,95 | 0 | |||||
| 2025-08-08 | 13F | Pnc Financial Services Group, Inc. | 1.281 | 0,00 | 84 | -7,78 | ||||
| 2025-08-11 | 13F | Principal Securities, Inc. | 324 | -85,64 | 21 | -85,81 | ||||
| 2025-07-10 | 13F | Piscataqua Savings Bank | 498 | 0,00 | 33 | -8,57 | ||||
| 2025-04-23 | 13F | Sabal Trust CO | 0 | -100,00 | 0 | |||||
| 2025-08-11 | 13F | HHM Wealth Advisors, LLC | 450 | 0,00 | 29 | -6,45 | ||||
| 2025-08-06 | 13F | Hallmark Capital Management Inc | 900 | 0,00 | 59 | -7,94 | ||||
| 2025-08-14 | 13F | Wells Fargo & Company/mn | 44.470 | -31,61 | 2.915 | -36,49 | ||||
| 2025-08-19 | 13F | Advisory Services Network, LLC | 4.178 | -2,75 | 275 | -9,57 | ||||
| 2025-05-14 | 13F | CIBC World Markets Inc. | 0 | -100,00 | 0 | |||||
| 2025-08-25 | NP | YLDE - ClearBridge Dividend Strategy ESG ETF This fund is a listed as child fund of Clearbridge, Llc and if that institution has disclosed ownership in this security, then these positions will not be double counted when calculating total shares and total value | 0 | -100,00 | 0 | -100,00 | ||||
| 2025-07-18 | 13F | Institute for Wealth Management, LLC. | 11.198 | -0,75 | 734 | -7,91 | ||||
| 2025-08-15 | 13F | Captrust Financial Advisors | 4.810 | -5,39 | 315 | -12,01 | ||||
| 2025-07-18 | 13F | Bartlett & Co. Wealth Management Llc | 90 | 0,00 | 6 | -16,67 | ||||
| 2025-07-15 | 13F | Mather Group, Llc. | 0 | -100,00 | 0 | |||||
| 2025-07-17 | 13F | Janney Montgomery Scott LLC | 6.829 | -5,82 | 0 | |||||
| 2025-08-14 | 13F | Royal Bank Of Canada | 116.187 | 13,93 | 7.615 | 5,81 | ||||
| 2025-08-05 | 13F | Simplex Trading, Llc | 24 | 0 | ||||||
| 2025-08-12 | 13F | Running Point Capital Advisors, LLC | 135 | 0,00 | 9 | -11,11 | ||||
| 2025-07-24 | 13F | Us Bancorp \de\ | 384 | 0,00 | 25 | -7,41 | ||||
| 2025-08-12 | 13F | O'shaughnessy Asset Management, Llc | 199 | -3,40 | 13 | -7,14 | ||||
| 2025-07-25 | 13F | SPC Financial, Inc. | 3.090 | 0,00 | 203 | -7,34 | ||||
| 2025-07-10 | 13F | Wealth Enhancement Advisory Services, Llc | 3.967 | 264 | ||||||
| 2025-08-18 | 13F/A | National Bank Of Canada /fi/ | 410 | 0,00 | 27 | -7,14 | ||||
| 2025-07-11 | 13F | Matthew Goff Investment Advisor, LLC | 3.615 | 0,00 | 237 | -7,45 | ||||
| 2025-07-22 | 13F | Woodmont Investment Counsel Llc | 5.574 | 0,00 | 365 | -7,12 | ||||
| 2025-08-12 | 13F | Proequities, Inc. | 0 | 0 | ||||||
| 2025-08-07 | 13F | Allworth Financial LP | 1.538 | 7,55 | 101 | 6,38 | ||||
| 2025-08-12 | 13F | Asset Management Group, Inc. | 12.769 | 0,48 | 837 | -6,70 | ||||
| 2025-08-14 | 13F | Federation des caisses Desjardins du Quebec | 4.375 | 4,79 | 287 | -2,72 | ||||
| 2025-07-22 | 13F | Coastal Investment Advisors, Inc. | 900 | 0,00 | 59 | -7,94 | ||||
| 2025-08-14 | 13F | CoreCap Advisors, LLC | 100 | 7 | ||||||
| 2025-08-04 | 13F | Creative Financial Designs Inc /adv | 262 | 0,38 | 17 | -5,56 | ||||
| 2025-08-06 | 13F | Commonwealth Equity Services, Llc | 32.565 | -11,61 | 2 | 0,00 | ||||
| 2025-08-18 | 13F | N.E.W. Advisory Services LLC | 0 | -100,00 | 0 | |||||
| 2025-07-31 | 13F | Oak Harbor Wealth Partners, Llc | 210 | 0,00 | 14 | -7,14 | ||||
| 2025-07-23 | NP | FAAAX - Franklin K2 Alternative Strategies Fund Class A | Short | -53.060 | 32,06 | -3.454 | 18,29 | |||
| 2025-05-15 | 13F | Bank Of America Corp /de/ | Call | 0 | -100,00 | 0 | -100,00 | |||
| 2025-07-18 | 13F | Truist Financial Corp | 9.104 | 2,85 | 593 | -5,13 | ||||
| 2025-08-14 | 13F | Strive Asset Management, LLC | 0 | -100,00 | 0 | |||||
| 2025-08-12 | 13F | Franklin Resources Inc | 198 | 0,00 | 13 | -7,69 | ||||
| 2025-04-08 | 13F | Welch Group, LLC | 0 | -100,00 | 0 | |||||
| 2025-04-14 | 13F | Pallas Capital Advisors LLC | 0 | -100,00 | 0 | |||||
| 2025-08-14 | 13F | Aft, Forsyth & Company, Inc. | 3.440 | 0,29 | 225 | -7,02 | ||||
| 2025-08-14 | 13F | Susquehanna International Group, Llp | 42.566 | -11,47 | 2.790 | -17,78 | ||||
| 2025-08-05 | 13F | Huntington National Bank | 14 | -6,67 | ||||||
| 2025-08-15 | 13F | Northeast Financial Consultants Inc | 4.140 | 0,00 | 271 | -7,19 | ||||
| 2025-07-21 | 13F | Ameritas Advisory Services, LLC | 2.574 | 169 | ||||||
| 2025-08-13 | 13F | Twin Peaks Wealth Advisors, LLC | 84 | 6 | ||||||
| 2025-07-08 | 13F | Parallel Advisors, LLC | 0 | -100,00 | 0 | |||||
| 2025-08-13 | 13F | Continuum Advisory, LLC | 0 | -100,00 | 0 | |||||
| 2025-08-12 | 13F | YANKCOM Partnership | 81 | 0,00 | 5 | 0,00 | ||||
| 2025-04-14 | 13F | Farther Finance Advisors, LLC | 0 | -100,00 | 0 | |||||
| 2025-07-22 | 13F | Merit Financial Group, LLC | 31.323 | 0,42 | 2.053 | -6,73 | ||||
| 2025-08-13 | 13F | Beacon Pointe Advisors, LLC | 19.985 | 0,50 | 1.310 | -6,70 | ||||
| 2025-07-16 | 13F | Brown, Lisle/cummings, Inc. | 2.376 | 5,74 | 156 | -1,90 | ||||
| 2025-07-29 | 13F | Kraft, Davis & Associates, LLC | 0 | -100,00 | 0 | |||||
| 2025-08-12 | 13F | Fairscale Capital, LLC | 303 | 20 | ||||||
| 2025-07-17 | 13F/A | Capital Investment Advisors, LLC | 7.124 | 28,68 | 467 | 19,49 | ||||
| 2025-08-18 | 13F | Geneos Wealth Management Inc. | 798 | 0,00 | 52 | -7,14 | ||||
| 2025-08-13 | 13F | Fisher Asset Management, LLC | 2.976.691 | -5,29 | 195.092 | -12,03 | ||||
| 2025-08-14 | 13F | Bnp Paribas Arbitrage, Sa | 200.000 | 13.108 | ||||||
| 2025-08-12 | 13F | MAI Capital Management | 860 | 0,12 | 56 | -6,67 | ||||
| 2025-08-13 | 13F | Capital Analysts, Inc. | 932 | 0,00 | 0 | |||||
| 2025-07-03 | 13F | Garde Capital, Inc. | 0 | -100,00 | 0 | |||||
| 2025-08-14 | 13F | Fmr Llc | 11.897 | -1,70 | 780 | -8,68 | ||||
| 2025-08-07 | 13F | Runnymede Capital Advisors, Inc. | 0 | -100,00 | 0 | |||||
| 2025-07-23 | 13F | Kingswood Wealth Advisors, Llc | 3.100 | 203 | ||||||
| 2025-07-18 | 13F | SOA Wealth Advisors, LLC. | 84 | 0,00 | 6 | 0,00 | ||||
| 2025-08-14 | 13F | Comerica Bank | 2.122 | -10,08 | 139 | -16,27 | ||||
| 2025-07-22 | 13F | Apexium Financial, Lp | 3.484 | 0,20 | 228 | -6,94 | ||||
| 2025-05-14 | 13F | REAP Financial Group, LLC | 0 | -100,00 | 0 | |||||
| 2025-08-14 | 13F | Two Sigma Securities, Llc | 0 | -100,00 | 0 | |||||
| 2025-08-14 | 13F | Ameriprise Financial Inc | 23.658 | 491,89 | 1.550 | 449,29 | ||||
| 2025-07-15 | 13F | Fifth Third Bancorp | 1.167 | -7,45 | 76 | -13,64 | ||||
| 2025-08-15 | 13F | Tower Research Capital LLC (TRC) | 18.116 | 25,91 | 1.187 | 16,95 | ||||
| 2025-07-28 | 13F | Harbour Investments, Inc. | 499 | 13,93 | 33 | 6,67 | ||||
| 2025-08-14 | 13F | Citadel Advisors Llc | 38.321 | 71,08 | 2.512 | 58,92 | ||||
| 2025-08-14 | 13F | BTG Pactual Asset Management US LLC | 87 | 0,00 | 6 | -16,67 | ||||
| 2025-08-06 | 13F | AE Wealth Management LLC | 156 | 67,74 | 10 | 66,67 | ||||
| 2025-08-01 | 13F | First Command Advisory Services, Inc. | 54 | 0,00 | 4 | 0,00 | ||||
| 2025-07-02 | 13F | First Financial Bank - Trust Division | 6.396 | 0,00 | 419 | -7,10 | ||||
| 2025-08-14 | 13F | UBS Group AG | 41.406 | 12,93 | 2.714 | 4,87 | ||||
| 2025-08-27 | NP | FFOX - FundX Future Fund Opportunities ETF | 135 | 9 | ||||||
| 2025-04-28 | 13F | Strategic Financial Concepts, LLC | 0 | -100,00 | 0 | -100,00 | ||||
| 2025-07-18 | 13F | Trust Co Of Vermont | 609 | 0,00 | 40 | -7,14 | ||||
| 2025-08-11 | 13F | Aptus Capital Advisors, LLC | 87 | 1,16 | 6 | -16,67 | ||||
| 2025-08-14 | 13F | Mml Investors Services, Llc | 4.615 | 40,40 | 0 | |||||
| 2025-07-29 | 13F | Stratos Wealth Advisors, LLC | 0 | -100,00 | 0 | |||||
| 2025-08-05 | 13F | EPG Wealth Management LLC | 106 | 0,95 | 7 | -14,29 | ||||
| 2025-05-14 | 13F | Orion Portfolio Solutions, LLC | 10.465 | 0,00 | 688 | 0,00 | ||||
| 2025-08-01 | 13F | Brinker Capital Investments, LLC | 0 | -100,00 | 0 | -100,00 | ||||
| 2025-08-14 | 13F | Qube Research & Technologies Ltd | 0 | -100,00 | 0 | |||||
| 2025-07-14 | 13F | Farmers & Merchants Investments Inc | 150 | 0,00 | 10 | -10,00 | ||||
| 2025-08-08 | 13F | Gts Securities Llc | 0 | -100,00 | 0 | |||||
| 2025-07-11 | 13F | Essex Savings Bank | 3.300 | 0,00 | 216 | -6,90 | ||||
| 2025-07-30 | 13F | Cookson Peirce & Co Inc | 0 | -100,00 | 0 |