Grundlæggende statistik
| Institutionelle ejere | 172 total, 172 long only, 0 short only, 0 long/short - change of -10,42% MRQ |
| Gennemsnitlig porteføljeallokering | 0.1113 % - change of -32,05% MRQ |
| Institutionelle aktier (lange) | 5.869.964 (ex 13D/G) - change of -0,64MM shares -9,79% MRQ |
| Institutionel værdi (lang) | $ 276.433 USD ($1000) |
Institutionelt ejerskab og aktionærer
iShares Trust - iShares Cybersecurity and Tech ETF (US:IHAK) har 172 institutionelle ejere og aktionærer, der har indsendt 13D/G- eller 13F-formularer til Securities Exchange Commission (SEC). Disse institutioner har i alt 5,869,964 aktier. Største aktionærer omfatter Bank Of America Corp /de/, Morgan Stanley, LPL Financial LLC, Wharton Business Group, LLC, UBS Group AG, Scotia Capital Inc., Royal Bank Of Canada, Sava Penzisko Drushtvo A.d. Skopje, Advisor Group Holdings, Inc., and Ameriprise Financial Inc .
iShares Trust - iShares Cybersecurity and Tech ETF (ARCA:IHAK) institutionel ejerskabsstruktur viser aktuelle positioner i virksomheden efter institutioner og fonde, samt seneste ændringer i positionsstørrelse. Større aktionærer kan omfatte individuelle investorer, investeringsforeninger, hedgefonde eller institutioner. Skema 13D angiver, at investoren besidder (eller besidder) mere end 5 % af virksomheden og har til hensigt (eller har til hensigt at) aktivt at forfølge en ændring i forretningsstrategi. Skema 13G indikerer en passiv investering på over 5%.
The share price as of April 24, 2026 is 46,68 / share. Previously, on April 28, 2025, the share price was 48,73 / share. This represents a decline of 4,21% over that period.

Fondens stemningsscore
Fund Sentiment Score (fka Ownership Accumulation Score) finder de aktier, der bliver mest købt af fonde. Det er resultatet af en sofistikeret, multi-faktor kvantitativ model, der identificerer virksomheder med de højeste niveauer af institutionel akkumulering. Scoringsmodellen bruger en kombination af den samlede stigning i oplyste ejere, ændringerne i porteføljeallokeringer i disse ejere og andre målinger. Tallet går fra 0 til 100, hvor højere tal indikerer et højere niveau af akkumulering for sine jævnaldrende, og 50 er gennemsnittet.
Opdateringsfrekvens: Dagligt
Se Ownership Explorer, som giver en liste over højest rangerende virksomheder.
AI+ Ask Fintel’s AI assistant about iShares Trust - iShares Cybersecurity and Tech ETF.
Select a question to share a public post with an AI-crafted answer.
Thinking of good questions…
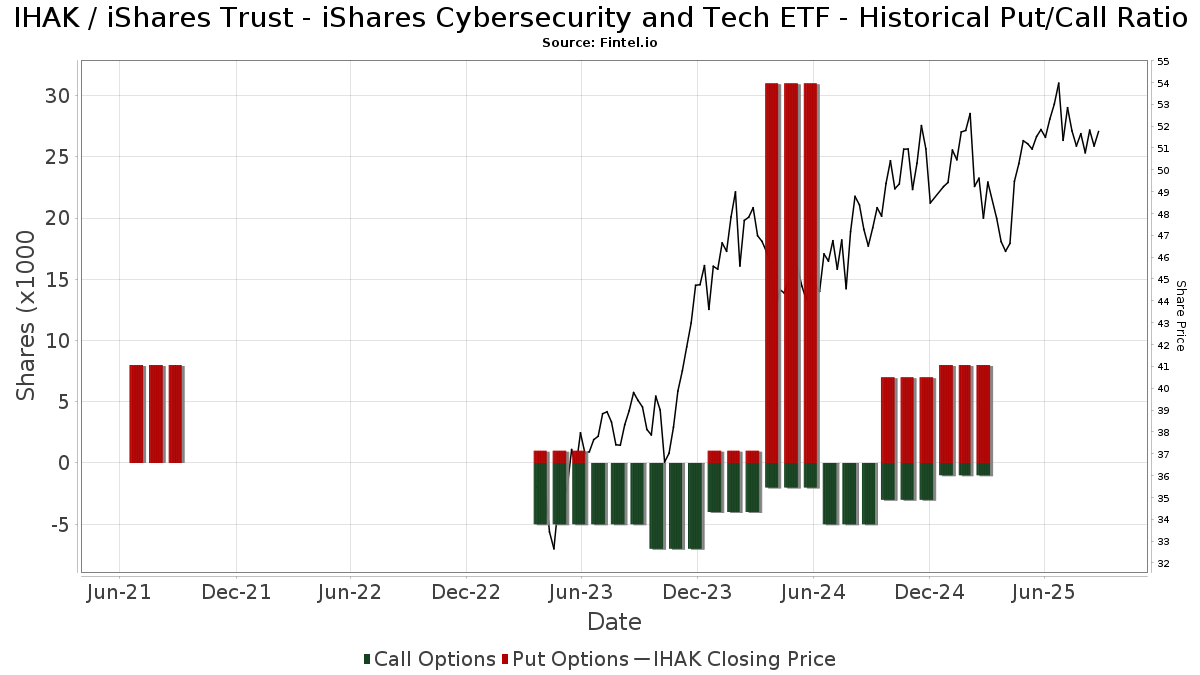
Institutionel Put/Call-forhold
Ud over at indberette standardaktie- og gældsudstedelser skal institutter med mere end 100 mill. aktiver under forvaltning også oplyse deres put- og call-optionsbeholdninger. Da salgsoptioner generelt indikerer negativ stemning, og købsoptioner indikerer positiv stemning, kan vi få en fornemmelse af den overordnede institutionelle stemning ved at plotte forholdet mellem put og kald. Diagrammet til højre viser det historiske put/call-forhold for dette instrument.
Brug af Put/Call Ratio som en indikator for investorernes stemning overvinder en af de vigtigste mangler ved at bruge totalt institutionelt ejerskab, som er, at en betydelig mængde af aktiver under forvaltning investeres passivt for at spore indekser. Passivt forvaltede fonde køber typisk ikke optioner, så indikatoren for put/call-forholdet følger mere nøje følelsen af aktivt forvaltede fonde.
13F og NPORT arkivering
Detaljer om 13F-arkivering er gratis. Detaljer om NP-ansøgninger kræver et premium-medlemskab. Grønne rækker angiver nye positioner. Røde rækker angiver lukkede positioner. Klik på linket ikon for at se den fulde transaktionshistorik.
Opgrader
for at låse premium-data op og eksportere til Excel ![]() .
.
| Fil dato | Kilde | Investor | Type | Gennemsnitlig pris (Øst) |
Aktier | Δ Aktier (%) |
Rapporteret Værdi ($1000) |
Δ Værdi (%) |
Port Alloc (%) |
|
|---|---|---|---|---|---|---|---|---|---|---|
| 2026-04-22 | 13F | Janney Montgomery Scott LLC | 47.739 | 2 | ||||||
| 2026-02-12 | 13F | Groupe la Francaise | 0 | -100,00 | 0 | |||||
| 2025-11-24 | 13F | TD Capital Management LLC | 0 | -100,00 | 0 | |||||
| 2026-04-24 | 13F | Oakworth Capital, Inc. | 35 | 0,00 | 2 | 0,00 | ||||
| 2026-04-10 | 13F | Centurion Wealth Management LLC | 11.792 | -88,33 | 515 | -89,43 | ||||
| 2026-02-06 | 13F | Pnc Financial Services Group, Inc. | 855 | -35,91 | 41 | -40,58 | ||||
| 2026-02-04 | 13F | Ameritas Advisory Services, LLC | 0 | -100,00 | 0 | |||||
| 2026-01-27 | 13F | TD Waterhouse Canada Inc. | 85 | 0,00 | 4 | 0,00 | ||||
| 2026-01-21 | 13F | Signature Resources Capital Management, LLC | 368 | -5,40 | 18 | -15,00 | ||||
| 2026-02-12 | 13F | Scotia Capital Inc. | 165.997 | 8,12 | 7.988 | -0,59 | ||||
| 2026-02-13 | 13F | Centaurus Financial, Inc. | 8.617 | 5,24 | 0 | |||||
| 2026-02-05 | 13F | Western Wealth Management, LLC | 5.411 | 260 | ||||||
| 2025-11-12 | 13F | Simplex Trading, Llc | 0 | -100,00 | 0 | |||||
| 2026-04-14 | 13F | Nbc Securities, Inc. | 309 | -48,24 | 13 | -53,57 | ||||
| 2025-11-12 | 13F | Creative Financial Designs Inc /adv | 0 | -100,00 | 0 | -100,00 | ||||
| 2025-11-12 | 13F | Us Bancorp \de\ | 0 | -100,00 | 0 | |||||
| 2026-02-12 | 13F | Bank Of Montreal /can/ | 50.303 | 9,37 | 2.421 | 0,58 | ||||
| 2026-02-11 | 13F | Wharton Business Group, LLC | 306.385 | -1,71 | 14.743 | -9,61 | ||||
| 2026-01-23 | 13F | TFC Financial Management | 0 | -100,00 | 0 | |||||
| 2026-02-13 | 13F | Mml Investors Services, Llc | 15.315 | -23,78 | 737 | -29,97 | ||||
| 2026-02-10 | 13F | Goldman Sachs Group Inc | 39.719 | -14,24 | 1.911 | -21,13 | ||||
| 2026-02-02 | 13F | Ellis Investment Partners, LLC | 14.949 | 0,04 | 719 | -8,06 | ||||
| 2026-01-21 | 13F | Y.D. More Investments Ltd | 2.245 | 0,00 | 108 | -7,69 | ||||
| 2026-02-12 | 13F | Commonwealth Equity Services, Llc | 54.683 | -5,68 | 2.631 | 87.600,00 | ||||
| 2026-02-13 | 13F | Minot DeBlois Advisors LLC | 115 | 0,00 | 6 | -16,67 | ||||
| 2026-02-06 | 13F | Portland Financial Advisors Inc | 6.105 | 0,00 | 294 | -8,15 | ||||
| 2026-02-13 | 13F | Visionary Wealth Advisors | 12.624 | -1,83 | 607 | -9,67 | ||||
| 2026-01-23 | 13F | Dara Capital Us, Inc. | 17.115 | 824 | ||||||
| 2026-02-06 | 13F | Cullen/frost Bankers, Inc. | 1.233 | 59 | ||||||
| 2026-02-17 | 13F | Fmr Llc | 4.097 | -4,07 | 197 | -11,66 | ||||
| 2026-04-07 | 13F | Signaturefd, Llc | 85 | 4 | ||||||
| 2026-02-17 | 13F | Cetera Investment Advisers | 55.535 | -0,65 | 2.672 | -8,65 | ||||
| 2026-02-13 | 13F | Ubs Asset Management Americas Inc | 1.726 | 83 | ||||||
| 2026-04-22 | 13F | Clear Creek Financial Management, LLC | 0 | -100,00 | 0 | |||||
| 2026-01-20 | 13F | SOA Wealth Advisors, LLC. | 125 | 0,00 | 6 | 0,00 | ||||
| 2026-02-13 | 13F | Stifel Financial Corp | 52.074 | -0,10 | 2.506 | -8,14 | ||||
| 2026-04-23 | 13F | Intrua Financial, LLC | 18.405 | -10,30 | 803 | -18,64 | ||||
| 2026-02-12 | 13F | Federation des caisses Desjardins du Quebec | 3.438 | 0,00 | 165 | -7,82 | ||||
| 2026-04-20 | 13F | Sowell Financial Services LLC | 4.859 | 2,66 | 212 | -6,61 | ||||
| 2026-02-17 | 13F | D. E. Shaw & Co., Inc. | 19.146 | 921 | ||||||
| 2026-02-13 | 13F | National Bank Of Canada /fi/ | 0 | -100,00 | 0 | |||||
| 2026-01-29 | 13F | Comerica Bank | 156 | -98,50 | 8 | -98,71 | ||||
| 2026-02-13 | 13F | Centerpoint Advisors, LLC | 100 | 0,00 | 0 | |||||
| 2026-02-05 | 13F | Plante Moran Financial Advisors, LLC | 315 | 15 | ||||||
| 2026-02-12 | 13F | Principal Securities, Inc. | 5.666 | 0,00 | 273 | -8,11 | ||||
| 2025-11-13 | 13F | Riggs Asset Managment Co. Inc. | 0 | -100,00 | 0 | |||||
| 2026-02-10 | 13F | WCG Wealth Advisors LLC | 19.462 | 5,42 | 937 | -3,11 | ||||
| 2026-01-28 | 13F | Mowery & Schoenfeld Wealth Management, LLC | 109 | 0,00 | 5 | 0,00 | ||||
| 2026-02-13 | 13F | Integrated Wealth Concepts LLC | 0 | -100,00 | 0 | |||||
| 2026-02-23 | 13F | Monetary Solutions, Ltd | 250 | 12 | ||||||
| 2026-02-09 | 13F | Smithfield Trust Co | 485 | 0,00 | 0 | |||||
| 2025-11-14 | 13F | PineBridge Investments, L.P. | 20.669 | 14,07 | 1.082 | 12,14 | ||||
| 2026-04-20 | 13F | SILVER OAK SECURITIES, Inc | 8.953 | 7,80 | 391 | -3,23 | ||||
| 2026-02-13 | 13F | Barclays Plc | 0 | -100,00 | 0 | |||||
| 2025-12-31 | 13F | Pvg Asset Management Corp | 0 | -100,00 | 0 | |||||
| 2026-02-13 | 13F | Kayne Anderson Rudnick Investment Management Llc | 600 | 29 | ||||||
| 2026-02-17 | 13F | Private Advisor Group, LLC | 4.929 | 237 | ||||||
| 2026-02-02 | 13F | Truist Financial Corp | 15.445 | 4,14 | 743 | -4,25 | ||||
| 2026-02-05 | 13F | AlphaCore Capital LLC | 1.775 | 85 | ||||||
| 2026-01-16 | 13F | Ronald Blue Trust, Inc. | 0 | -100,00 | 0 | |||||
| 2026-02-05 | 13F | Thrivent Financial For Lutherans | 0 | -100,00 | 0 | |||||
| 2025-11-13 | 13F | Brentview Investment Management LLC | 0 | -100,00 | 0 | -100,00 | ||||
| 2026-02-10 | 13F | Crescent Grove Advisors, LLC | 34.290 | 2,94 | 1.650 | -5,34 | ||||
| 2026-02-02 | 13F | Retirement Planning Group, Llc / Ny | 0 | -100,00 | 0 | |||||
| 2026-01-26 | 13F | PFG Investments, LLC | 4.171 | 7,78 | 201 | -0,99 | ||||
| 2026-04-23 | 13F | Kohmann Bosshard Financial Services, LLC | 242 | 0,00 | 11 | -9,09 | ||||
| 2026-02-17 | 13F | Bank Of America Corp /de/ | 1.811.495 | -1,92 | 87.169 | -9,81 | ||||
| 2026-02-26 | 13F | Anchor Investment Management, LLC | 2.141 | 16,93 | 103 | 8,42 | ||||
| 2026-02-11 | 13F | Franklin Resources Inc | 0 | -100,00 | 0 | |||||
| 2026-02-17 | 13F | Advisory Services Network, LLC | 0 | -100,00 | 0 | |||||
| 2026-02-12 | 13F | Jane Street Group, Llc | 88.948 | 268,88 | 4.280 | 239,41 | ||||
| 2026-02-17 | 13F | BTG Pactual Asset Management US LLC | 0 | -100,00 | 0 | |||||
| 2026-02-05 | 13F | Pacific Sun Financial Corp | 9.617 | 55,34 | 463 | 43,03 | ||||
| 2026-02-18 | 13F | Beacon Pointe Advisors, LLC | 0 | -100,00 | 0 | |||||
| 2026-02-10 | 13F | Nelson Capital Management, LLC | 94.266 | 1,55 | 4.536 | -6,61 | ||||
| 2026-04-24 | 13F | Flagship Private Wealth, LLC | 0 | -100,00 | 0 | |||||
| 2026-01-21 | 13F | Flagship Harbor Advisors, Llc | 245 | 12 | ||||||
| 2026-02-12 | 13F | Gould Capital, LLC | 129 | 18,35 | 6 | 20,00 | ||||
| 2026-02-20 | 13F | Sunbelt Securities, Inc. | 2.643 | -26,01 | 127 | -31,72 | ||||
| 2026-02-17 | 13F | Creative Planning | 15.120 | -15,06 | 728 | -21,91 | ||||
| 2026-01-21 | 13F | Sound Income Strategies, LLC | 1.099 | 54 | ||||||
| 2026-04-22 | 13F | Spire Wealth Management | 13.571 | -62,70 | 592 | -66,17 | ||||
| 2026-02-13 | 13F | J. Mark Nickell & Co. | 4.775 | 230 | ||||||
| 2025-10-29 | 13F | Sugar Maple Asset Management, LLC | 0 | -100,00 | 0 | |||||
| 2026-04-17 | 13F | Krilogy Financial LLC | 17.864 | -9,41 | 826 | -14,15 | ||||
| 2026-02-17 | 13F | Valley Financial Group, Inc. | 0 | -100,00 | 0 | |||||
| 2026-02-10 | 13F | Envestnet Asset Management Inc | 8.662 | -24,00 | 417 | -30,20 | ||||
| 2026-04-13 | 13F | IFP Advisors, Inc | 1.978 | 2,12 | 86 | -7,53 | ||||
| 2026-02-03 | 13F | Detalus Advisors, LLC | 0 | -100,00 | 0 | |||||
| 2026-04-08 | 13F | Wealth Enhancement Advisory Services, Llc | 0 | -100,00 | 0 | |||||
| 2026-02-05 | 13F | Atria Investments Llc | 29.048 | 1,46 | 1.398 | -6,74 | ||||
| 2026-02-11 | 13F | Mascagni Wealth Management, Inc. | 4.813 | -0,76 | 232 | -8,70 | ||||
| 2026-04-17 | 13F | Cora Capital Advisors Llc | 0 | -100,00 | 0 | |||||
| 2026-02-17 | 13F | Opus Financial Solutions LLC | 4.218 | 203 | ||||||
| 2026-04-08 | 13F | First Heartland Consultants, Inc. | 0 | -100,00 | 0 | |||||
| 2026-02-12 | 13F | CIBC Private Wealth Group, LLC | 0 | -100,00 | 0 | |||||
| 2025-11-21 | 13F | Watts Gwilliam & Co., LLC | 43.431 | 0,00 | 2.273 | -1,65 | ||||
| 2026-01-22 | 13F | Evermay Wealth Management Llc | 300 | 0,00 | 14 | -6,67 | ||||
| 2026-01-13 | 13F | Mather Group, Llc. | 0 | -100,00 | 0 | |||||
| 2026-02-17 | 13F | Banco Bilbao Vizcaya Argentaria, S.a. | 10.000 | 486 | ||||||
| 2026-02-17 | 13F | Advisor Group Holdings, Inc. | 112.603 | -28,12 | 5.419 | -33,98 | ||||
| 2026-02-05 | 13F | Cambridge Investment Research Advisors, Inc. | 23.010 | -25,32 | 1 | 0,00 | ||||
| 2026-01-21 | 13F | Capital Investment Advisory Services, LLC | 200 | 0,00 | 10 | -10,00 | ||||
| 2026-02-18 | 13F | GWM Advisors LLC | 0 | -100,00 | 0 | |||||
| 2026-04-15 | 13F | Activest Wealth Management | 1.307 | 0,00 | 57 | -8,06 | ||||
| 2026-02-13 | 13F | Gen-Wealth Partners Inc | 0 | -100,00 | 0 | |||||
| 2026-02-13 | 13F | 10Elms LLP | 3.200 | 0,00 | 154 | -8,38 | ||||
| 2026-02-10 | 13F | Bnp Paribas | 11.356 | 1,44 | 546 | -6,67 | ||||
| 2026-01-26 | 13F | Private Trust Co Na | 389 | 0,00 | 19 | -10,00 | ||||
| 2026-04-15 | 13F | Purus Wealth Management, LLC | 6.021 | -4,96 | 263 | -13,82 | ||||
| 2026-01-30 | 13F | Urban Wealth Management, LLC | 0 | -100,00 | 0 | -100,00 | ||||
| 2026-02-17 | 13F | Old Mission Capital Llc | 5.988 | -79,33 | 288 | -81,00 | ||||
| 2026-01-12 | 13F | Perkins Coie Trust Co | 0 | -100,00 | 0 | |||||
| 2026-02-17 | 13F/A | Kovack Advisors, Inc. | 12.595 | 606 | ||||||
| 2026-02-09 | 13F | Hartland & Co., LLC | 1.137 | 0,00 | 55 | -8,47 | ||||
| 2026-02-10 | 13F | Pecaut & Co. | 4.581 | 0,02 | 220 | -7,95 | ||||
| 2026-02-17 | 13F | Jones Financial Companies Lllp | 84.135 | 12,20 | 4.049 | 2,82 | ||||
| 2026-04-16 | 13F | Capital Advisors, Ltd. LLC | 7.724 | 32.083,33 | 0 | |||||
| 2026-02-17 | 13F | SageView Advisory Group, LLC | 100 | 5 | ||||||
| 2026-04-07 | 13F | Bulwark Capital Corp | 4.085 | -57,76 | 178 | -61,72 | ||||
| 2026-04-14 | 13F | Wealthcare Advisory Partners LLC | 19.575 | -12,91 | 854 | -21,00 | ||||
| 2026-02-05 | 13F | Allworth Financial LP | 955 | -6,92 | 46 | -15,09 | ||||
| 2026-04-16 | 13F | Rainier Family Wealth Inc | 33.222 | 22,32 | 1.450 | 11,03 | ||||
| 2026-02-14 | 13F | POM Investment Strategies, LLC | 221 | 0,00 | 11 | -9,09 | ||||
| 2026-02-05 | 13F | Navalign, LLC | 387 | 19 | ||||||
| 2026-02-17 | 13F | Fountainhead AM, LLC | 0 | -100,00 | 0 | |||||
| 2026-01-29 | 13F | Koa Wealth Management, LLC | 0 | -100,00 | 0 | |||||
| 2026-01-20 | 13F | AdvisorNet Financial, Inc | 0 | -100,00 | 0 | |||||
| 2026-02-06 | 13F | Forum Private Client Group LLC | 4.505 | 0,02 | 217 | -8,09 | ||||
| 2026-04-22 | 13F | Networth Advisors, LLC | 153 | 0,00 | 7 | -14,29 | ||||
| 2025-10-28 | 13F | BostonPremier Wealth LLC | 0 | -100,00 | 0 | |||||
| 2026-01-21 | 13F | Future Financial Wealth Managment LLC | 0 | -100,00 | 0 | |||||
| 2026-02-17 | 13F | Qube Research & Technologies Ltd | 104 | -33,76 | 5 | -37,50 | ||||
| 2026-02-09 | 13F | Solutions 4 Wealth, Ltd | 21.709 | 0,06 | 1.045 | -8,02 | ||||
| 2026-02-12 | 13F | Triumph Capital Management | 2.305 | -4,04 | 111 | -12,00 | ||||
| 2026-01-21 | 13F | Petra Financial Advisors Inc | 27.577 | -2,26 | 1.327 | -10,09 | ||||
| 2026-01-22 | 13F | Bfsg, Llc | 237 | 0,00 | 11 | -8,33 | ||||
| 2026-02-11 | 13F | Parallel Advisors, LLC | 77 | 0,00 | 4 | -25,00 | ||||
| 2026-02-13 | 13F | Baird Financial Group, Inc. | 56.705 | 3,01 | 2.729 | -5,28 | ||||
| 2026-02-17 | 13F | Royal Bank Of Canada | 136.243 | 2,26 | 6.555 | -5,97 | ||||
| 2026-02-17 | 13F | Susquehanna International Group, Llp | 17.071 | 80,89 | 821 | 66,53 | ||||
| 2026-04-08 | 13F | Warner Financial, Inc | 5.255 | 12,99 | 229 | |||||
| 2026-02-17 | 13F | Ameriprise Financial Inc | 95.245 | -7,02 | 4.583 | -14,50 | ||||
| 2026-02-18 | 13F | Mackenzie Financial Corp | 5.570 | 0,00 | 270 | -7,22 | ||||
| 2026-04-22 | 13F | Coston, McIsaac & Partners | 539 | 0,00 | 0 | |||||
| 2026-04-10 | 13F | Waldron Private Wealth LLC | 10.245 | 0,00 | 447 | -9,15 | ||||
| 2026-02-13 | 13F | Flow Traders U.s. Llc | 14.739 | -51,15 | 1 | -100,00 | ||||
| 2026-01-26 | 13F | Key Capital Management, INC | 574 | 28 | ||||||
| 2026-01-21 | 13F | Raleigh Capital Management Inc. | 873 | 42 | ||||||
| 2026-04-17 | 13F | Roxbury Financial LLC | 2 | -99,89 | 0 | -100,00 | ||||
| 2026-02-11 | 13F | Jpmorgan Chase & Co | 883 | 5.786,67 | 42 | |||||
| 2026-02-13 | 13F | Mariner, LLC | 26.466 | -9,53 | 1.274 | -16,80 | ||||
| 2026-01-13 | 13F | Stonehage Fleming Financial Services Holdings Ltd | 15.000 | 0,00 | 722 | -8,04 | ||||
| 2026-02-12 | 13F | Titleist Asset Management, Llc | 13.570 | 4,55 | 653 | -3,98 | ||||
| 2026-03-13 | 13F/A | Pensionmark Financial Group, Llc | 5.539 | 0,36 | 267 | -7,64 | ||||
| 2026-01-28 | 13F | Geneos Wealth Management Inc. | 152 | 0,00 | 7 | 0,00 | ||||
| 2026-02-13 | 13F | MAI Capital Management | 671 | 75,65 | 32 | 68,42 | ||||
| 2026-02-13 | 13F | Kestra Advisory Services, LLC | 0 | -100,00 | 0 | |||||
| 2026-02-13 | 13F | Morgan Stanley | 394.121 | -5,52 | 18.965 | -13,12 | ||||
| 2026-01-28 | 13F | Chicago Partners Investment Group LLC | 14.476 | 0,00 | 703 | -8,12 | ||||
| 2026-02-09 | 13F | Harbour Investments, Inc. | 1.934 | -4,07 | 93 | -11,43 | ||||
| 2026-04-15 | 13F | City Holding Co | 1.000 | 0,00 | 44 | -10,42 | ||||
| 2026-02-06 | 13F | Csenge Advisory Group | 29.276 | 4,58 | 1.409 | -3,83 | ||||
| 2026-02-10 | 13F | Lido Advisors, LLC | 36.661 | 19,20 | 1.894 | 17,65 | ||||
| 2026-02-13 | 13F | 1 North Wealth Services Llc | 43.532 | 4,54 | 2.095 | -3,90 | ||||
| 2026-04-07 | 13F | CoreCap Advisors, LLC | 47 | 0,00 | 2 | 0,00 | ||||
| 2026-01-26 | 13F | Cwm, Llc | 12.015 | -5,15 | 1 | |||||
| 2025-11-14 | 13F | Mount Yale Investment Advisors, LLC | 0 | -100,00 | 0 | -100,00 | ||||
| 2026-01-26 | 13F | Moran Wealth Management, LLC | 0 | -100,00 | 0 | |||||
| 2026-02-06 | 13F | GPS Wealth Strategies Group, LLC | 0 | -100,00 | 0 | |||||
| 2026-02-19 | 13F | CI Private Wealth, LLC | 26.214 | 0,00 | 1.261 | -8,02 | ||||
| 2026-02-13 | 13F | Retirement Capital Strategies | 6.015 | 0,00 | 289 | -7,96 | ||||
| 2026-02-12 | 13F | Providence Capital Advisors, LLC | 0 | -100,00 | 0 | |||||
| 2026-02-12 | 13F | Brown Brothers Harriman & Co | 150 | 0,00 | 7 | 0,00 | ||||
| 2025-11-13 | 13F | Financial Freedom, LLC | 0 | -100,00 | 0 | |||||
| 2026-02-13 | 13F | Wells Fargo & Company/mn | 1.425 | 211,14 | 69 | 195,65 | ||||
| 2026-01-27 | 13F | Penobscot Investment Management Company, Inc. | 9.348 | 0,00 | 450 | -8,18 | ||||
| 2026-02-05 | 13F | Crosspoint Financial, Llc | 50.783 | -0,24 | 2.444 | -8,26 | ||||
| 2026-02-11 | 13F | LPL Financial LLC | 330.584 | -2,76 | 15.908 | -10,58 | ||||
| 2026-04-20 | 13F | City State Bank | 7.849 | 0,00 | 343 | -9,28 | ||||
| 2026-02-06 | 13F | Global Retirement Partners, LLC | 11.048 | 1,27 | 532 | -6,84 | ||||
| 2026-04-20 | 13F | Provenance Wealth Advisors, LLC | 342 | 0,00 | 15 | -12,50 | ||||
| 2026-02-11 | 13F | Gwn Securities Inc. | 0 | -100,00 | 0 | |||||
| 2026-02-04 | 13F | Mascoma Wealth Management LLC | 640 | -10,86 | 31 | -18,92 | ||||
| 2026-02-17 | 13F | Citadel Advisors Llc | 0 | -100,00 | 0 | |||||
| 2026-01-29 | 13F | Aprio Wealth Management, LLC | 53.381 | 2,26 | 2.569 | -5,97 | ||||
| 2026-04-09 | 13F | C2P Capital Advisory Group, LLC d.b.a. Prosperity Capital Advisors | 8.012 | -11,04 | 350 | -19,40 | ||||
| 2026-02-06 | 13F | Larson Financial Group LLC | 93 | 0,00 | 4 | 0,00 | ||||
| 2026-02-17 | 13F | NorthRock Partners, LLC | 47.293 | 28,48 | 2.276 | 18,12 | ||||
| 2026-04-20 | 13F | Naples Global Advisors, Llc | 16.005 | -4,19 | 699 | -13,08 | ||||
| 2026-01-23 | 13F | Assetmark, Inc | 17 | -39,29 | 1 | -100,00 | ||||
| 2026-02-13 | 13F | Parkside Financial Bank & Trust | 8 | 0,00 | 0 | |||||
| 2026-02-17 | 13F | Northern Trust Corp | 5.419 | 0,00 | 261 | -8,13 | ||||
| 2026-02-13 | 13F | Ieq Capital, Llc | 8.967 | 0,00 | 431 | -8,10 | ||||
| 2026-02-11 | 13F | O'shaughnessy Asset Management, Llc | 442 | 44.100,00 | 21 | |||||
| 2026-01-28 | 13F | Glassman Wealth Services | 22 | 0,00 | 1 | 0,00 | ||||
| 2026-02-17 | 13F | Stenahm Asset Managment Ltd | 20.378 | 17,83 | 981 | 8,29 | ||||
| 2026-04-21 | 13F | GHP Investment Advisors, Inc. | 131 | 0,00 | 6 | -16,67 | ||||
| 2025-10-28 | 13F | BRYN MAWR TRUST Co | 150 | 0,00 | 8 | 0,00 | ||||
| 2026-02-04 | 13F | Valeo Financial Advisors, LLC | 0 | -100,00 | 0 | |||||
| 2026-02-10 | 13F | Rational Advisors Llc | 4.563 | -63,90 | 220 | -66,87 | ||||
| 2026-04-23 | 13F | North Star Investment Management Corp. | 0 | -100,00 | 0 | |||||
| 2026-02-10 | 13F/A | Northwestern Mutual Wealth Management Co | 14.592 | 9,77 | 702 | 1,01 | ||||
| 2026-02-12 | 13F | Mark Sheptoff Financial Planning, Llc | 32.142 | -0,31 | 1.547 | -8,36 | ||||
| 2025-11-14 | 13F | Wood Tarver Financial Group, LLC | 0 | -100,00 | 0 | |||||
| 2026-02-03 | 13F | Kassira Wealth Management LLC | 34.826 | 0,52 | 1.676 | -7,61 | ||||
| 2026-01-29 | 13F | UBS Group AG | 299.688 | -0,37 | 14.421 | -8,39 | ||||
| 2026-02-09 | 13F | Blue Bell Private Wealth Management, Llc | 1.981 | 1,02 | 95 | -6,86 | ||||
| 2026-02-14 | 13F | Rockefeller Capital Management L.P. | 10.602 | -3,27 | 510 | -10,99 | ||||
| 2026-02-04 | 13F | LRI Investments, LLC | 3.900 | 0,00 | 188 | -8,33 | ||||
| 2026-02-17 | 13F | Raymond James Financial Inc | 42.767 | -6,27 | 2.058 | -13,82 | ||||
| 2025-11-10 | 13F | ICICI Prudential Asset Management Co Ltd | 0 | -100,00 | 0 | -100,00 | ||||
| 2026-02-12 | 13F | Sava Penzisko Drushtvo A.d. Skopje | 117.569 | -63,18 | 5.657 | -66,14 | ||||
| 2026-04-13 | 13F | Bank of New Hampshire | 200 | 0,00 | 9 | -11,11 | ||||
| 2026-02-12 | 13F | Steward Partners Investment Advisory, Llc | 29.809 | -5,49 | 1.434 | -13,09 | ||||
| 2026-02-06 | 13F | VSM Wealth Advisory, LLC | 74 | 0,00 | 4 | 0,00 | ||||
| 2026-01-26 | 13F | AE Wealth Management LLC | 28.121 | 44,03 | 1.353 | 32,52 | ||||
| 2026-01-16 | 13F | Crowley Wealth Management, Inc. | 0 | -100,00 | 0 | |||||
| 2026-02-09 | 13F | Integrity Alliance, Llc. | 0 | -100,00 | 0 | |||||
| 2025-11-03 | 13F | Private Wealth Asset Management, LLC | 0 | -100,00 | 0 | |||||
| 2026-02-12 | 13F/A | Pinebridge Investments Llc | 22.090 | 1.063 | ||||||
| 2026-02-12 | 13F | Richard W. Paul & Associates, LLC | 39 | -56,67 | 2 | -75,00 | ||||
| 2026-04-07 | 13F | Farther Finance Advisors, LLC | 5.732 | -27,32 | 254 | -33,25 | ||||
| 2026-02-06 | 13F | HighTower Advisors, LLC | 73.609 | -44,78 | 3.542 | -49,22 | ||||
| 2026-02-13 | 13F | Brown Advisory Inc | 0 | -100,00 | 0 | |||||
| 2026-02-13 | 13F | Gts Securities Llc | 11.328 | 545 | ||||||
| 2026-02-03 | 13F | International Assets Investment Management, Llc | 285 | 14 |