Grundlæggende statistik
| Institutionelle ejere | 265 total, 253 long only, 0 short only, 12 long/short - change of -9,86% MRQ |
| Gennemsnitlig porteføljeallokering | 0.1075 % - change of -51,64% MRQ |
| Institutionelle aktier (lange) | 127.895.408 (ex 13D/G) - change of -57,40MM shares -30,98% MRQ |
| Institutionel værdi (lang) | $ 1.652.999 USD ($1000) |
Institutionelt ejerskab og aktionærer
Harmony Gold Mining Company Limited - Depositary Receipt (Common Stock) (US:HMY) har 265 institutionelle ejere og aktionærer, der har indsendt 13D/G- eller 13F-formularer til Securities Exchange Commission (SEC). Disse institutioner har i alt 127,895,408 aktier. Største aktionærer omfatter Van Eck Associates Corp, Acadian Asset Management Llc, BlackRock, Inc., Aqr Capital Management Llc, FIL Ltd, Dimensional Fund Advisors Lp, AIM SECTOR FUNDS (INVESCO SECTOR FUNDS) - Invesco Oppenheimer Gold & Special Minerals Fund Class C, Exor Capital LLP, American Century Companies Inc, and DFCEX - Emerging Markets Core Equity Portfolio - Institutional Class .
Harmony Gold Mining Company Limited - Depositary Receipt (Common Stock) (NYSE:HMY) institutionel ejerskabsstruktur viser aktuelle positioner i virksomheden efter institutioner og fonde, samt seneste ændringer i positionsstørrelse. Større aktionærer kan omfatte individuelle investorer, investeringsforeninger, hedgefonde eller institutioner. Skema 13D angiver, at investoren besidder (eller besidder) mere end 5 % af virksomheden og har til hensigt (eller har til hensigt at) aktivt at forfølge en ændring i forretningsstrategi. Skema 13G indikerer en passiv investering på over 5%.
The share price as of March 12, 2026 is 15,97 / share. Previously, on March 13, 2025, the share price was 12,21 / share. This represents an increase of 30,79% over that period.

Fondens stemningsscore
Fund Sentiment Score (fka Ownership Accumulation Score) finder de aktier, der bliver mest købt af fonde. Det er resultatet af en sofistikeret, multi-faktor kvantitativ model, der identificerer virksomheder med de højeste niveauer af institutionel akkumulering. Scoringsmodellen bruger en kombination af den samlede stigning i oplyste ejere, ændringerne i porteføljeallokeringer i disse ejere og andre målinger. Tallet går fra 0 til 100, hvor højere tal indikerer et højere niveau af akkumulering for sine jævnaldrende, og 50 er gennemsnittet.
Opdateringsfrekvens: Dagligt
Se Ownership Explorer, som giver en liste over højest rangerende virksomheder.
AI+ Ask Fintel’s AI assistant about Harmony Gold Mining Company Limited - Depositary Receipt (Common Stock).
Select a question to share a public post with an AI-crafted answer.
Thinking of good questions…
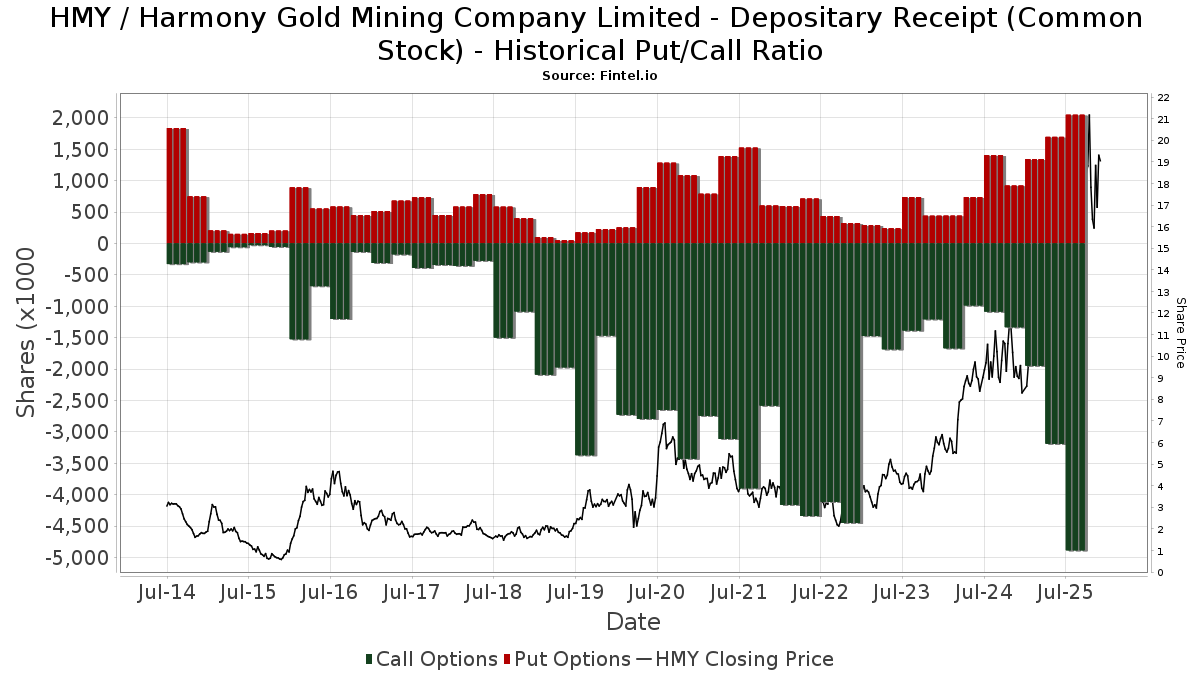
Institutionel Put/Call-forhold
Ud over at indberette standardaktie- og gældsudstedelser skal institutter med mere end 100 mill. aktiver under forvaltning også oplyse deres put- og call-optionsbeholdninger. Da salgsoptioner generelt indikerer negativ stemning, og købsoptioner indikerer positiv stemning, kan vi få en fornemmelse af den overordnede institutionelle stemning ved at plotte forholdet mellem put og kald. Diagrammet til højre viser det historiske put/call-forhold for dette instrument.
Brug af Put/Call Ratio som en indikator for investorernes stemning overvinder en af de vigtigste mangler ved at bruge totalt institutionelt ejerskab, som er, at en betydelig mængde af aktiver under forvaltning investeres passivt for at spore indekser. Passivt forvaltede fonde køber typisk ikke optioner, så indikatoren for put/call-forholdet følger mere nøje følelsen af aktivt forvaltede fonde.
13D/G-arkivering
Vi præsenterer 13D/G ansøgninger separat fra 13F ansøgninger på grund af den forskellige behandling af SEC. 13D/G-ansøgninger kan indgives af grupper af investorer (med én ledende), hvorimod 13F-ansøgninger ikke kan. Dette resulterer i situationer, hvor en investor kan indsende en 13D/G, der rapporterer én værdi for de samlede aktier (der repræsenterer alle de aktier, der ejes af investorgruppen), men derefter indsender en 13F, der rapporterer en anden værdi for de samlede aktier (der udelukkende repræsenterer deres egne) ejendomsret). Det betyder, at aktieejerskab af 13D/G-arkiver og 13F-arkiveringer ofte ikke er direkte sammenlignelige, så vi præsenterer dem separat.
Bemærk: Fra den 16. maj 2021 viser vi ikke længere ejere, der ikke har indsendt en 13D/G inden for det seneste år. Tidligere viste vi den fulde historie af 13D/G-arkiver. Generelt skal enheder, der er forpligtet til at indgive 13D/G-ansøgninger, indgive mindst årligt, før de indsender en afsluttende ansøgning. Dog forlader fonde nogle gange positioner uden at indsende en afsluttende ansøgning (dvs. de afvikler), så visning af den fulde historie resulterede nogle gange i forvirring om det nuværende ejerskab. For at undgå forvirring viser vi nu kun 'aktuelle' ejere - det vil sige - ejere, der har anmeldt inden for det seneste år.
Upgrade to unlock premium data.
| Fil dato | Form | Investor | Forrige Aktier |
Seneste Aktier |
Δ Aktier (Procent) |
Ejendomsret (Procent) |
Δ Ejerskab (Procent) |
|
|---|---|---|---|---|---|---|---|---|
| 2025-11-12 | VAN ECK ASSOCIATES CORP | 54,218,105 | 40,807,468 | -24.73 | 6.41 | -24.94 |
13F og NPORT arkivering
Detaljer om 13F-arkivering er gratis. Detaljer om NP-ansøgninger kræver et premium-medlemskab. Grønne rækker angiver nye positioner. Røde rækker angiver lukkede positioner. Klik på linket ikon for at se den fulde transaktionshistorik.
Opgrader
for at låse premium-data op og eksportere til Excel ![]() .
.
| Fil dato | Kilde | Investor | Type | Gennemsnitlig pris (Øst) |
Aktier | Δ Aktier (%) |
Rapporteret Værdi ($1000) |
Δ Værdi (%) |
Port Alloc (%) |
|
|---|---|---|---|---|---|---|---|---|---|---|
| 2025-09-25 | NP | DFA INVESTMENT DIMENSIONS GROUP INC - World ex U.S. Targeted Value Portfolio Institutional Class This fund is a listed as child fund of Dimensional Fund Advisors Lp and if that institution has disclosed ownership in this security, then these positions will not be double counted when calculating total shares and total value | 33.836 | -11,75 | 455 | -25,29 | ||||
| 2026-02-09 | 13F | Hantz Financial Services, Inc. | 17.184 | 54,30 | 0 | |||||
| 2026-02-17 | 13F | Wiley Bros.-aintree Capital, Llc | 13.088 | -1,30 | 260 | 7,00 | ||||
| 2026-02-12 | 13F | Ci Investments Inc. | 474.430 | -14,31 | 9.441 | 94.310,00 | ||||
| 2026-02-12 | 13F | Jane Street Group, Llc | Call | 119.800 | -42,62 | 2.384 | -37,08 | |||
| 2026-02-13 | 13F | Centiva Capital, LP | 0 | -100,00 | 0 | |||||
| 2026-01-28 | 13F | Geneos Wealth Management Inc. | 730 | 0,27 | 15 | 7,69 | ||||
| 2026-02-12 | 13F | Jane Street Group, Llc | 1.456.789 | 113,21 | 28.990 | 133,77 | ||||
| 2026-02-12 | 13F | Jane Street Group, Llc | Put | 70.800 | -32,76 | 1.409 | -26,32 | |||
| 2025-11-07 | 13F | Sierra Ocean, Llc | 0 | -100,00 | 0 | |||||
| 2026-02-13 | 13F | Towarzystwo Funduszy Inwestycyjnych Pzu Sa | 0 | -100,00 | 0 | |||||
| 2026-02-17 | 13F | CWM Advisors, LLC | 62.040 | 1.235 | ||||||
| 2026-02-11 | 13F | LPL Financial LLC | 229.493 | 27,14 | 4.567 | 39,38 | ||||
| 2026-02-12 | 13F | Mark Sheptoff Financial Planning, Llc | 38.950 | 775 | ||||||
| 2026-02-17 | 13F | Russell Investments Group, Ltd. | 784.801 | 6,90 | 15.704 | 17,35 | ||||
| 2026-02-17 | 13F | Raymond James Financial Inc | 14.683 | 8,08 | 292 | 18,70 | ||||
| 2026-02-13 | 13F | Sei Investments Co | 743.497 | 96,78 | 14.796 | 115,76 | ||||
| 2026-01-14 | 13F | ORG Partners LLC | 2.080 | 13,97 | 41 | 24,24 | ||||
| 2025-11-14 | 13F | Wood Tarver Financial Group, LLC | 0 | -100,00 | 0 | |||||
| 2025-09-25 | NP | Dfa Investment Trust Co - The Emerging Markets Small Cap Series This fund is a listed as child fund of Dimensional Fund Advisors Lp and if that institution has disclosed ownership in this security, then these positions will not be double counted when calculating total shares and total value | 1.030.991 | -14,70 | 13.877 | -27,84 | ||||
| 2026-02-10 | 13F | Goldman Sachs Group Inc | 1.376.156 | -80,56 | 27.386 | -78,68 | ||||
| 2026-02-13 | 13F | Y-Intercept (Hong Kong) Ltd | 14.714 | -93,07 | 293 | -92,42 | ||||
| 2025-11-13 | 13F | Banque Cantonale Vaudoise | 0 | -100,00 | 0 | |||||
| 2026-02-13 | 13F | SRS Capital Advisors, Inc. | 1.261 | 26,10 | 25 | 38,89 | ||||
| 2025-09-29 | NP | AIM SECTOR FUNDS (INVESCO SECTOR FUNDS) - Invesco Oppenheimer Gold & Special Minerals Fund Class C | 4.917.668 | 4.370,61 | 66.192 | 5.242,29 | ||||
| 2026-02-02 | 13F | Advisors Preferred, LLC | 0 | -100,00 | 0 | |||||
| 2026-02-12 | 13F | Penserra Capital Management LLC | 76.292 | 2 | ||||||
| 2025-09-25 | NP | TWAAX - Thrivent International Allocation Fund Class A | 5.607 | -69,23 | 75 | -74,05 | ||||
| 2026-02-17 | 13F | Bank Of America Corp /de/ | 299.000 | -24,49 | 5.950 | -17,20 | ||||
| 2026-02-13 | 13F | JustInvest LLC | 33.832 | 8,92 | 673 | 19,54 | ||||
| 2025-11-14 | 13F | Eqis Capital Management, Inc. | 0 | -100,00 | 0 | |||||
| 2025-09-25 | NP | Dimensional Emerging Markets Value Fund - Dimensional Emerging Markets Value Fund This fund is a listed as child fund of Dimensional Fund Advisors Lp and if that institution has disclosed ownership in this security, then these positions will not be double counted when calculating total shares and total value | 116.229 | 0,00 | 1.564 | -15,41 | ||||
| 2026-02-05 | 13F | Atria Investments Llc | 36.269 | -6,03 | 722 | 3,00 | ||||
| 2026-02-13 | 13F | Sofos Investments, Inc. | 3 | -93,75 | 0 | |||||
| 2026-02-17 | 13F | Lazard Asset Management Llc | 2.988.156 | 29,32 | 59.464 | 41,79 | ||||
| 2026-01-14 | 13F | ORG Wealth Partners, LLC | 462 | -6,29 | 9 | 12,50 | ||||
| 2026-02-17 | 13F | Caption Management, LLC | Call | 275.000 | 587,50 | 5.472 | 653,72 | |||
| 2026-02-14 | 13F | Rockefeller Capital Management L.P. | 233 | 12,56 | 5 | 33,33 | ||||
| 2026-01-15 | 13F | Burns Matteson Capital Management, LLC | 25.019 | 9,08 | 498 | 19,47 | ||||
| 2026-02-17 | 13F | Susquehanna International Group, Llp | Call | 314.100 | 36,45 | 6.251 | 49,59 | |||
| 2026-02-17 | 13F | Capital Fund Management S.a. | Put | 56.000 | -6,98 | 1.114 | 2,01 | |||
| 2026-02-17 | 13F | Capital Fund Management S.a. | Call | 61.600 | -9,81 | 1.226 | -1,13 | |||
| 2025-11-14 | 13F | Point72 Hong Kong Ltd | 0 | -100,00 | 0 | |||||
| 2026-02-17 | 13F | Susquehanna International Group, Llp | 483.550 | -47,38 | 9.623 | -42,31 | ||||
| 2026-02-17 | 13F | Susquehanna International Group, Llp | Put | 307.200 | 33,33 | 6.113 | 46,21 | |||
| 2026-02-17 | 13F | Advisory Services Network, LLC | 0 | -100,00 | 0 | |||||
| 2026-02-11 | 13F | Winton Capital Group Ltd | 29.600 | 589 | ||||||
| 2026-02-17 | 13F | FIL Ltd | 5.587.036 | 111.182 | ||||||
| 2026-01-13 | 13F | CoreCap Advisors, LLC | 500 | 0,00 | 10 | 0,00 | ||||
| 2026-02-02 | 13F | Truist Financial Corp | 13.605 | -30,93 | 271 | -24,37 | ||||
| 2026-02-12 | 13F | Integrated Quantitative Investments LLC | 116.898 | 2.326 | ||||||
| 2026-02-17 | 13F | Fmr Llc | 15.690 | 2,74 | 312 | 12,64 | ||||
| 2026-02-17 | 13F | Quadrature Capital Ltd | 21.721 | 432 | ||||||
| 2026-02-12 | 13F | Alps Advisors Inc | 1.145.343 | -18,53 | 22.792 | -10,67 | ||||
| 2025-09-23 | NP | IIGIX - Voya Multi-Manager International Equity Fund Class I | 4.705 | 63 | ||||||
| 2026-02-06 | 13F | Leonteq Securities AG | 1.019 | 32,51 | 20 | 53,85 | ||||
| 2026-02-09 | 13F/A | Fideuram - Intesa Sanpaolo Private Banking S.p.a. | 5.000 | 100 | ||||||
| 2026-02-10 | 13F | Bank of New York Mellon Corp | 182.799 | 10,56 | 3.638 | 21,23 | ||||
| 2026-02-10 | 13F | Connor, Clark & Lunn Investment Management Ltd. | 0 | -100,00 | 0 | |||||
| 2026-02-17 | 13F | Engineers Gate Manager LP | 213.189 | -31,81 | 4.242 | -25,24 | ||||
| 2026-02-17 | 13F | DV Trading LLC | 868 | 17 | ||||||
| 2026-02-17 | 13F | Asset One Wealth Management LLC | 253.867 | 5.311 | ||||||
| 2026-02-13 | 13F | NLB Skladi, upravljanje premozenja, d.o.o. | 17.049 | 339 | ||||||
| 2026-02-17 | 13F | Jain Global LLC | 111.542 | -1,06 | 2.220 | 8,46 | ||||
| 2026-02-12 | 13F | Commonwealth Equity Services, Llc | 10.208 | 203 | ||||||
| 2026-02-13 | 13F | Cornerstone Financial Management LLC | 27 | 1 | ||||||
| 2026-02-11 | 13F | Vise Technologies, Inc. | 24.002 | 4,48 | 478 | 14,66 | ||||
| 2026-02-13 | 13F | Marshall Wace, Llp | 97.919 | 1.949 | ||||||
| 2026-02-17 | 13F | Cetera Investment Advisers | 67.847 | -81,56 | 1.350 | -79,78 | ||||
| 2026-02-17 | 13F | Quantessence Capital LLC | 0 | -100,00 | 0 | |||||
| 2026-02-17 | 13F | Aquatic Capital Management LLC | 15.074 | -95,47 | 300 | -95,04 | ||||
| 2025-09-25 | NP | DFCEX - Emerging Markets Core Equity Portfolio - Institutional Class This fund is a listed as child fund of Dimensional Fund Advisors Lp and if that institution has disclosed ownership in this security, then these positions will not be double counted when calculating total shares and total value | 3.420.798 | 0,00 | 46.044 | -15,40 | ||||
| 2025-11-14 | 13F | Cubist Systematic Strategies, LLC | 0 | -100,00 | 0 | |||||
| 2026-01-14 | 13F | Jfs Wealth Advisors, Llc | 689 | 0,00 | 14 | 8,33 | ||||
| 2025-09-26 | NP | AEMGX - Acadian Emerging Markets Portfolio Investor Class Shares | 171.593 | -14,18 | 2.310 | -27,41 | ||||
| 2026-01-26 | 13F | Private Trust Co Na | 174 | 3 | ||||||
| 2026-02-13 | 13F | Parkside Financial Bank & Trust | 149 | 0,00 | 3 | 0,00 | ||||
| 2026-01-21 | 13F | Yousif Capital Management, Llc | 10.272 | 0,00 | 236 | 26,88 | ||||
| 2026-02-10 | 13F | AdvisorShares Investments LLC | 93.854 | -13,33 | 1.868 | -4,99 | ||||
| 2025-09-25 | NP | ROAM - Hartford Multifactor Emerging Markets ETF | 6.651 | 27,66 | 90 | 17,11 | ||||
| 2026-02-13 | 13F | Pinnacle Wealth Planning Services, Inc. | 2.156 | 43 | ||||||
| 2026-02-18 | 13F | Beacon Pointe Advisors, LLC | Call | 27.700 | -8,88 | 551 | 0,00 | |||
| 2026-02-18 | 13F | Beacon Pointe Advisors, LLC | 24 | 0 | ||||||
| 2025-10-22 | 13F | Kercheville Advisors, LLC | 0 | -100,00 | 0 | |||||
| 2026-02-13 | 13F | American Century Companies Inc | 4.066.483 | 8,79 | 80.923 | 19,28 | ||||
| 2026-01-23 | 13F | Farther Finance Advisors, LLC | 1.751 | -36,86 | 35 | -32,00 | ||||
| 2025-11-14 | 13F | Aigen Investment Management, Lp | 0 | -100,00 | 0 | |||||
| 2026-02-06 | 13F | Vestmark Advisory Solutions, Inc. | 18.211 | 362 | ||||||
| 2026-01-23 | 13F | Assetmark, Inc | 5.860 | 234,28 | 117 | 274,19 | ||||
| 2026-01-27 | 13F | Ninety One UK Ltd | 348.698 | 6.939 | ||||||
| 2026-02-06 | 13F | EverSource Wealth Advisors, LLC | 8.703 | -18,24 | 173 | -10,36 | ||||
| 2026-02-17 | 13F | Qube Research & Technologies Ltd | 498.181 | -67,12 | 9.914 | -63,95 | ||||
| 2026-02-17 | 13F | LaSalle St. Investment Advisors, LLC | 13.584 | 7,82 | 0 | |||||
| 2026-02-13 | 13F | Macquarie Group Ltd | 0 | -100,00 | 0 | |||||
| 2026-02-04 | 13F | Atlantic Union Bankshares Corp | 0 | -100,00 | 0 | |||||
| 2026-02-17 | 13F | Brevan Howard Capital Management LP | 0 | -100,00 | 0 | |||||
| 2026-02-13 | 13F | Wells Fargo & Company/mn | 135.546 | 39,65 | 2.697 | 53,15 | ||||
| 2026-02-13 | 13F | First Trust Advisors Lp | 15.457 | -3,10 | 308 | 6,23 | ||||
| 2026-02-13 | 13F | Wells Fargo & Company/mn | Put | 60.000 | 1.194 | |||||
| 2026-02-10 | 13F | Bnp Paribas Arbitrage, Sa | 22.471 | -61,59 | 447 | -57,87 | ||||
| 2026-01-30 | 13F | Us Bancorp \de\ | 39.043 | 173,47 | 777 | 199,61 | ||||
| 2026-02-17 | 13F | D. E. Shaw & Co., Inc. | Call | 0 | -100,00 | 0 | ||||
| 2026-02-12 | 13F | Principal Securities, Inc. | 0 | -100,00 | 0 | |||||
| 2026-01-29 | 13F | Rakuten Securities, Inc. | 51.700 | -23,59 | 1.029 | -16,29 | ||||
| 2026-02-12 | 13F | Systematic Alpha Investments, LLC | 21.600 | 0,00 | 430 | 9,44 | ||||
| 2026-02-17 | 13F | Tower Research Capital LLC (TRC) | 0 | -100,00 | 0 | |||||
| 2026-02-18 | 13F | GWM Advisors LLC | 16.467 | -2,23 | 328 | 7,21 | ||||
| 2026-02-10 | 13F | Acadian Asset Management Llc | 6.542.967 | 9,94 | 130 | 21,50 | ||||
| 2026-02-11 | 13F | Jpmorgan Chase & Co | 95.921 | -92,98 | 1.909 | -92,31 | ||||
| 2026-02-11 | 13F | Jpmorgan Chase & Co | Call | 71.600 | -43,08 | 1.425 | -37,63 | |||
| 2025-11-14 | 13F | Mount Yale Investment Advisors, LLC | 0 | -100,00 | 0 | -100,00 | ||||
| 2025-09-25 | NP | DAADX - Emerging Markets ex China Core Equity Portfolio Institutional Class | 55.957 | -52,00 | 753 | -59,39 | ||||
| 2025-11-14 | 13F | Wetherby Asset Management Inc | 10.421 | -2,11 | 189 | 27,70 | ||||
| 2026-02-11 | 13F | Group One Trading, L.p. | Call | 326.000 | -18,70 | 6.487 | -10,87 | |||
| 2026-02-12 | 13F | Ankerstar Wealth, LLC | 100 | 2 | ||||||
| 2026-02-11 | 13F | Group One Trading, L.p. | Put | 133.800 | 326,11 | 2.663 | 367,84 | |||
| 2026-02-11 | 13F | Group One Trading, L.p. | 48.849 | 191,08 | 972 | 219,74 | ||||
| 2026-02-13 | 13F | Vontobel Holding Ltd. | 429.816 | -12,21 | 8.553 | -3,74 | ||||
| 2026-02-19 | 13F | CI Private Wealth, LLC | 18.076 | -7,24 | 360 | 1,70 | ||||
| 2026-02-12 | 13F | North of South Capital LLP | 95.204 | 1.895 | ||||||
| 2026-02-05 | 13F | Plancorp, LLC | 481.851 | 0,00 | 9.589 | 9,64 | ||||
| 2026-02-17 | 13F | Wealth Architects, LLC | 13.658 | -12,09 | 272 | -3,56 | ||||
| 2026-02-12 | 13F | Renaissance Technologies Llc | 1.176.120 | 775,61 | 23.405 | 860,36 | ||||
| 2026-02-17 | 13F | Parallax Volatility Advisers, L.P. | Call | 125.000 | 212,50 | 2.488 | 242,56 | |||
| 2025-09-25 | NP | DFA INVESTMENT DIMENSIONS GROUP INC - Emerging Markets Social Core Equity Portfolio Shares | 106.910 | -23,58 | 1.439 | -35,33 | ||||
| 2026-02-10 | 13F | Exor Capital LLP | 4.897.286 | -56,79 | 97.456 | -52,63 | ||||
| 2026-01-14 | 13F | Generali Investments CEE, investicni spolecnost, a.s. | 23.550 | 0,00 | 469 | 9,60 | ||||
| 2026-02-10 | 13F | Envestnet Asset Management Inc | 178.943 | -6,08 | 3.561 | 2,95 | ||||
| 2026-02-13 | 13F | Verition Fund Management LLC | 85.979 | 577,00 | 1.711 | 643,48 | ||||
| 2026-02-11 | 13F | Comprehensive Financial Planning, Inc./PA | 619 | 0,00 | 12 | 9,09 | ||||
| 2025-11-12 | 13F | Headlands Technologies LLC | 0 | -100,00 | 0 | |||||
| 2026-02-13 | 13F | Segall Bryant & Hamill, Llc | 30.600 | 65,41 | 609 | 81,49 | ||||
| 2026-02-13 | 13F | Bridgewater Associates, LP | 1.224.972 | 1.973,34 | 24.377 | 2.173,88 | ||||
| 2026-02-11 | 13F | Parallel Advisors, LLC | 5.512 | 6,53 | 110 | 17,20 | ||||
| 2026-02-13 | 13F | Transamerica Financial Advisors, Inc. | 17 | 0 | ||||||
| 2026-02-13 | 13F | Squarepoint Ops LLC | 129.119 | 2.569 | ||||||
| 2025-09-25 | NP | DEHP - Dimensional Emerging Markets High Profitability ETF | 20.332 | 0,00 | 274 | -15,48 | ||||
| 2026-02-13 | 13F | Blueshift Asset Management, LLC | 52.895 | 151,81 | 1.053 | 176,12 | ||||
| 2026-02-11 | 13F | Simplex Trading, Llc | 72.800 | -6,47 | 1.449 | 144.700,00 | ||||
| 2026-02-11 | 13F | Simplex Trading, Llc | Call | 87.600 | -54,38 | 1.743 | 58.000,00 | |||
| 2026-02-17 | 13F | Creative Planning | 157.941 | 40,41 | 3.143 | 53,99 | ||||
| 2026-01-28 | 13F | CAPROCK Group, Inc. | 26.119 | 20,44 | 520 | 80,21 | ||||
| 2026-02-11 | 13F | Simplex Trading, Llc | Put | 101.500 | -17,95 | 2.020 | 100.850,00 | |||
| 2026-02-13 | 13F | Schroder Investment Management Group | 315.706 | 1.049,19 | 6.330 | 1.163,27 | ||||
| 2026-02-02 | 13F | Ativo Capital Management LLC | 86.420 | -6,28 | 1.720 | 2,75 | ||||
| 2026-02-03 | 13F | Diversify Wealth Management, Llc | 138.887 | 2,22 | 3.065 | 39,89 | ||||
| 2026-02-12 | 13F | Dimensional Fund Advisors Lp | 5.388.358 | -15,64 | 107.248 | -7,51 | ||||
| 2026-01-28 | 13F | Arizona State Retirement System | 0 | -100,00 | 0 | |||||
| 2026-02-03 | 13F | Ballentine Partners, LLC | 12.859 | 4,95 | 256 | 14,86 | ||||
| 2026-02-12 | 13F | Skopos Labs, Inc. | 34.206 | -46,89 | 682 | -41,61 | ||||
| 2025-09-25 | NP | DFEM - Dimensional Emerging Markets Core Equity 2 ETF | 361.587 | 1,52 | 4.867 | -14,12 | ||||
| 2026-02-05 | 13F | Elyxium Wealth, LLC | 87 | 2 | ||||||
| 2026-02-12 | 13F | BRYN MAWR TRUST Co | 0 | -100,00 | 0 | -100,00 | ||||
| 2025-09-25 | NP | DFA INVESTMENT DIMENSIONS GROUP INC - Emerging Markets Targeted Value Portfolio Institutional Class This fund is a listed as child fund of Dimensional Fund Advisors Lp and if that institution has disclosed ownership in this security, then these positions will not be double counted when calculating total shares and total value | 45.957 | -2,74 | 619 | -17,71 | ||||
| 2026-01-15 | 13F | Nisa Investment Advisors, Llc | 1.300 | 0,00 | 26 | 8,70 | ||||
| 2026-01-05 | 13F | GAMMA Investing LLC | 11.221 | 11,77 | 223 | 22,53 | ||||
| 2025-10-15 | 13F | Financial Management Professionals, Inc. | 0 | -100,00 | 0 | |||||
| 2025-09-25 | NP | DFAX - Dimensional World ex U.S. Core Equity 2 ETF | 425.805 | 0,00 | 5.731 | -15,40 | ||||
| 2026-02-18 | 13F | Cim, Llc | 89.984 | 1.791 | ||||||
| 2026-02-17 | 13F | Millennium Management Llc | 1.427.682 | -47,99 | 28.411 | -42,98 | ||||
| 2025-09-25 | NP | DFAE - Dimensional Emerging Core Equity Market ETF | 252.071 | 2,34 | 3.393 | -13,43 | ||||
| 2026-02-03 | 13F | Denali Advisors Llc | 15.038 | -3,61 | 299 | 5,65 | ||||
| 2026-02-02 | 13F | PKO Investment Management Joint-Stock Co | 226.700 | 7,09 | 4.511 | 17,41 | ||||
| 2025-11-13 | 13F | FORA Capital, LLC | 0 | -100,00 | 0 | -100,00 | ||||
| 2026-02-24 | 13F | Bell Investment Advisors, Inc | 364 | 156,34 | 7 | 250,00 | ||||
| 2025-11-14 | 13F | Point72 Asset Management, L.P. | 0 | -100,00 | 0 | -100,00 | ||||
| 2026-02-13 | 13F | MAI Capital Management | 156 | 0,00 | 3 | 50,00 | ||||
| 2026-02-17 | 13F | Point72 Asset Management, L.P. | Put | 41.300 | 822 | |||||
| 2026-02-17 | 13F | Point72 Asset Management, L.P. | Call | 57.600 | 1.146 | |||||
| 2026-02-12 | 13F | Quadrant Capital Group Llc | 44.496 | 0,13 | 885 | 9,80 | ||||
| 2025-11-12 | 13F | NewSquare Capital LLC | 0 | -100,00 | 0 | |||||
| 2025-09-26 | NP | INVESCO ACTIVELY MANAGED EXCHANGE-TRADED FUND TRUST - Invesco Global Equity Net Zero ETF | 6.171 | 83 | ||||||
| 2025-10-27 | 13F | Kiker Wealth Management, LLC | 0 | -100,00 | 0 | |||||
| 2026-02-13 | 13F | Virtus ETF Advisers LLC | 30.288 | 603 | ||||||
| 2026-02-10 | 13F | Savant Capital, LLC | 15.103 | -3,09 | 301 | 6,38 | ||||
| 2026-02-11 | 13F | O'shaughnessy Asset Management, Llc | 301.100 | -5,49 | 5.992 | 3,61 | ||||
| 2026-02-06 | 13F | Larson Financial Group LLC | 320 | 357,14 | 6 | 500,00 | ||||
| 2026-02-18 | 13F | Vident Advisory, LLC | 169.690 | 34,08 | 3.377 | 46,97 | ||||
| 2026-02-06 | 13F | Abn Amro Investment Solutions | 37.063 | -19,71 | 738 | -11,95 | ||||
| 2026-02-17 | 13F | Northern Trust Corp | 51.096 | 26,29 | 1.017 | 38,42 | ||||
| 2026-01-27 | 13F | TD Waterhouse Canada Inc. | 47.079 | 0,51 | 936 | 8,46 | ||||
| 2026-02-06 | 13F | Global Retirement Partners, LLC | 7.870 | 2.480,33 | 157 | 3.020,00 | ||||
| 2026-02-17 | 13F | Delaware Management Holdings, Inc. | 38.834 | 773 | ||||||
| 2026-02-17 | 13F | Advisor Group Holdings, Inc. | 4.183 | -29,31 | 83 | -19,42 | ||||
| 2026-02-12 | 13F | Advisors Asset Management, Inc. | 63.540 | 9,51 | 1.264 | 20,04 | ||||
| 2025-09-26 | NP | UUPIX - Ultraemerging Markets Profund Investor Class | 2.727 | 20,88 | 37 | 2,86 | ||||
| 2025-09-26 | NP | REMSX - Emerging Markets Fund Class S | 29.848 | -50,47 | 402 | 55,43 | ||||
| 2026-01-23 | 13F | Ritholtz Wealth Management | 162.742 | -8,79 | 3.239 | 0,00 | ||||
| 2026-01-06 | 13F | Sanctuary Advisors, LLC | 0 | -100,00 | 0 | |||||
| 2026-02-12 | 13F | Federation des caisses Desjardins du Quebec | 1.000 | 0,00 | 20 | 5,56 | ||||
| 2026-01-20 | 13F | Signaturefd, Llc | 16.590 | 1,64 | 330 | 11,49 | ||||
| 2026-02-13 | 13F | Morgan Stanley | 959.380 | -14,26 | 19.092 | -5,99 | ||||
| 2026-02-17 | 13F/A | Beverly Hills Private Wealth, LLC | 18.092 | -2,26 | 360 | 7,46 | ||||
| 2025-11-13 | 13F | Jump Financial, LLC | 0 | -100,00 | 0 | |||||
| 2026-02-10 | 13F | Marietta Investment Partners Llc | 270.027 | 1,31 | 5.374 | 11,08 | ||||
| 2026-01-15 | 13F | Highline Wealth Partners Llc | 278 | 52,75 | 6 | 66,67 | ||||
| 2026-02-05 | 13F | Allworth Financial LP | 1.985 | 8,00 | 40 | 18,18 | ||||
| 2026-02-17 | 13F | MIRAE ASSET GLOBAL ETFS HOLDINGS Ltd. | 777.714 | -6,17 | 15.477 | 2,88 | ||||
| 2026-02-11 | 13F | Fox Run Management, L.l.c. | 0 | -100,00 | 0 | |||||
| 2026-01-27 | 13F | WealthCollab, LLC | 788 | 0,00 | 16 | 7,14 | ||||
| 2026-02-05 | 13F | Td Private Client Wealth Llc | 1.324 | 26 | ||||||
| 2026-02-05 | 13F | Cambridge Investment Research Advisors, Inc. | 46.899 | -0,09 | 1 | |||||
| 2026-02-13 | 13F | Walleye Capital LLC | 22.900 | 456 | ||||||
| 2026-02-06 | 13F | FourThought Financial Partners, LLC | 0 | -100,00 | 0 | |||||
| 2026-02-17 | 13F | Aqr Capital Management Llc | 5.730.690 | -2,39 | 114.041 | 7,67 | ||||
| 2026-02-17 | 13F | Bayesian Capital Management, LP | 10.651 | 212 | ||||||
| 2026-02-13 | 13F | Arrowstreet Capital, Limited Partnership | 3.042.664 | 31,92 | 60.549 | 44,64 | ||||
| 2026-02-13 | 13F | Caitong International Asset Management Co., Ltd | 1.301 | 26 | ||||||
| 2026-01-26 | 13F | Cwm, Llc | 24.736 | 2.177,72 | 0 | |||||
| 2026-02-13 | 13F | Smartleaf Asset Management LLC | 1.154 | 33,87 | 23 | 53,33 | ||||
| 2026-02-17 | 13F | Quantinno Capital Management LP | 71.294 | 75,72 | 1.419 | 92,66 | ||||
| 2026-02-12 | 13F | Hrt Financial Lp | 313.490 | -47,39 | 6 | -40,00 | ||||
| 2026-03-05 | 13F | Gunpowder Capital Management, LLC dba Oliver Wealth Management | 205 | 4 | ||||||
| 2026-02-13 | 13F | OMERS ADMINISTRATION Corp | 56.724 | -57,16 | 1.129 | -53,06 | ||||
| 2026-01-21 | 13F | Flagship Harbor Advisors, Llc | 1.200 | 24 | ||||||
| 2026-02-17 | 13F | Two Sigma Investments, Lp | 75.546 | -57,27 | 1.503 | -53,15 | ||||
| 2025-11-14 | 13F | Wolverine Trading, Llc | Call | 173.900 | 80,02 | 3.174 | 145,21 | |||
| 2025-11-14 | 13F | Wolverine Trading, Llc | 0 | -100,00 | 0 | -100,00 | ||||
| 2025-11-14 | 13F | Wolverine Trading, Llc | Put | 51.300 | 60,82 | 936 | 119,20 | |||
| 2026-02-12 | 13F | BlackRock, Inc. | 6.364.196 | -7,42 | 126.648 | 1,51 | ||||
| 2026-02-17 | 13F | Weiss Asset Management LP | 92.640 | -34,39 | 1.844 | -28,06 | ||||
| 2026-02-13 | 13F | Rhumbline Advisers | 5.759 | -12,00 | 115 | -3,39 | ||||
| 2026-02-17 | 13F | Jones Financial Companies Lllp | 4.842 | 23,84 | 96 | 37,14 | ||||
| 2026-02-17 | 13F | Graham Capital Management, L.P. | 10.895 | -0,66 | 217 | 8,54 | ||||
| 2026-02-05 | 13F | Plante Moran Financial Advisors, LLC | 1.135 | 0,00 | 23 | 10,00 | ||||
| 2026-02-13 | 13F | National Bank Of Canada /fi/ | 29.220 | -96,04 | 581 | -95,66 | ||||
| 2026-02-20 | 13F | Dorsey Wright & Associates | 144.460 | 4,40 | 2.875 | 14,50 | ||||
| 2026-02-17 | 13F | Ameriprise Financial Inc | 16.604 | 8,23 | 330 | 18,71 | ||||
| 2025-09-26 | NP | HAOSX - Harbor Overseas Fund Institutional Class | 18.378 | -14,23 | 247 | 34,97 | ||||
| 2026-02-12 | 13F | New York State Common Retirement Fund | 138.466 | -18,51 | 2.755 | -10,64 | ||||
| 2026-02-13 | 13F | Eschler Asset Management LLP | 70.596 | 507,64 | 1.405 | 568,57 | ||||
| 2026-02-03 | 13F | Sequoia Financial Advisors, LLC | 11.712 | 3,89 | 233 | 14,22 | ||||
| 2026-02-09 | 13F | IPG Investment Advisors LLC | 15.000 | 0,00 | 298 | 9,56 | ||||
| 2026-02-13 | 13F | Citigroup Inc | 9.622 | -58,29 | 191 | -54,31 | ||||
| 2026-02-17 | 13F | Balyasny Asset Management Llc | 166.216 | 3.308 | ||||||
| 2026-01-21 | 13F | Towarzystwo Funduszy Inwestycyjnych Allianz Polska S.A. | 91.000 | 22,97 | 1.825 | 35,82 | ||||
| 2026-01-29 | 13F | UMA Financial Services, Inc. | 24 | -11,11 | 0 | |||||
| 2026-01-09 | 13F | Diversified Trust Co | 19.294 | -16,57 | 384 | -8,59 | ||||
| 2026-02-09 | 13F | HBK Sorce Advisory LLC | 11.749 | -0,47 | 239 | -4,02 | ||||
| 2026-02-13 | 13F | Citigroup Inc | Call | 90.000 | -66,04 | 1.791 | -62,76 | |||
| 2026-01-29 | 13F | Ashton Thomas Private Wealth, LLC | 15.882 | -87,15 | 316 | -85,91 | ||||
| 2026-02-12 | 13F | Summit Financial, LLC | 150.986 | -0,07 | 3.005 | 9,56 | ||||
| 2026-02-13 | 13F | Pinpoint Asset Management (Singapore) Pte. Ltd. | 1.800 | 36 | ||||||
| 2026-02-06 | 13F/A | Rathbone Brothers plc | 18.635 | -34,92 | 371 | -28,71 | ||||
| 2026-02-17 | 13F | Quantitative Investment Management, LLC | 0 | -100,00 | 0 | |||||
| 2026-01-29 | 13F | IMC-Chicago, LLC | Put | 183.700 | 13,54 | 3.656 | 24,49 | |||
| 2026-01-29 | 13F | IMC-Chicago, LLC | Call | 308.800 | 12,54 | 6.145 | 23,39 | |||
| 2026-02-17 | 13F | Trexquant Investment LP | 0 | -100,00 | 0 | |||||
| 2026-02-10 | 13F | Nomura Asset Management Co Ltd | 0 | 0 | ||||||
| 2026-02-05 | 13F | Baader Bank INC | 0 | -100,00 | 0 | |||||
| 2026-02-11 | 13F | Deutsche Bank Ag\ | 692.116 | 13.773 | ||||||
| 2026-02-24 | 13F | DGS Capital Management, LLC | 10.036 | -31,36 | 200 | -24,91 | ||||
| 2026-02-06 | 13F | IFP Advisors, Inc | 4.969 | 0,38 | 99 | 10,11 | ||||
| 2026-01-22 | 13F | Personal Cfo Solutions, Llc | 23.980 | 4,93 | 477 | 15,22 | ||||
| 2026-02-02 | 13F | Qrg Capital Management, Inc. | 17.282 | 5,22 | 344 | 15,10 | ||||
| 2026-02-09 | 13F | Catalyst Funds Management Pty Ltd | 0 | -100,00 | 0 | |||||
| 2026-02-09 | 13F | Harbour Investments, Inc. | 56 | 1 | ||||||
| 2026-02-17 | 13F | D. E. Shaw & Co., Inc. | Put | 253.000 | -21,33 | 5.035 | -13,76 | |||
| 2026-02-05 | 13F | Thrivent Financial For Lutherans | 61.916 | 0,00 | 1 | 0,00 | ||||
| 2026-02-17 | 13F | Schonfeld Strategic Advisors LLC | 267.816 | 459,35 | 5.330 | 513,23 | ||||
| 2026-01-09 | 13F | Assenagon Asset Management S.A. | 896.078 | 17.832 | ||||||
| 2026-02-17 | 13F | D. E. Shaw & Co., Inc. | 222.789 | 5,22 | 4.434 | 15,35 | ||||
| 2026-02-17 | 13F | Old Mission Capital Llc | 115.545 | -31,45 | 2.299 | -24,84 | ||||
| 2026-02-13 | 13F | Lord, Abbett & Co. Llc | 1.172.394 | 30,27 | 23 | 43,75 | ||||
| 2026-01-08 | 13F | True Wealth Design, LLC | 115 | 21,05 | 2 | 100,00 | ||||
| 2026-02-17 | 13F | Voloridge Investment Management, Llc | 1.450.415 | 44,58 | 28.863 | 58,53 | ||||
| 2026-02-17 | 13F | Wellington Management Group Llp | 240.773 | -20,95 | 4.791 | -13,33 | ||||
| 2026-02-17 | 13F | Man Group plc | 2.500.071 | 45,03 | 49.751 | 59,01 | ||||
| 2026-02-02 | 13F | Alliance Wealth Advisors, LLC /UT | 0 | -100,00 | 0 | |||||
| 2026-02-12 | 13F | Qtron Investments LLC | 0 | -100,00 | 0 | |||||
| 2026-02-17 | 13F | Royal Bank Of Canada | 9.867 | -80,94 | 197 | -79,04 | ||||
| 2026-02-17 | 13F | ExodusPoint Capital Management, LP | 0 | -100,00 | 0 | -100,00 | ||||
| 2025-09-23 | NP | GERIX - Goldman Sachs Emerging Markets Equity Insights Fund Institutional | 1.449.848 | 43,29 | 19.515 | 21,22 | ||||
| 2026-01-16 | 13F | Ronald Blue Trust, Inc. | 10.470 | 0,97 | 208 | 10,64 | ||||
| 2026-02-17 | 13F | Public Employees Retirement System Of Ohio | 466.359 | 16,38 | 9.281 | 27,60 | ||||
| 2026-01-27 | 13F | Bayforest Capital Ltd | 1.768 | -63,00 | 35 | -59,30 | ||||
| 2025-11-03 | 13F | Summit Global Investments | 0 | -100,00 | 0 | |||||
| 2026-02-13 | 13F | Peak6 Llc | Call | 879.300 | -61,48 | 17.498 | -57,77 | |||
| 2026-01-28 | 13F | U S Global Investors Inc | 266.409 | -13,16 | 5.302 | -4,80 | ||||
| 2026-01-29 | 13F | Ariose Capital Management Ltd | 0 | -100,00 | 0 | |||||
| 2026-02-13 | 13F | Peak6 Llc | Put | 227.800 | 1,83 | 4.533 | 11,65 | |||
| 2025-09-22 | NP | GSEQX - Goldman Sachs Multi-Manager Global Equity Fund Class R6 Shares | 17.585 | 0,00 | 237 | -15,41 | ||||
| 2026-02-10 | 13F/A | Northwestern Mutual Wealth Management Co | 1.108 | 6,03 | 22 | 22,22 | ||||
| 2026-02-13 | 13F | Stifel Financial Corp | 56.966 | 6,33 | 1.134 | 16,56 | ||||
| 2026-02-18 | 13F | Mackenzie Financial Corp | 174.317 | -83,97 | 3.488 | -82,33 | ||||
| 2025-10-20 | 13F | Shilanski & Associates, Inc. | 22.909 | 3,01 | 416 | 33,87 | ||||
| 2026-01-28 | 13F | B. Metzler seel. Sohn & Co. AG | 86.869 | 0,00 | 1.729 | 9,64 | ||||
| 2026-01-29 | 13F | Veracity Capital LLC | 14.466 | 0,42 | 288 | 9,96 | ||||
| 2025-09-26 | NP | PMPIX - Precious Metals Ultrasector Profund Investor Class | 42.340 | -6,33 | 570 | -20,86 | ||||
| 2026-02-04 | 13F | Abc Arbitrage Sa | 2.488.874 | 143,65 | 49.529 | 167,14 | ||||
| 2026-02-13 | 13F | Barclays Plc | 948.683 | 240,63 | 18.879 | 273,53 | ||||
| 2026-01-29 | 13F | UBS Group AG | 209.553 | -61,75 | 4.170 | -58,06 | ||||
| 2026-02-17 | 13F | Guggenheim Capital Llc | 322.770 | -15,29 | 6.423 | -7,11 | ||||
| 2025-11-14 | 13F | Two Sigma Securities, Llc | 0 | -100,00 | 0 | |||||
| 2026-02-13 | 13F | Ubs Asset Management Americas Inc | 283 | -99,58 | 6 | -99,59 | ||||
| 2026-02-06 | 13F | HighTower Advisors, LLC | 18.238 | -25,96 | 363 | -19,02 | ||||
| 2026-02-10 | 13F | Quantbot Technologies LP | 0 | -100,00 | 0 | |||||
| 2026-02-12 | 13F | Bank Of Montreal /can/ | 258.626 | -30,58 | 5.147 | -23,89 | ||||
| 2026-02-06 | 13F | Profund Advisors Llc | 68.934 | -14,96 | 1.372 | -6,80 | ||||
| 2026-02-17 | 13F | Amundi | 2.674.941 | -7,10 | 53.231 | -0,23 | ||||
| 2025-09-25 | NP | DEXC - Dimensional Emerging Markets ex China Core Equity ETF | 8.538 | 11,29 | 115 | -6,56 | ||||
| 2026-02-10 | 13F | Rothschild Investment Llc | 450 | 9 | ||||||
| 2026-02-12 | 13F | Campbell & CO Investment Adviser LLC | 78.806 | 19,82 | 1.568 | 31,43 | ||||
| 2026-02-11 | 13F | IMA Wealth, Inc. | 39 | 1 | ||||||
| 2026-02-13 | 13F | Mariner, LLC | 129.383 | 1,93 | 2.575 | 11,77 | ||||
| 2026-02-06 | 13F | Pnc Financial Services Group, Inc. | 12.532 | 18,27 | 249 | 29,69 | ||||
| 2026-02-11 | 13F | BI Asset Management Fondsmaeglerselskab A/S | 391.485 | 8 | ||||||
| 2026-02-05 | 13F | Bessemer Group Inc | 2 | 0,00 | 0 | |||||
| 2026-01-23 | 13F | Diversify Advisory Services, LLC | 48.741 | 8,32 | 1.063 | 46,48 | ||||
| 2026-02-09 | 13F | Employees Retirement System of Texas | 52.329 | 0,00 | 1 | |||||
| 2025-09-25 | NP | Dfa Investment Trust Co - The Emerging Markets Series This fund is a listed as child fund of Dimensional Fund Advisors Lp and if that institution has disclosed ownership in this security, then these positions will not be double counted when calculating total shares and total value | 234.867 | -6,73 | 3.161 | -21,09 | ||||
| 2026-02-12 | 13F | Barometer Capital Management Inc. | 0 | -100,00 | 0 | |||||
| 2026-02-17 | 13F | Royal Bank Of Canada | Call | 0 | -100,00 | 0 | ||||
| 2026-02-12 | 13F | Groupe la Francaise | 0 | -100,00 | 0 | |||||
| 2026-02-17 | 13F | Citadel Advisors Llc | Put | 581.000 | -21,72 | 11.562 | -14,17 | |||
| 2026-03-06 | 13F | Hsbc Holdings Plc | 90.759 | 1.815 | ||||||
| 2026-02-17 | 13F | XTX Topco Ltd | 0 | -100,00 | 0 | |||||
| 2026-01-09 | 13F | SG Americas Securities, LLC | Call | 191.000 | 0 | |||||
| 2026-01-09 | 13F | SG Americas Securities, LLC | 37.117 | 65,18 | 1 | |||||
| 2026-02-17 | 13F | Citadel Advisors Llc | 442.520 | -46,98 | 8.806 | -41,87 | ||||
| 2026-02-12 | 13F | Rossby Financial, LCC | 12 | 0,00 | 0 | |||||
| 2026-02-17 | 13F | Citadel Advisors Llc | Call | 196.700 | -8,51 | 3.914 | 0,31 | |||
| 2026-02-17 | 13F | Laird Norton Trust Company, Llc | 18.857 | 375 | ||||||
| 2026-02-06 | 13F | Wrapmanager Inc | 10.405 | -17,65 | 207 | -9,61 | ||||
| 2026-02-03 | 13F | SBI Securities Co., Ltd. | 138.449 | -49,29 | 2.755 | -44,40 | ||||
| 2026-02-12 | 13F | Colonial Trust Advisors | 1.896 | 0,00 | 38 | 8,82 | ||||
| 2026-02-13 | 13F | Mml Investors Services, Llc | 10.882 | -14,54 | 217 | -6,49 | ||||
| 2026-02-12 | 13F | Brown Brothers Harriman & Co | 415 | 0,00 | 8 | 14,29 | ||||
| 2025-09-25 | NP | Thrivent Core Funds - Thrivent Core Emerging Markets Equity Fund | 41.517 | -69,11 | 559 | -73,90 | ||||
| 2026-01-27 | 13F | PFG Advisors | 24.721 | 492 | ||||||
| 2026-02-13 | 13F | Van Eck Associates Corp | 33.612.617 | -12,45 | 669 | -4,02 | ||||
| 2026-01-29 | 13F | Aprio Wealth Management, LLC | 27.117 | -5,66 | 540 | 3,45 | ||||
| 2026-01-16 | 13F | FNY Investment Advisers, LLC | 7.941 | 0 | ||||||
| 2026-02-19 | 13F | Invesco Ltd. | 3.233.390 | -21,15 | 64.344 | -13,55 | ||||
| 2026-02-13 | 13F | Integrated Wealth Concepts LLC | 0 | -100,00 | 0 | |||||
| 2026-02-13 | 13F | Atlas Capital Advisors Llc | 44.880 | -6,66 | 893 | 33,08 | ||||
| 2026-02-19 | 13F | Atomi Financial Group, Inc. | 28.314 | 6,15 | 563 | 16,32 | ||||
| 2025-11-14 | 13F | Tudor Investment Corp Et Al | Call | 0 | -100,00 | 0 |