Grundlæggende statistik
| Institutionelle aktier (lange) | 22.676.991 - 98,29% (ex 13D/G) - change of -6,10MM shares -21,19% MRQ |
| Institutionel værdi (lang) | $ 478.345 USD ($1000) |
Institutionelt ejerskab og aktionærer
Helen of Troy Limited (US:HELE) har 200 institutionelle ejere og aktionærer, der har indsendt 13D/G- eller 13F-formularer til Securities Exchange Commission (SEC). Disse institutioner har i alt 22,676,991 aktier. Største aktionærer omfatter BlackRock, Inc., Vanguard Group Inc, Millennium Management Llc, Pzena Investment Management Llc, Charles Schwab Investment Management Inc, Ameriprise Financial Inc, Wellington Management Group Llp, D. E. Shaw & Co., Inc., Dimensional Fund Advisors Lp, and Bank Of America Corp /de/ .
Helen of Troy Limited (NasdaqGS:HELE) institutionel ejerskabsstruktur viser aktuelle positioner i virksomheden efter institutioner og fonde, samt seneste ændringer i positionsstørrelse. Større aktionærer kan omfatte individuelle investorer, investeringsforeninger, hedgefonde eller institutioner. Skema 13D angiver, at investoren besidder (eller besidder) mere end 5 % af virksomheden og har til hensigt (eller har til hensigt at) aktivt at forfølge en ændring i forretningsstrategi. Skema 13G indikerer en passiv investering på over 5%.
The share price as of March 30, 2026 is 14,01 / share. Previously, on March 31, 2025, the share price was 53,49 / share. This represents a decline of 73,81% over that period.

Fondens stemningsscore
Fund Sentiment Score (fka Ownership Accumulation Score) finder de aktier, der bliver mest købt af fonde. Det er resultatet af en sofistikeret, multi-faktor kvantitativ model, der identificerer virksomheder med de højeste niveauer af institutionel akkumulering. Scoringsmodellen bruger en kombination af den samlede stigning i oplyste ejere, ændringerne i porteføljeallokeringer i disse ejere og andre målinger. Tallet går fra 0 til 100, hvor højere tal indikerer et højere niveau af akkumulering for sine jævnaldrende, og 50 er gennemsnittet.
Opdateringsfrekvens: Dagligt
Se Ownership Explorer, som giver en liste over højest rangerende virksomheder.
AI+ Ask Fintel’s AI assistant about Helen of Troy Limited.
Select a question to share a public post with an AI-crafted answer.
Thinking of good questions…
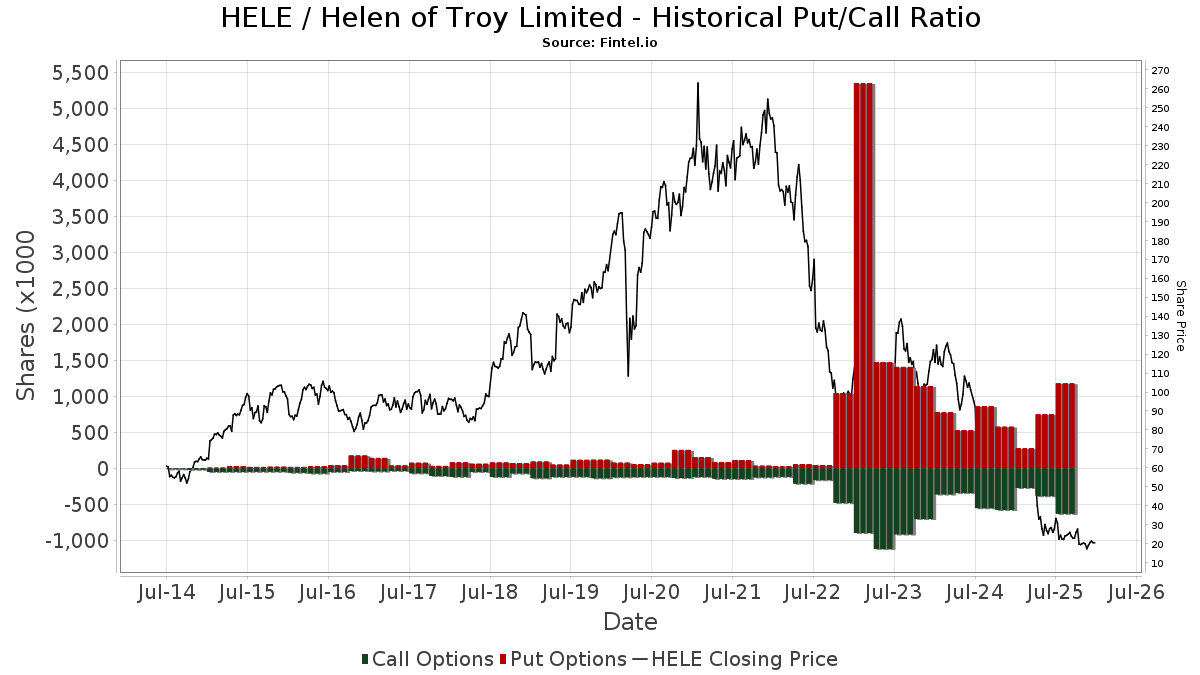
Institutionel Put/Call-forhold
Ud over at indberette standardaktie- og gældsudstedelser skal institutter med mere end 100 mill. aktiver under forvaltning også oplyse deres put- og call-optionsbeholdninger. Da salgsoptioner generelt indikerer negativ stemning, og købsoptioner indikerer positiv stemning, kan vi få en fornemmelse af den overordnede institutionelle stemning ved at plotte forholdet mellem put og kald. Diagrammet til højre viser det historiske put/call-forhold for dette instrument.
Brug af Put/Call Ratio som en indikator for investorernes stemning overvinder en af de vigtigste mangler ved at bruge totalt institutionelt ejerskab, som er, at en betydelig mængde af aktiver under forvaltning investeres passivt for at spore indekser. Passivt forvaltede fonde køber typisk ikke optioner, så indikatoren for put/call-forholdet følger mere nøje følelsen af aktivt forvaltede fonde.
13D/G-arkivering
Vi præsenterer 13D/G ansøgninger separat fra 13F ansøgninger på grund af den forskellige behandling af SEC. 13D/G-ansøgninger kan indgives af grupper af investorer (med én ledende), hvorimod 13F-ansøgninger ikke kan. Dette resulterer i situationer, hvor en investor kan indsende en 13D/G, der rapporterer én værdi for de samlede aktier (der repræsenterer alle de aktier, der ejes af investorgruppen), men derefter indsender en 13F, der rapporterer en anden værdi for de samlede aktier (der udelukkende repræsenterer deres egne) ejendomsret). Det betyder, at aktieejerskab af 13D/G-arkiver og 13F-arkiveringer ofte ikke er direkte sammenlignelige, så vi præsenterer dem separat.
Bemærk: Fra den 16. maj 2021 viser vi ikke længere ejere, der ikke har indsendt en 13D/G inden for det seneste år. Tidligere viste vi den fulde historie af 13D/G-arkiver. Generelt skal enheder, der er forpligtet til at indgive 13D/G-ansøgninger, indgive mindst årligt, før de indsender en afsluttende ansøgning. Dog forlader fonde nogle gange positioner uden at indsende en afsluttende ansøgning (dvs. de afvikler), så visning af den fulde historie resulterede nogle gange i forvirring om det nuværende ejerskab. For at undgå forvirring viser vi nu kun 'aktuelle' ejere - det vil sige - ejere, der har anmeldt inden for det seneste år.
Upgrade to unlock premium data.
| Fil dato | Form | Investor | Forrige Aktier |
Seneste Aktier |
Δ Aktier (Procent) |
Ejendomsret (Procent) |
Δ Ejerskab (Procent) |
|
|---|---|---|---|---|---|---|---|---|
| 2026-03-27 | VANGUARD GROUP INC | 1,526,957 | 0 | -100.00 | 0.00 | -100.00 | ||
| 2026-01-08 | BlackRock, Inc. | 3,507,321 | 1,607,055 | -54.18 | 7.00 | -54.55 | ||
| 2025-08-07 | FMR LLC | 2,587,360 | 3,259 | -99.87 | 0.00 | -100.00 |
13F og NPORT arkivering
Detaljer om 13F-arkivering er gratis. Detaljer om NP-ansøgninger kræver et premium-medlemskab. Grønne rækker angiver nye positioner. Røde rækker angiver lukkede positioner. Klik på linket ikon for at se den fulde transaktionshistorik.
Opgrader
for at låse premium-data op og eksportere til Excel ![]() .
.
| Fil dato | Kilde | Investor | Type | Gennemsnitlig pris (Øst) |
Aktier | Δ Aktier (%) |
Rapporteret Værdi ($1000) |
Δ Værdi (%) |
Port Alloc (%) |
|
|---|---|---|---|---|---|---|---|---|---|---|
| 2026-02-17 | 13F | Invenomic Capital Management LP | 593.310 | 6,91 | 12.608 | -9,85 | ||||
| 2026-02-10 | 13F | Goldman Sachs Group Inc | 511.630 | -24,13 | 10.872 | -36,02 | ||||
| 2026-02-09 | 13F | Atlantic Trust, LLC | 90 | 143,24 | 2 | |||||
| 2026-02-06 | 13F | IFP Advisors, Inc | 101 | 1.342,86 | 2 | |||||
| 2026-02-11 | 13F | Group One Trading, L.p. | Call | 22.300 | 31,18 | 474 | 10,51 | |||
| 2026-02-13 | 13F | Y-Intercept (Hong Kong) Ltd | 106.051 | 2.254 | ||||||
| 2025-10-24 | 13F | MorganRosel Wealth Management, LLC | 0 | -100,00 | 0 | |||||
| 2026-02-11 | 13F | Group One Trading, L.p. | Put | 16.500 | 17,86 | 351 | -0,57 | |||
| 2026-02-13 | 13F | Public Sector Pension Investment Board | 0 | -100,00 | 0 | |||||
| 2026-02-11 | 13F | Group One Trading, L.p. | 9.221 | -14,11 | 196 | -27,78 | ||||
| 2025-11-06 | 13F | Oppenheimer Asset Management Inc. | 0 | -100,00 | 0 | |||||
| 2026-02-11 | 13F | Barrow Hanley Mewhinney & Strauss Llc | 187 | 0,00 | 4 | -25,00 | ||||
| 2026-02-17 | 13F | Aster Capital Management (DIFC) Ltd | 23.718 | 504 | ||||||
| 2026-02-13 | 13F | Healthcare Of Ontario Pension Plan Trust Fund | 231.391 | 4.917 | ||||||
| 2026-02-17 | 13F | Price T Rowe Associates Inc /md/ | 33.958 | 37,53 | 1 | |||||
| 2026-01-27 | 13F | Zurcher Kantonalbank (Zurich Cantonalbank) | 0 | -100,00 | 0 | |||||
| 2025-10-30 | 13F | Traub Capital Management LLC | 0 | -100,00 | 0 | |||||
| 2026-02-06 | 13F | Prescott Group Capital Management, L.l.c. | 110.291 | 2.344 | ||||||
| 2026-02-17 | 13F | Bank Of America Corp /de/ | 648.548 | 35,45 | 13.782 | 14,21 | ||||
| 2026-02-17 | 13F | California State Teachers Retirement System | 1.411 | -93,39 | 30 | -94,61 | ||||
| 2026-02-17 | 13F | Wiley Bros.-aintree Capital, Llc | 14.959 | 3,87 | 317 | -12,47 | ||||
| 2026-01-23 | 13F | Farther Finance Advisors, LLC | 1.351 | 5.529,17 | 29 | |||||
| 2026-02-04 | 13F | Pacific Ridge Capital Partners, LLC | 50.536 | 14,89 | 1.074 | -3,16 | ||||
| 2026-02-12 | 13F | Quadrant Capital Group Llc | 1.365 | 11,34 | 29 | -3,33 | ||||
| 2026-02-12 | 13F | Bank Of Montreal /can/ | 0 | -100,00 | 0 | |||||
| 2026-02-09 | 13F | Geode Capital Management, Llc | 557.231 | 10,01 | 11.844 | -7,23 | ||||
| 2026-01-08 | 13F | Wealth Enhancement Advisory Services, Llc | 0 | -100,00 | 0 | |||||
| 2025-10-31 | 13F | Whittier Trust Co | 0 | -100,00 | 0 | |||||
| 2026-02-11 | 13F | Franklin Resources Inc | 144.739 | 7,64 | 3.076 | -9,24 | ||||
| 2026-02-17 | 13F | Fmr Llc | 2.494 | -33,56 | 53 | -44,68 | ||||
| 2026-02-17 | 13F | Engineers Gate Manager LP | 59.454 | 1.263 | ||||||
| 2025-11-14 | 13F | Binnacle Investments Inc | 3 | 0 | ||||||
| 2026-02-09 | 13F | Royce & Associates Lp | 14.333 | 0,00 | 305 | -15,79 | ||||
| 2026-02-17 | 13F | CastleKnight Management LP | 468.300 | -4,80 | 9.951 | -19,72 | ||||
| 2026-01-22 | 13F | Red Tortoise LLC | 118 | 3 | ||||||
| 2026-02-06 | 13F | Pzena Investment Management Llc | 947.568 | -6,25 | 20.136 | -20,95 | ||||
| 2026-01-29 | 13F | Vanguard Group Inc | 1.526.957 | -28,70 | 32.448 | -39,88 | ||||
| 2026-02-17 | 13F | CWM Advisors, LLC | 22.027 | 20,77 | 468 | 1,96 | ||||
| 2026-02-09 | 13F | Hantz Financial Services, Inc. | 2.257 | 497,09 | 0 | |||||
| 2026-02-11 | 13F | Jpmorgan Chase & Co | 182.125 | -24,80 | 3.870 | -36,58 | ||||
| 2025-11-14 | 13F | Corton Capital Inc. | 0 | -100,00 | 0 | |||||
| 2026-02-11 | 13F | Ameritas Investment Partners, Inc. | 1.914 | 41 | ||||||
| 2026-02-17 | 13F | Gladstone Institutional Advisory LLC | 86.243 | 7,42 | 1.833 | -9,44 | ||||
| 2026-02-13 | 13F | Pinnacle Wealth Planning Services, Inc. | 66 | 1 | ||||||
| 2026-01-09 | 13F | SG Americas Securities, LLC | 12.123 | 116,95 | 0 | |||||
| 2026-02-17 | 13F | Boothbay Fund Management, Llc | 29.948 | 56,91 | 636 | 32,50 | ||||
| 2026-02-13 | 13F | First Trust Advisors Lp | 0 | -100,00 | 0 | |||||
| 2026-02-06 | 13F | Leonteq Securities AG | 4.159 | -1,47 | 88 | -16,98 | ||||
| 2025-11-14 | 13F | Manufacturers Life Insurance Company, The | 0 | -100,00 | 0 | |||||
| 2026-02-13 | 13F | Parkside Financial Bank & Trust | 50 | 100,00 | 1 | |||||
| 2026-02-17 | 13F | Cetera Investment Advisers | 30.078 | -25,14 | 639 | -36,86 | ||||
| 2026-02-13 | 13F | American Century Companies Inc | 46.962 | -24,47 | 998 | -36,33 | ||||
| 2026-02-17 | 13F | Capital Fund Management S.a. | Call | 0 | -100,00 | 0 | ||||
| 2026-02-10 | 13F | Nomura Asset Management Co Ltd | 0 | -100,00 | 0 | |||||
| 2026-02-17 | 13F | Jain Global LLC | 48.220 | 1.025 | ||||||
| 2026-02-06 | 13F | Covestor Ltd | 2 | 0,00 | 0 | |||||
| 2026-02-09 | 13F | Harbour Investments, Inc. | 0 | -100,00 | 0 | |||||
| 2026-02-10 | 13F | Acadian Asset Management Llc | 15.473 | 1.692,93 | 0 | |||||
| 2026-02-17 | 13F | Polymer Capital Management (US) LLC | 0 | -100,00 | 0 | |||||
| 2026-01-14 | 13F | Exchange Traded Concepts, Llc | 12.363 | 1,38 | 263 | -14,66 | ||||
| 2026-02-17 | 13F | Graham Capital Management, L.P. | 0 | -100,00 | 0 | |||||
| 2026-02-13 | 13F | Walleye Trading LLC | Put | 51.400 | 60,12 | 1.092 | 35,15 | |||
| 2026-02-13 | 13F | State Street Corp | 488.516 | -45,61 | 10.381 | -54,14 | ||||
| 2025-11-14 | 13F | Lazard Asset Management Llc | 0 | -100,00 | 0 | |||||
| 2026-01-08 | 13F | True Wealth Design, LLC | 0 | -100,00 | 0 | |||||
| 2026-01-12 | 13F | Abound Wealth Management | 0 | -100,00 | 0 | |||||
| 2026-02-13 | 13F | Walleye Trading LLC | Call | 29.600 | 33,33 | 629 | 12,52 | |||
| 2026-02-13 | 13F | Walleye Trading LLC | 29.333 | 623 | ||||||
| 2026-02-10 | 13F | Sittner & Nelson, Llc | 40 | 0,00 | 1 | -100,00 | ||||
| 2026-02-13 | 13F | Marshall Wace, Llp | 156.093 | 3.317 | ||||||
| 2026-01-30 | 13F | North Star Investment Management Corp. | 1 | 0,00 | 0 | |||||
| 2026-02-17 | 13F | Glenmede Trust Co Na | 0 | -100,00 | 0 | |||||
| 2026-02-10 | 13F | Bank of New York Mellon Corp | 81.026 | -50,00 | 1.722 | -57,86 | ||||
| 2026-02-13 | 13F | Wells Fargo & Company/mn | 137.344 | -22,47 | 2.919 | -34,63 | ||||
| 2025-11-14 | 13F | State Of Wisconsin Investment Board | 0 | -100,00 | 0 | |||||
| 2026-02-13 | 13F | Glen Eagle Advisors, LLC | 0 | -100,00 | 0 | |||||
| 2026-02-12 | 13F | Jane Street Group, Llc | Put | 0 | -100,00 | 0 | -100,00 | |||
| 2025-11-07 | 13F | Shell Asset Management Co | 883 | -62,39 | 0 | |||||
| 2026-02-17 | 13F | Creative Planning | 27.088 | -5,84 | 576 | -20,58 | ||||
| 2026-02-03 | 13F | SummerHaven Investment Management, LLC | 35.487 | 0,00 | 754 | -15,66 | ||||
| 2025-11-13 | 13F | Glenmede Investment Management, LP | 219.326 | -5,40 | 5.527 | -15,99 | ||||
| 2025-11-13 | 13F | Landscape Capital Management, L.l.c. | 0 | -100,00 | 0 | |||||
| 2026-01-27 | 13F | WealthCollab, LLC | 0 | -100,00 | 0 | |||||
| 2026-02-10 | 13F | Bnp Paribas Arbitrage, Sa | 16.772 | -0,02 | 356 | -15,64 | ||||
| 2025-11-14 | 13F | WealthTrak Capital Management LLC | 0 | -100,00 | 0 | |||||
| 2026-02-12 | 13F | CIBC Private Wealth Group, LLC | 0 | -100,00 | 0 | |||||
| 2026-02-12 | 13F | Principal Securities, Inc. | 0 | -100,00 | 0 | -100,00 | ||||
| 2026-02-17 | 13F | Aquatic Capital Management LLC | 18.549 | 394 | ||||||
| 2026-02-17 | 13F | ISAM Funds (UK) Ltd | 0 | -100,00 | 0 | |||||
| 2026-02-05 | 13F | Amalgamated Bank | 720 | -89,33 | 0 | |||||
| 2026-02-11 | 13F | Jpmorgan Chase & Co | Call | 0 | -100,00 | 0 | -100,00 | |||
| 2026-02-17 | 13F | Optiver Holding B.V. | 492 | 1.194,74 | 10 | |||||
| 2026-02-17 | 13F | Hancock Whitney Corp | 11.718 | -10,17 | 249 | -24,09 | ||||
| 2026-02-13 | 13F | Verition Fund Management LLC | 17.800 | -8,80 | 378 | -23,01 | ||||
| 2026-02-11 | 13F | LPL Financial LLC | 0 | -100,00 | 0 | |||||
| 2025-11-12 | 13F/A | Norges Bank | 0 | -100,00 | 0 | |||||
| 2026-02-03 | 13F | SBI Securities Co., Ltd. | 0 | -100,00 | 0 | |||||
| 2026-02-02 | 13F | Principal Financial Group Inc | 47.427 | -66,51 | 1.008 | -71,78 | ||||
| 2026-02-12 | 13F | Paradigm Capital Management Inc/ny | 564.200 | 11.989 | ||||||
| 2026-02-13 | 13F | Squarepoint Ops LLC | 148.390 | 492,56 | 3.153 | 399,68 | ||||
| 2025-11-14 | 13F | Point72 Asia (Singapore) Pte. Ltd. | 0 | -100,00 | 0 | |||||
| 2026-01-23 | 13F | Robeco Institutional Asset Management B.V. | 16.967 | 0,00 | 361 | -15,69 | ||||
| 2026-02-12 | 13F | Swiss National Bank | 0 | -100,00 | 0 | |||||
| 2026-02-10 | 13F | Axq Capital, Lp | 0 | -100,00 | 0 | |||||
| 2026-02-13 | 13F | Charles Schwab Investment Management Inc | 881.344 | 24,90 | 18.729 | 5,32 | ||||
| 2026-02-12 | 13F | Pinnacle Holdings, LLC | 67.986 | 1.445 | ||||||
| 2026-02-05 | 13F | Northwestern Mutual Wealth Management Co | 184 | 820,00 | 14 | |||||
| 2026-02-12 | 13F | Ankerstar Wealth, LLC | 7 | 0 | ||||||
| 2026-02-12 | 13F | Brown Brothers Harriman & Co | 110 | 2 | ||||||
| 2026-02-17 | 13F | Advisory Services Network, LLC | 0 | -100,00 | 0 | |||||
| 2026-02-13 | 13F | Jacobs Levy Equity Management, Inc | 249.642 | -30,60 | 5.305 | -41,48 | ||||
| 2026-01-08 | 13F | Versant Capital Management, Inc | 1.963 | 4.361,36 | 42 | 4.000,00 | ||||
| 2026-01-15 | 13F | Nisa Investment Advisors, Llc | 266 | -78,94 | 6 | -83,87 | ||||
| 2026-02-09 | 13F | MTM Investment Management, LLC | 200 | 0,00 | 4 | -20,00 | ||||
| 2026-01-20 | 13F | Harbor Capital Advisors, Inc. | 547 | -1,62 | 0 | |||||
| 2026-02-17 | 13F | Ancora Advisors, LLC | 1.090 | 23 | ||||||
| 2026-02-05 | 13F | Allworth Financial LP | 1.350 | 922,73 | 29 | 833,33 | ||||
| 2026-02-10 | 13F | Rothschild Investment Llc | 43 | 59,26 | 1 | |||||
| 2026-02-13 | 13F | Prudential Financial Inc | 45.283 | 48,00 | 962 | 24,77 | ||||
| 2026-02-02 | 13F | Fifth Third Bancorp | 394 | 58,23 | 8 | 33,33 | ||||
| 2026-02-17 | 13F | Ameriprise Financial Inc | 784.868 | 19,11 | 16.678 | 0,45 | ||||
| 2026-02-03 | 13F | Farmers & Merchants Investments Inc | 0 | -100,00 | 0 | |||||
| 2026-02-17 | 13F | Millennium Management Llc | Put | 0 | -100,00 | 0 | ||||
| 2026-02-11 | 13F | Cerity Partners LLC | 0 | -100,00 | 0 | |||||
| 2026-02-13 | 13F | Umb Bank N A/mo | 27 | -34,15 | 1 | -100,00 | ||||
| 2026-02-17 | 13F | Tudor Investment Corp Et Al | Put | 11.100 | 236 | |||||
| 2026-02-17 | 13F | Millennium Management Llc | 1.049.381 | 149,21 | 22.299 | 110,15 | ||||
| 2025-11-12 | 13F | Victory Capital Management Inc | 0 | -100,00 | 0 | |||||
| 2026-01-27 | 13F | GHP Investment Advisors, Inc. | 55 | 0,00 | 1 | 0,00 | ||||
| 2025-11-14 | 13F | QSV Equity Investors LLC | 0 | -100,00 | 0 | |||||
| 2025-11-10 | 13F | MAI Capital Management | 0 | -100,00 | 0 | -100,00 | ||||
| 2026-02-17 | 13F | Tudor Investment Corp Et Al | Call | 9.900 | 210 | |||||
| 2026-02-17 | 13F | Tudor Investment Corp Et Al | 31.258 | 664 | ||||||
| 2026-02-17 | 13F | Jump Financial, LLC | 41.857 | -48,97 | 889 | -56,99 | ||||
| 2026-02-11 | 13F | Parallel Advisors, LLC | 232 | 29,61 | 5 | 0,00 | ||||
| 2025-11-04 | 13F | Thrivent Financial For Lutherans | 0 | -100,00 | 0 | |||||
| 2026-02-13 | 13F | Sei Investments Co | 44.345 | 252,50 | 942 | 197,16 | ||||
| 2026-02-17 | 13F | Point72 Asset Management, L.P. | Put | 41.300 | 878 | |||||
| 2026-02-17 | 13F | Point72 Asset Management, L.P. | Call | 55.800 | 1.186 | |||||
| 2026-01-08 | 13F | Nordea Investment Management Ab | 0 | -100,00 | 0 | |||||
| 2026-02-17 | 13F | Point72 Asset Management, L.P. | 74.117 | 1.575 | ||||||
| 2026-02-10 | 13F | Envestnet Asset Management Inc | 164.964 | -15,69 | 3.505 | -28,90 | ||||
| 2026-02-13 | 13F | Seven Six Capital Management, LLC | 47.200 | -13,71 | 1.003 | -27,21 | ||||
| 2026-02-17 | 13F | Jones Financial Companies Lllp | 46 | -68,49 | 1 | -100,00 | ||||
| 2026-01-30 | 13F | New York State Teachers Retirement System | 0 | -100,00 | 0 | |||||
| 2026-02-13 | 13F/A | Ontario Teachers Pension Plan Board | 0 | -100,00 | 0 | |||||
| 2026-02-06 | 13F | Larson Financial Group LLC | 0 | -100,00 | 0 | |||||
| 2026-02-09 | 13F | Huntington National Bank | 77 | 755,56 | 2 | |||||
| 2026-01-30 | 13F | Us Bancorp \de\ | 7.072 | 28,72 | 150 | 8,70 | ||||
| 2026-02-06 | 13F | Pnc Financial Services Group, Inc. | 4.748 | -13,12 | 101 | -27,01 | ||||
| 2026-02-12 | 13F | Nuveen, LLC | 56.224 | -22,83 | 1.195 | -34,93 | ||||
| 2026-02-14 | 13F | Rockefeller Capital Management L.P. | 403 | 45,49 | 9 | 33,33 | ||||
| 2026-02-13 | 13F | Arrowstreet Capital, Limited Partnership | 16.408 | 349 | ||||||
| 2026-02-17 | 13F | Capital Fund Management S.a. | Put | 13.800 | -31,68 | 293 | -42,44 | |||
| 2026-02-13 | 13F | Walleye Capital LLC | Put | 79.700 | 41,06 | 1.694 | 18,97 | |||
| 2026-02-12 | 13F | Earnest Partners Llc | 262.634 | -15,73 | 5.581 | -28,95 | ||||
| 2026-02-13 | 13F | Walleye Capital LLC | 57.294 | 2.864.600,00 | 1.217 | |||||
| 2026-02-24 | 13F | Bell Investment Advisors, Inc | 5 | -83,87 | 0 | |||||
| 2026-01-08 | 13F | Tompkins Financial Corp | 41 | 1 | ||||||
| 2026-02-13 | 13F | Walleye Capital LLC | Call | 40.600 | -35,04 | 863 | -45,27 | |||
| 2026-01-28 | 13F | Klp Kapitalforvaltning As | 22.800 | 470,00 | 484 | 384,00 | ||||
| 2026-02-17 | 13F | Quantinno Capital Management LP | 37.086 | 788 | ||||||
| 2026-02-06 | 13F | Gsa Capital Partners Llp | 16.086 | 0 | ||||||
| 2026-02-12 | 13F | New York State Common Retirement Fund | 7.201 | 0,00 | 153 | -15,47 | ||||
| 2026-02-11 | 13F | Simplex Trading, Llc | Put | 17.700 | 73,53 | 376 | ||||
| 2026-02-17 | 13F | Advisor Group Holdings, Inc. | 312 | -79,32 | 7 | -84,21 | ||||
| 2025-11-06 | 13F | Illinois Municipal Retirement Fund | 0 | -100,00 | 0 | |||||
| 2026-02-17 | 13F | Royal Bank Of Canada | Put | 5.500 | 0,00 | 117 | -15,83 | |||
| 2026-02-17 | 13F | Royal Bank Of Canada | 7.318 | -92,37 | 155 | -93,58 | ||||
| 2026-02-11 | 13F | Simplex Trading, Llc | Call | 50.800 | 268,12 | 1.080 | ||||
| 2026-02-12 | 13F | Federated Hermes, Inc. | 273.893 | 46,35 | 5.820 | 23,41 | ||||
| 2026-02-12 | 13F | M&G Plc | 0 | -100,00 | 0 | |||||
| 2026-01-26 | 13F | Cwm, Llc | 2.842 | -36,69 | 0 | |||||
| 2026-02-17 | 13F | Northern Trust Corp | 190.313 | -16,09 | 4.044 | -29,24 | ||||
| 2026-02-17 | 13F | XTX Topco Ltd | 15.087 | 321 | ||||||
| 2026-02-17 | 13F | Public Employees Retirement System Of Ohio | 16.599 | -20,61 | 353 | -33,08 | ||||
| 2026-02-13 | 13F | Rubric Capital Management LP | 256.937 | 5.460 | ||||||
| 2026-02-17 | 13F | Aqr Capital Management Llc | 177.292 | -0,74 | 3.767 | -16,31 | ||||
| 2026-02-17 | 13F | Two Sigma Advisers, Lp | 95.900 | 2.038 | ||||||
| 2026-02-09 | 13F | Systematic Financial Management Lp | 381.645 | -0,64 | 8.110 | -16,22 | ||||
| 2026-02-06 | 13F | EverSource Wealth Advisors, LLC | 130 | -40,64 | 3 | -60,00 | ||||
| 2026-02-17 | 13F | Two Sigma Investments, Lp | 396.991 | 113,68 | 8.436 | 80,22 | ||||
| 2026-01-20 | 13F | Pflug Koory, LLC | 705 | 0,00 | 15 | -17,65 | ||||
| 2025-10-31 | 13F | Whittier Trust Co Of Nevada Inc | 0 | -100,00 | 0 | |||||
| 2025-10-17 | 13F | Private Wealth Management Group, LLC | 0 | -100,00 | 0 | |||||
| 2026-02-13 | 13F | Rhumbline Advisers | 30.999 | -58,43 | 659 | -64,98 | ||||
| 2026-02-13 | 13F | Caitong International Asset Management Co., Ltd | 633 | -0,31 | 13 | -18,75 | ||||
| 2026-02-02 | 13F | CX Institutional | 0 | -100,00 | 0 | |||||
| 2026-02-09 | 13F | Fisher Asset Management, LLC | 0 | -100,00 | 0 | |||||
| 2025-11-20 | 13F/A | BRYN MAWR TRUST Co | 0 | -100,00 | 0 | -100,00 | ||||
| 2026-02-12 | 13F | Counterpoint Mutual Funds LLC | 0 | -100,00 | 0 | -100,00 | ||||
| 2026-01-20 | 13F | Signaturefd, Llc | 3.829 | 47,78 | 81 | 24,62 | ||||
| 2026-01-28 | 13F | Salomon & Ludwin, LLC | 131 | 351,72 | 3 | |||||
| 2026-02-17 | 13F | MIRAE ASSET GLOBAL ETFS HOLDINGS Ltd. | 10.615 | -1,12 | 226 | -16,67 | ||||
| 2026-02-17 | 13F | Capital Fund Management S.a. | 94.744 | 105,22 | 2.013 | 73,09 | ||||
| 2026-01-12 | 13F | DAVENPORT & Co LLC | 9.450 | 201 | ||||||
| 2026-01-29 | 13F | Quent Capital, LLC | 32 | 433,33 | 1 | |||||
| 2026-02-13 | 13F | RWWM, Inc. | 632.140 | 22,70 | 13.433 | 3,47 | ||||
| 2026-02-17 | 13F | Clear Street Markets Llc | 688 | 15 | ||||||
| 2026-02-17 | 13F | Weiss Asset Management LP | 47.100 | 1.001 | ||||||
| 2026-01-16 | 13F | Louisiana State Employees Retirement System | 0 | -100,00 | 0 | |||||
| 2026-02-11 | 13F | IMA Wealth, Inc. | 986 | 2,39 | 21 | -16,67 | ||||
| 2026-02-17 | 13F | Wellington Management Group Llp | 756.909 | 1,30 | 16.084 | -14,58 | ||||
| 2025-11-14 | 13F | Raymond James Financial Inc | 0 | -100,00 | 0 | |||||
| 2026-01-29 | 13F | IMC-Chicago, LLC | 33.244 | 34,46 | 706 | 13,32 | ||||
| 2026-01-29 | 13F | IMC-Chicago, LLC | Put | 80.000 | 15,94 | 1.700 | -2,19 | |||
| 2026-02-06 | 13F | Empirical Asset Management, LLC | 20.544 | 13,76 | 437 | -4,18 | ||||
| 2026-01-29 | 13F | IMC-Chicago, LLC | Call | 76.500 | 195,37 | 1.626 | 149,23 | |||
| 2026-02-10 | 13F | Semanteon Capital Management, LP | 0 | -100,00 | 0 | |||||
| 2025-11-05 | 13F | SOUTH STATE Corp | 0 | -100,00 | 0 | |||||
| 2026-02-09 | 13F | Legal & General Group Plc | 2.130 | -96,45 | 45 | -97,03 | ||||
| 2026-02-13 | 13F | Smartleaf Asset Management LLC | 26 | 1 | ||||||
| 2026-02-13 | 13F | Sterling Capital Management LLC | 1.321 | -16,45 | 28 | -28,21 | ||||
| 2026-02-10 | 13F | Intech Investment Management Llc | 12.472 | -12,27 | 265 | -25,98 | ||||
| 2025-10-16 | 13F | Trust Co Of Toledo Na /oh/ | 0 | -100,00 | 0 | |||||
| 2026-02-11 | 13F | Deutsche Bank Ag\ | 21.340 | -3,96 | 453 | -18,96 | ||||
| 2026-02-17 | 13F | Tower Research Capital LLC (TRC) | 2.587 | 43,40 | 55 | 20,00 | ||||
| 2026-02-17 | 13F | D. E. Shaw & Co., Inc. | Put | 130.000 | -53,64 | 2.762 | -60,91 | |||
| 2026-01-29 | 13F | UBS Group AG | 616.992 | 385,97 | 13.111 | 309,85 | ||||
| 2026-02-17 | 13F | D. E. Shaw & Co., Inc. | 748.783 | -21,03 | 15.912 | -33,41 | ||||
| 2026-02-06 | 13F | Lsv Asset Management | 73.092 | -4,94 | 2 | 0,00 | ||||
| 2026-02-13 | 13F | Toroso Investments, LLC | 0 | -100,00 | 0 | |||||
| 2026-02-17 | 13F | Man Group plc | 24.842 | 528 | ||||||
| 2026-02-12 | 13F | BlackRock, Inc. | 1.761.306 | -48,81 | 37.428 | -56,84 | ||||
| 2026-02-13 | 13F | SRS Capital Advisors, Inc. | 347 | -58,49 | 7 | -66,67 | ||||
| 2026-02-11 | 13F | Prestige Wealth Management Group LLC | 28 | 0,00 | 1 | |||||
| 2025-11-14 | 13F | Axa S.a. | 0 | -100,00 | 0 | |||||
| 2026-02-02 | 13F | CM Management, LLC | 15.000 | 0,00 | 319 | -15,87 | ||||
| 2026-02-17 | 13F | Balyasny Asset Management Llc | 79.069 | 1.680 | ||||||
| 2026-02-10 | 13F | State of Wyoming | 0 | -100,00 | 0 | |||||
| 2026-02-04 | 13F | Oregon Public Employees Retirement Fund | 0 | -100,00 | 0 | |||||
| 2026-02-12 | 13F | Clark Estates Inc/ny | 34.200 | 0,00 | 727 | -15,68 | ||||
| 2026-01-16 | 13F | West Branch Capital LLC | 0 | -100,00 | 0 | -100,00 | ||||
| 2025-10-08 | 13F | Rise Advisors, LLC | 0 | -100,00 | 0 | |||||
| 2026-02-13 | 13F | Morgan Stanley | 374.573 | 16,28 | 7.960 | -1,95 | ||||
| 2026-01-23 | 13F | State of Alaska, Department of Revenue | 1.075 | -91,49 | 0 | |||||
| 2026-02-17 | 13F | Janus Henderson Group Plc | 0 | -100,00 | 0 | |||||
| 2026-02-13 | 13F | BNP Paribas Asset Management Holding S.A. | 54.617 | 19.546,40 | 1 | |||||
| 2026-02-17 | 13F | Hotchkis & Wiley Capital Management Llc | 392.665 | 16,13 | 8.344 | -2,08 | ||||
| 2025-11-14 | 13F | Voloridge Investment Management, Llc | 0 | -100,00 | 0 | |||||
| 2026-01-05 | 13F | GAMMA Investing LLC | 2.169 | -28,37 | 46 | -39,47 | ||||
| 2026-02-13 | 13F | Ubs Asset Management Americas Inc | 15 | -99,98 | 0 | -100,00 | ||||
| 2026-02-17 | 13F | Mork Capital Management, LLC | 40.000 | 0,00 | 850 | -15,67 | ||||
| 2026-01-15 | 13F | Fortitude Family Office, LLC | 53 | 1 | ||||||
| 2026-02-13 | 13F | Blueshift Asset Management, LLC | 16.510 | 351 | ||||||
| 2026-02-12 | 13F | Federation des caisses Desjardins du Quebec | 4.000 | 0,00 | 85 | -15,00 | ||||
| 2026-02-17 | 13F | Schonfeld Strategic Advisors LLC | 20.357 | 433 | ||||||
| 2026-02-13 | 13F | Barclays Plc | Put | 300.000 | 6.375 | |||||
| 2026-02-13 | 13F | Barclays Plc | Call | 18.700 | 0,00 | 397 | -15,71 | |||
| 2026-02-11 | 13F | Capital International Investors | 269.597 | 0,00 | 5.729 | -15,68 | ||||
| 2026-02-13 | 13F | Barclays Plc | 114.549 | 160,85 | 2.434 | -10,38 | ||||
| 2025-11-05 | 13F | Moloney Securities Asset Management, LLC | 44.450 | 1.120 | ||||||
| 2026-02-13 | 13F | Police & Firemen's Retirement System of New Jersey | 6.564 | 0,00 | 139 | -15,76 | ||||
| 2026-02-17 | 13F | Quadrature Capital Ltd | 0 | -100,00 | 0 | -100,00 | ||||
| 2026-02-24 | 13F | Villanova Investment Management Co LLC | 42.621 | -20,86 | 906 | -33,31 | ||||
| 2026-02-06 | 13F | Global Retirement Partners, LLC | 9 | -82,00 | 0 | -100,00 | ||||
| 2026-02-17 | 13F | Citadel Advisors Llc | Put | 152.800 | 10,72 | 3.247 | -6,61 | |||
| 2026-02-17 | 13F | Susquehanna Portfolio Strategies, LLC | 102.985 | 25,83 | 2.188 | 6,11 | ||||
| 2026-02-13 | 13F | Mariner, LLC | 0 | -100,00 | 0 | -100,00 | ||||
| 2026-02-19 | 13F | Invesco Ltd. | 112.491 | -35,87 | 2.390 | -45,93 | ||||
| 2026-02-17 | 13F | Citadel Advisors Llc | Call | 203.300 | 0,64 | 4.320 | -15,13 | |||
| 2026-02-17 | 13F | Citadel Advisors Llc | 223.520 | 502,30 | 4.750 | 407,91 | ||||
| 2026-02-13 | 13F | Public Employees Retirement Association Of Colorado | 2.662 | 0,00 | 0 | |||||
| 2026-02-11 | 13F | Empowered Funds, LLC | 6.964 | 148 | ||||||
| 2025-11-14 | 13F | Capstone Investment Advisors, Llc | 10.917 | 275 | ||||||
| 2025-11-14 | 13F | Qube Research & Technologies Ltd | 0 | -100,00 | 0 | |||||
| 2026-02-12 | 13F | Dimensional Fund Advisors Lp | 700.604 | -26,59 | 14.888 | -38,10 | ||||
| 2025-10-14 | 13F | Yousif Capital Management, Llc | 0 | -100,00 | 0 | |||||
| 2026-02-11 | 13F | Erste Asset Management GmbH | 0 | 0 | ||||||
| 2026-02-17 | 13F | Canada Pension Plan Investment Board | 3.800 | -38,71 | 81 | -48,72 | ||||
| 2026-01-29 | 13F | Teachers Retirement System Of The State Of Kentucky | 0 | -100,00 | 0 | |||||
| 2026-02-09 | 13F | Wellington Shields Capital Management, LLC | 11.800 | 0,00 | 251 | -15,82 | ||||
| 2026-01-15 | 13F | Allspring Global Investments Holdings, LLC | 0 | -100,00 | 0 | -100,00 | ||||
| 2026-02-13 | 13F | Bridgefront Capital, LLC | 32.394 | 688 | ||||||
| 2026-01-28 | 13F | WPG Advisers, LLC | 5 | 0,00 | 0 | |||||
| 2026-02-17 | 13F | Susquehanna Fundamental Investments, Llc | 0 | -100,00 | 0 | |||||
| 2026-02-13 | 13F | Citigroup Inc | 32.367 | 35,98 | 688 | 14,69 | ||||
| 2026-01-26 | 13F | Asset Dedication, LLC | 12 | 0,00 | 0 | |||||
| 2026-02-12 | 13F | Campbell & CO Investment Adviser LLC | 94.883 | 2.016 | ||||||
| 2026-02-05 | 13F | Bessemer Group Inc | 59 | 0 | ||||||
| 2025-11-14 | 13F | ExodusPoint Capital Management, LP | 13.616 | 343 | ||||||
| 2026-02-04 | 13F | Pacer Advisors, Inc. | 0 | -100,00 | 0 | |||||
| 2026-02-10 | 13F | Quantbot Technologies LP | 32.587 | 102,79 | 692 | 71,29 | ||||
| 2026-02-09 | 13F | Hartland & Co., LLC | 0 | -100,00 | 0 | |||||
| 2025-11-14 | 13F | Texas Permanent School Fund | 0 | -100,00 | 0 | |||||
| 2026-02-17 | 13F | Bayesian Capital Management, LP | 0 | -100,00 | 0 | |||||
| 2026-02-11 | 13F | Cedar Mountain Advisors, LLC | 19 | -57,78 | 0 | -100,00 | ||||
| 2026-02-12 | 13F | Skopos Labs, Inc. | 35.796 | 755 | ||||||
| 2026-02-13 | 13F | Peak6 Llc | Put | 11.600 | -84,04 | 246 | -86,57 | |||
| 2026-02-13 | 13F | Peak6 Llc | 10.058 | -66,91 | 214 | -72,16 | ||||
| 2026-02-17 | 13F | Alliancebernstein L.p. | 13.946 | -40,45 | 296 | -49,83 | ||||
| 2026-02-13 | 13F | Peak6 Llc | Call | 5.700 | -53,66 | 121 | -60,84 | |||
| 2026-02-12 | 13F | MetLife Investment Management, LLC | 13.531 | 0,00 | 288 | -15,59 | ||||
| 2026-02-17 | 13F | Susquehanna International Group, Llp | 68.101 | 59,33 | 1.447 | 34,35 | ||||
| 2026-02-13 | 13F | Quarry LP | 121 | 505,00 | 3 | |||||
| 2026-02-17 | 13F | Susquehanna International Group, Llp | Put | 100.500 | -49,42 | 2.136 | -57,36 | |||
| 2026-02-17 | 13F | Susquehanna International Group, Llp | Call | 128.700 | 7,70 | 2.735 | -9,20 | |||
| 2025-11-05 | 13F | Savant Capital, LLC | 0 | -100,00 | 0 | -100,00 | ||||
| 2026-02-11 | 13F | Los Angeles Capital Management Llc | 127 | 2 | ||||||
| 2026-02-10 | 13F | Hazlett, Burt & Watson, Inc. | 1.540 | 0,00 | 0 | |||||
| 2026-01-07 | 13F | Massmutual Trust Co Fsb/adv | 0 | -100,00 | 0 | |||||
| 2026-02-11 | 13F | Gilpin Wealth Management, Llc | 2 | 0 | ||||||
| 2026-02-12 | 13F | Ensign Peak Advisors, Inc | 0 | -100,00 | 0 | |||||
| 2026-02-17 | 13F | Russell Investments Group, Ltd. | 57.188 | 0,23 | 1.215 | -15,45 | ||||
| 2026-02-12 | 13F | Jane Street Group, Llc | Call | 120.900 | 214,03 | 2.569 | 164,85 | |||
| 2026-02-02 | 13F | Strs Ohio | 4.400 | 94 | ||||||
| 2026-02-12 | 13F | Jane Street Group, Llc | 288.940 | 1.781,36 | 6.140 | 1.486,30 | ||||
| 2026-02-18 | 13F | State of Tennessee, Treasury Department | 4.773 | -67,91 | 79 | -78,88 | ||||
| 2025-11-14 | 13F | Wolverine Trading, Llc | 13.081 | -34,63 | 337 | -40,74 | ||||
| 2025-11-14 | 13F | Wolverine Trading, Llc | Call | 34.200 | 77,20 | 880 | 60,99 | |||
| 2025-11-14 | 13F | Wolverine Trading, Llc | Put | 94.100 | 49,60 | 2.421 | 35,86 |
Other Listings
| DE:HT2 | 11,30 € |