Grundlæggende statistik
| Institutionelle ejere | 219 total, 218 long only, 0 short only, 1 long/short - change of 24,57% MRQ |
| Gennemsnitlig porteføljeallokering | 0.3624 % - change of 3,45% MRQ |
| Institutionelle aktier (lange) | 17.251.786 (ex 13D/G) - change of 2,94MM shares 20,59% MRQ |
| Institutionel værdi (lang) | $ 903.109 USD ($1000) |
Institutionelt ejerskab og aktionærer
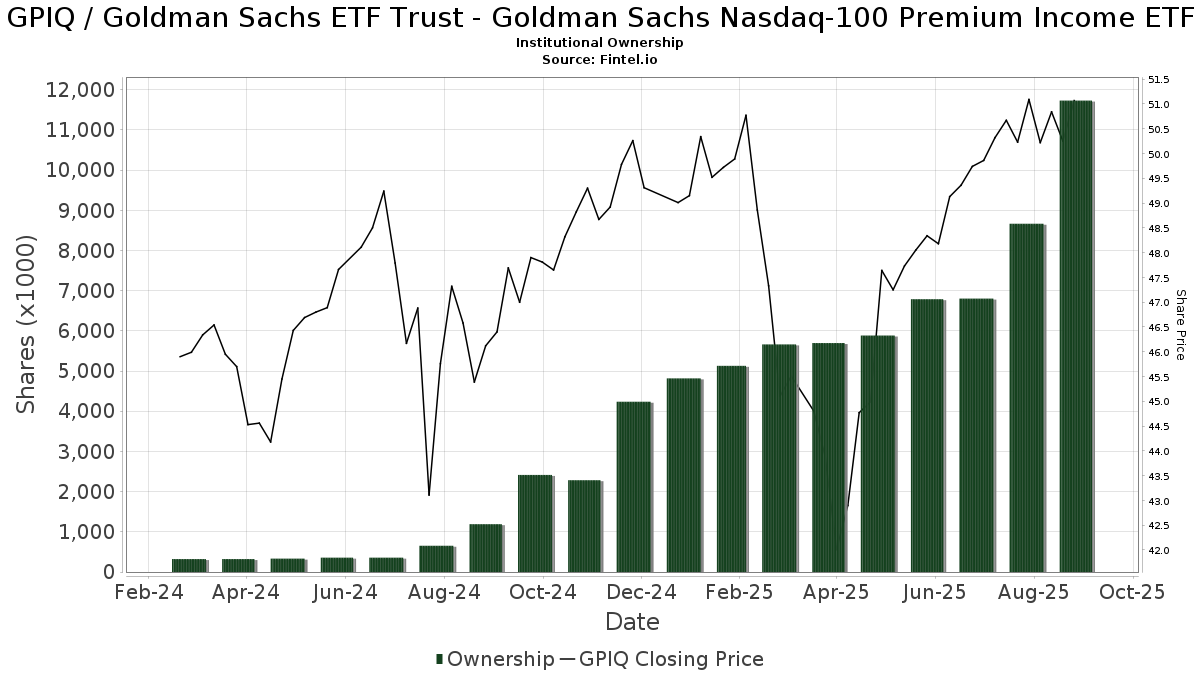
Goldman Sachs ETF Trust - Goldman Sachs Nasdaq-100 Premium Income ETF (US:GPIQ) har 219 institutionelle ejere og aktionærer, der har indsendt 13D/G- eller 13F-formularer til Securities Exchange Commission (SEC). Disse institutioner har i alt 17,251,786 aktier. Største aktionærer omfatter LPL Financial LLC, Bank Of America Corp /de/, Goldman Sachs Group Inc, Requisite Capital Management, LLC, HighTower Advisors, LLC, Cerity Partners LLC, Wealth Enhancement Advisory Services, Llc, Royal Bank Of Canada, Wells Fargo & Company/mn, and GGM Financials LLC .
Goldman Sachs ETF Trust - Goldman Sachs Nasdaq-100 Premium Income ETF (NasdaqGM:GPIQ) institutionel ejerskabsstruktur viser aktuelle positioner i virksomheden efter institutioner og fonde, samt seneste ændringer i positionsstørrelse. Større aktionærer kan omfatte individuelle investorer, investeringsforeninger, hedgefonde eller institutioner. Skema 13D angiver, at investoren besidder (eller besidder) mere end 5 % af virksomheden og har til hensigt (eller har til hensigt at) aktivt at forfølge en ændring i forretningsstrategi. Skema 13G indikerer en passiv investering på over 5%.
The share price as of April 24, 2026 is 55,03 / share. Previously, on April 28, 2025, the share price was 44,49 / share. This represents an increase of 23,69% over that period.
Fondens stemningsscore
Fund Sentiment Score (fka Ownership Accumulation Score) finder de aktier, der bliver mest købt af fonde. Det er resultatet af en sofistikeret, multi-faktor kvantitativ model, der identificerer virksomheder med de højeste niveauer af institutionel akkumulering. Scoringsmodellen bruger en kombination af den samlede stigning i oplyste ejere, ændringerne i porteføljeallokeringer i disse ejere og andre målinger. Tallet går fra 0 til 100, hvor højere tal indikerer et højere niveau af akkumulering for sine jævnaldrende, og 50 er gennemsnittet.
Opdateringsfrekvens: Dagligt
Se Ownership Explorer, som giver en liste over højest rangerende virksomheder.
AI+ Ask Fintel’s AI assistant about Goldman Sachs ETF Trust - Goldman Sachs Nasdaq-100 Premium Income ETF.
Select a question to share a public post with an AI-crafted answer.
Thinking of good questions…
Institutionel Put/Call-forhold
Ud over at indberette standardaktie- og gældsudstedelser skal institutter med mere end 100 mill. aktiver under forvaltning også oplyse deres put- og call-optionsbeholdninger. Da salgsoptioner generelt indikerer negativ stemning, og købsoptioner indikerer positiv stemning, kan vi få en fornemmelse af den overordnede institutionelle stemning ved at plotte forholdet mellem put og kald. Diagrammet til højre viser det historiske put/call-forhold for dette instrument.
Brug af Put/Call Ratio som en indikator for investorernes stemning overvinder en af de vigtigste mangler ved at bruge totalt institutionelt ejerskab, som er, at en betydelig mængde af aktiver under forvaltning investeres passivt for at spore indekser. Passivt forvaltede fonde køber typisk ikke optioner, så indikatoren for put/call-forholdet følger mere nøje følelsen af aktivt forvaltede fonde.

13F og NPORT arkivering
Detaljer om 13F-arkivering er gratis. Detaljer om NP-ansøgninger kræver et premium-medlemskab. Grønne rækker angiver nye positioner. Røde rækker angiver lukkede positioner. Klik på linket ikon for at se den fulde transaktionshistorik.
Opgrader
for at låse premium-data op og eksportere til Excel ![]() .
.
| Fil dato | Kilde | Investor | Type | Gennemsnitlig pris (Øst) |
Aktier | Δ Aktier (%) |
Rapporteret Værdi ($1000) |
Δ Værdi (%) |
Port Alloc (%) |
|
|---|---|---|---|---|---|---|---|---|---|---|
| 2026-02-17 | 13F | Regal Investment Advisors LLC | 34.353 | 7,54 | 1.816 | 8,42 | ||||
| 2026-02-10 | 13F | Rothschild Investment Llc | 200 | 0,00 | 11 | 0,00 | ||||
| 2026-01-12 | 13F | Daymark Wealth Partners, Llc | 11.882 | 0,50 | 628 | 1,29 | ||||
| 2026-02-04 | 13F | Advisor OS, LLC | 117.686 | 13,02 | 6.222 | 13,91 | ||||
| 2026-02-13 | 13F | Mml Investors Services, Llc | 12.327 | 15,45 | 652 | 16,25 | ||||
| 2026-01-09 | 13F | Dynamic Advisor Solutions LLC | 0 | -100,00 | 0 | |||||
| 2026-01-29 | 13F | Comerica Bank | 4.513 | 133,23 | 239 | 135,64 | ||||
| 2026-02-12 | 13F | Mark Sheptoff Financial Planning, Llc | 100 | 5 | ||||||
| 2025-10-30 | 13F | Twin Peaks Wealth Advisors, LLC | 0 | -100,00 | 0 | |||||
| 2026-04-07 | 13F | U.S. Capital Wealth Advisors, LLC | 12.751 | 23,07 | 631 | 15,36 | ||||
| 2026-04-15 | 13F | Regatta Capital Group, Llc | 20.275 | 25,48 | 1.003 | 17,45 | ||||
| 2026-01-29 | 13F | Dunhill Financial, LLC | 110 | 0,00 | 6 | 0,00 | ||||
| 2026-02-02 | 13F | Truist Financial Corp | 171.363 | 57,39 | 9.060 | 58,62 | ||||
| 2026-04-23 | 13F | Forum Financial Management, LP | 0 | -100,00 | 0 | |||||
| 2026-04-22 | 13F | Patriot Financial Group Insurance Agency, LLC | 4.306 | 213 | ||||||
| 2026-02-02 | 13F | Ellis Investment Partners, LLC | 139.477 | 325,08 | 7.374 | 328,47 | ||||
| 2026-01-15 | 13F | Guided Capital Wealth Management, LLC | 13.022 | 688 | ||||||
| 2026-01-28 | 13F | Geneos Wealth Management Inc. | 4.715 | 1.420,97 | 249 | 1.456,25 | ||||
| 2026-02-14 | 13F | Whipplewood Advisors, LLC | 300 | 0,00 | 16 | 0,00 | ||||
| 2026-04-24 | 13F | Cannon Advisors, Inc. | 61.857 | 1,69 | 3.061 | -4,85 | ||||
| 2026-04-15 | 13F | Capital Advisory Group Advisory Services, LLC | 0 | -100,00 | 0 | |||||
| 2026-02-12 | 13F | BlackRock, Inc. | 0 | -100,00 | 0 | |||||
| 2026-04-21 | 13F | Gilpin Wealth Management, Llc | 2.399 | 302,52 | 119 | 280,65 | ||||
| 2026-01-27 | 13F | Duncker Streett & Co Inc | 200 | 0,00 | 11 | 0,00 | ||||
| 2026-02-17 | 13F | Wiley Bros.-aintree Capital, Llc | 92.611 | 3,05 | 4.896 | 3,84 | ||||
| 2026-02-05 | 13F | Bessemer Group Inc | 200 | 0 | ||||||
| 2026-01-21 | 13F | Capital Investment Advisory Services, LLC | 24.107 | 191,82 | 1.275 | 194,23 | ||||
| 2026-04-08 | 13F | Wealth Enhancement Advisory Services, Llc | 499.826 | -21,80 | 24.831 | -26,81 | ||||
| 2026-04-02 | 13F | Aspect Partners, LLC | 10 | 0 | ||||||
| 2026-02-10 | 13F | Tandem Financial, LLC | 0 | -100,00 | 0 | |||||
| 2026-02-13 | 13F | Beacon Financial Advisory LLC | 29.951 | 56,83 | 1.584 | 58,14 | ||||
| 2026-02-17 | 13F | Raymond James Financial Inc | 167.319 | 110,35 | 8.846 | 112,03 | ||||
| 2026-04-21 | 13F | Mayfair Advisory Group, LLC | 20.025 | 42,53 | 991 | 35,01 | ||||
| 2026-02-12 | 13F | Principal Securities, Inc. | 0 | -100,00 | 0 | -100,00 | ||||
| 2026-02-05 | 13F | Panoramic Investment Advisors, Llc | 11.482 | 607 | ||||||
| 2026-02-11 | 13F | Eldridge Investment Advisors, Inc. | 6.077 | 9,95 | 321 | 11,85 | ||||
| 2026-02-17 | 13F | Abel Hall, LLC | 4.000 | 211 | ||||||
| 2026-04-21 | 13F | GHP Investment Advisors, Inc. | 173 | 246,00 | 9 | 300,00 | ||||
| 2026-02-11 | 13F | Tradition Wealth Management, LLC | 51.665 | 2.732 | ||||||
| 2026-02-10 | 13F | Thoroughbred Financial Services, Llc | 5.157 | -33,52 | 0 | |||||
| 2026-01-21 | 13F | Townsend Asset Management Corp /nc/ /adv | 17.311 | 915 | ||||||
| 2026-01-26 | 13F | Private Trust Co Na | 9.033 | 13,15 | 478 | 14,11 | ||||
| 2026-02-12 | 13F | Wealthspire Advisors, LLC | 0 | -100,00 | 0 | |||||
| 2026-04-17 | 13F | PMG Family Office LLC | 19.101 | 97,81 | 945 | 85,29 | ||||
| 2026-04-23 | 13F | Oppenheimer & Co Inc | 4.380 | -28,14 | 217 | -32,92 | ||||
| 2026-02-17 | 13F | Equitable Holdings, Inc. | 146.550 | 16,83 | 7.748 | 17,75 | ||||
| 2026-02-04 | 13F | Bridgewealth Advisory Group, LLC | 38.651 | 2.043 | ||||||
| 2026-02-12 | 13F | Steward Partners Investment Advisory, Llc | 8.310 | 26,72 | 439 | 27,62 | ||||
| 2026-02-10 | 13F | Avestar Capital, LLC | 43.919 | 2.302 | ||||||
| 2026-04-23 | 13F | Accurate Wealth Management, LLC | 4.447 | 0,00 | 229 | -3,38 | ||||
| 2026-02-13 | 13F | Graney & King, LLC | 24.298 | 3,63 | 1.285 | 4,48 | ||||
| 2026-01-29 | 13F | UBS Group AG | 252.761 | 310,56 | 13.363 | 313,84 | ||||
| 2026-02-03 | 13F | We Are One Seven, LLC | 171.279 | -7,50 | 9.056 | -6,77 | ||||
| 2026-02-20 | 13F | Sunbelt Securities, Inc. | 35.060 | 67,21 | 1.854 | 68,61 | ||||
| 2026-02-09 | 13F | Hantz Financial Services, Inc. | 56 | 0,00 | 0 | |||||
| 2026-02-14 | 13F | Berkshire Asset Management Llc/pa | 9.787 | 517 | ||||||
| 2026-02-06 | 13F | Pnc Financial Services Group, Inc. | 660 | 131,58 | 35 | 142,86 | ||||
| 2026-04-14 | 13F | Cathy Pareto & Associates, Inc | 4.887 | 2,09 | 242 | -4,74 | ||||
| 2026-04-20 | 13F | Kestra Private Wealth Services, Llc | 40.611 | -4,78 | 2.010 | -10,87 | ||||
| 2026-02-11 | 13F | Atlanta Consulting Group Advisors, LLC | 4.807 | 0,00 | 254 | 0,79 | ||||
| 2026-02-13 | 13F | Mariner, LLC | 40.522 | 91,11 | 2.142 | 92,63 | ||||
| 2026-04-24 | 13F | UMA Financial Services, Inc. | 202 | -46,13 | 10 | -52,63 | ||||
| 2026-02-05 | 13F | RiverFront Investment Group, LLC | 51.445 | -11,82 | 2.720 | -11,14 | ||||
| 2026-02-11 | 13F | Invst, LLC | 15.605 | 55,21 | 825 | 56,55 | ||||
| 2026-02-13 | 13F | Centaurus Financial, Inc. | 3.500 | 0,00 | 0 | |||||
| 2026-02-17 | 13F | Synergy Financial Group, LTD | 13.212 | -20,16 | 699 | -19,59 | ||||
| 2025-11-13 | 13F | Quadrature Capital Ltd | 0 | -100,00 | 0 | -100,00 | ||||
| 2026-02-11 | 13F | Cerity Partners LLC | 624.222 | 33.003 | ||||||
| 2026-02-12 | 13F | Commonwealth Equity Services, Llc | 298.753 | 122,48 | 15.795 | 225.542,86 | ||||
| 2026-01-27 | 13F | Latitude Advisors, LLC | 7.760 | 38,42 | 410 | 39,46 | ||||
| 2026-04-07 | 13F | Farther Finance Advisors, LLC | 118.976 | 187,20 | 5.900 | 169,41 | ||||
| 2026-04-08 | 13F | Doliver Advisors, Lp | 15.750 | 779 | ||||||
| 2026-02-10 | 13F | Goldman Sachs Group Inc | 1.744.267 | -5,75 | 92.219 | -5,01 | ||||
| 2026-04-27 | 13F | Sound Income Strategies, LLC | 433 | 21 | ||||||
| 2026-02-17 | 13F | TCG Advisory Services, LLC | 33.286 | 1.760 | ||||||
| 2026-02-04 | 13F | GGM Financials LLC | 377.794 | 3,91 | 19.974 | 4,72 | ||||
| 2026-02-05 | 13F | Western Wealth Management, LLC | 16.030 | 848 | ||||||
| 2026-02-11 | 13F | Capital Analysts, Inc. | 24.728 | 9,41 | 1 | 0,00 | ||||
| 2026-02-18 | 13F | EP Wealth Advisors, Inc. | 181.498 | 11,25 | 9.596 | 18,08 | ||||
| 2026-02-17 | 13F | Bank Of America Corp /de/ | 1.764.933 | 39,98 | 93.312 | 41,08 | ||||
| 2026-04-14 | 13F | Nbc Securities, Inc. | 34.315 | 1.978,44 | 1.698 | 1.851,72 | ||||
| 2026-02-13 | 13F | Morgan Stanley | 2.223 | 3,83 | 118 | 4,46 | ||||
| 2026-02-09 | 13F | Investors Portfolio Services LLC | 2.366 | 125 | ||||||
| 2026-02-11 | 13F | LPL Financial LLC | 1.880.169 | 35,31 | 99.405 | 36,37 | ||||
| 2026-02-17 | 13F | Cetera Investment Advisers | 83.915 | 129,25 | 4.437 | 131,04 | ||||
| 2026-02-17 | 13F | Advisor Group Holdings, Inc. | 189.189 | 95,79 | 10.003 | 99,92 | ||||
| 2026-02-13 | 13F | Intrepid Financial Planning Group LLC | 8.163 | 83,11 | 432 | 84,98 | ||||
| 2026-02-10 | 13F | Bank of New York Mellon Corp | 9.763 | 34,22 | 516 | 35,43 | ||||
| 2026-02-12 | 13F | Great Valley Advisor Group, Inc. | 13.757 | -8,26 | 728 | -7,51 | ||||
| 2026-01-12 | 13F | Canvas Wealth Advisors, LLC | 4.300 | 1,18 | 227 | 2,71 | ||||
| 2026-02-17 | 13F | Evergreen Wealth Solutions, LLC | 17.450 | -1,41 | 923 | -0,65 | ||||
| 2026-01-30 | 13F | Sigma Planning Corp | 4.090 | 216 | ||||||
| 2026-02-06 | 13F | Mjp Associates Inc /adv | 117.686 | 20,35 | 6.222 | 21,31 | ||||
| 2026-02-02 | 13F | Benjamin Edwards Inc | 6.400 | 338 | ||||||
| 2026-02-04 | 13F | Meridian Wealth Management, LLC | 24.535 | 30,48 | 1.297 | 31,54 | ||||
| 2026-02-11 | 13F | Winnow Wealth Llc | 26.309 | 37,02 | 1.394 | 37,07 | ||||
| 2026-02-02 | 13F | Chung Wu Investment Group, LLC | 0 | -100,00 | 0 | |||||
| 2026-01-27 | 13F | Berger Financial Group, Inc | 14.450 | 0,00 | 764 | 0,66 | ||||
| 2026-02-19 | 13F | CI Private Wealth, LLC | 6.050 | 320 | ||||||
| 2026-04-06 | 13F | CX Institutional | 0 | -100,00 | 0 | |||||
| 2026-02-17 | 13F | Advisory Services Network, LLC | 0 | -100,00 | 0 | |||||
| 2026-01-23 | 13F | Assetmark, Inc | 116 | 6 | ||||||
| 2026-02-13 | 13F | Jacobi Capital Management LLC | 4.344 | 11,87 | 230 | 12,81 | ||||
| 2026-04-15 | 13F | Milestone Asset Management, Llc | 6.257 | 310 | ||||||
| 2026-01-29 | 13F | Golden State Equity Partners | 12.460 | 53,83 | 659 | 55,19 | ||||
| 2026-04-16 | 13F | Beese Fulmer Investment Management, Inc. | 7.531 | 373 | ||||||
| 2026-04-08 | 13F | Significant Wealth Partners LLC | 123.607 | 17,77 | 6.117 | 10,24 | ||||
| 2026-01-21 | 13F | Newbridge Financial Services Group, Inc. | 19.203 | 119,94 | 1.015 | 121,62 | ||||
| 2026-04-24 | 13F | FRG Family Wealth Advisors LLC | 58.750 | 2.908 | ||||||
| 2025-11-14 | 13F | Fort Point Capital Partners LLC | 0 | -100,00 | 0 | |||||
| 2026-04-24 | 13F | Clarity Wealth Advisors, LLC | 4.800 | 238 | ||||||
| 2026-02-02 | 13F | Avidian Wealth Solutions, LLC | 14.387 | 0,00 | 761 | 0,80 | ||||
| 2026-02-02 | 13F | Fifth Third Bancorp | 535 | 28 | ||||||
| 2026-04-20 | 13F | Inscription Capital, LLC | 21.610 | 1.070 | ||||||
| 2026-01-26 | 13F | Childress Capital Advisors, Llc | 25.617 | -15,22 | 1.354 | -14,57 | ||||
| 2026-04-14 | 13F | Thurston, Springer, Miller, Herd & Titak, Inc. | 0 | -100,00 | 0 | |||||
| 2026-02-10 | 13F | Private Wealth Asset Management, LLC | 1.045 | 55 | ||||||
| 2026-01-30 | 13F | Delta Investment Management, LLC | 85.270 | -0,57 | 4.508 | 0,22 | ||||
| 2026-02-03 | 13F | Patten & Patten Inc/tn | 245.344 | 8,23 | 12.971 | 9,07 | ||||
| 2026-02-04 | 13F | CAP Partners, LLC | 13.767 | 65,29 | 728 | 66,74 | ||||
| 2026-04-21 | 13F | Avaii Wealth Management, Llc | 6.079 | -0,75 | 301 | -7,12 | ||||
| 2026-04-07 | 13F | CoreCap Advisors, LLC | 30.895 | 60,05 | 1.529 | 49,80 | ||||
| 2026-04-22 | 13F | Spire Wealth Management | 17.447 | -7,76 | 863 | -13,70 | ||||
| 2026-04-20 | 13F | CWA Asset Management Group, LLC | 11.974 | 2,68 | 593 | -3,90 | ||||
| 2026-02-10 | 13F | Envestnet Asset Management Inc | 176.975 | 56,47 | 9.357 | 57,69 | ||||
| 2026-01-23 | 13F | Steigerwald, Gordon & Koch Inc. | 375 | 0,00 | 20 | 0,00 | ||||
| 2026-02-13 | 13F | Wells Fargo & Company/mn | 388.576 | 288,08 | 20.544 | 291,17 | ||||
| 2026-01-29 | 13F | Camelot Portfolios, LLC | 920 | 49 | ||||||
| 2026-01-28 | 13F | Joseph P. Lucia & Associates, LLC | 8.068 | 427 | ||||||
| 2026-02-11 | 13F | Manchester Capital Management LLC | 4.836 | 256 | ||||||
| 2026-04-10 | 13F | Perigon Wealth Management, LLC | 10.507 | 10,31 | 520 | 3,38 | ||||
| 2026-04-14 | 13F | Meadowbrook Wealth Management, LLC | 21.353 | 8,82 | 1.057 | 1,83 | ||||
| 2026-01-26 | 13F | Cwm, Llc | 2.575 | 0 | ||||||
| 2026-02-04 | 13F | Atlantic Union Bankshares Corp | 212 | 11 | ||||||
| 2026-02-12 | 13F | Founders Financial Alliance, LLC | 5.313 | 69,85 | 281 | 70,73 | ||||
| 2026-04-15 | 13F | DAVENPORT & Co LLC | 13.879 | 16,62 | 687 | 9,06 | ||||
| 2026-01-12 | 13F | World Equity Group, Inc. | 4.072 | 215 | ||||||
| 2026-02-13 | 13F | Vienna Asset Management LLC | 4.315 | -9,60 | 228 | -8,80 | ||||
| 2026-02-17 | 13F | Citadel Advisors Llc | Put | 17.100 | 58,33 | 904 | 59,72 | |||
| 2026-02-17 | 13F | Citadel Advisors Llc | Call | 23.600 | 116,51 | 1.248 | 118,39 | |||
| 2026-02-11 | 13F | Jpmorgan Chase & Co | 70 | 4 | ||||||
| 2026-02-17 | 13F | Main Street Financial Solutions, LLC | 0 | -100,00 | 0 | |||||
| 2026-01-26 | 13F | Prosperity Financial Group, Inc. | 17.066 | -3,85 | 902 | -3,11 | ||||
| 2026-02-17 | 13F | Modern Wealth Management, LLC | 53.485 | 2.828 | ||||||
| 2026-04-10 | 13F | Magnus Financial Group LLC | 0 | -100,00 | 0 | |||||
| 2026-02-09 | 13F | Kingsview Wealth Management, LLC | 16.956 | 226,45 | 896 | 229,41 | ||||
| 2026-02-18 | 13F | GWM Advisors LLC | 0 | -100,00 | 0 | |||||
| 2026-02-06 | 13F | Rps Advisory Solutions Llc | 16.943 | 896 | ||||||
| 2026-02-12 | 13F | Renaissance Technologies Llc | 59.800 | -2,61 | 3.162 | -1,86 | ||||
| 2026-01-21 | 13F | Naviter Wealth, LLC | 0 | -100,00 | 0 | |||||
| 2026-02-05 | 13F | Mason & Associates Inc | 105.273 | 2,65 | 5.566 | 3,44 | ||||
| 2026-01-20 | 13F | Stratos Wealth Partners, LTD. | 50.964 | 59,98 | 2.694 | 61,22 | ||||
| 2026-04-22 | 13F | Kennedy Investment Group | 30.880 | 24,58 | 1.528 | 16,64 | ||||
| 2026-02-12 | 13F | Jane Street Group, Llc | 0 | -100,00 | 0 | |||||
| 2026-02-03 | 13F | International Assets Investment Management, Llc | 1.050 | 56 | ||||||
| 2026-02-12 | 13F | CIBC Private Wealth Group, LLC | 2.845 | 150 | ||||||
| 2026-01-28 | 13F | Cornerstone Advisory, LLC | 49.653 | 22,36 | 2.625 | 23,36 | ||||
| 2025-10-27 | 13F | Belvedere Trading LLC | Put | 0 | -100,00 | 0 | ||||
| 2025-10-27 | 13F | Belvedere Trading LLC | Call | 0 | -100,00 | 0 | ||||
| 2026-01-29 | 13F | Sanctuary Advisors, LLC | 11.536 | 2,94 | 610 | 3,75 | ||||
| 2026-02-06 | 13F | CFO4Life Group, LLC | 8.879 | 0,35 | 469 | 1,08 | ||||
| 2026-02-09 | 13F | Cary Street Partners Financial Llc | 18.171 | 120,63 | 961 | 122,22 | ||||
| 2026-04-24 | 13F | Root Financial Partners, LLC | 267 | 13 | ||||||
| 2026-01-14 | 13F | Kraft, Davis & Associates, LLC | 60.689 | 35,98 | 3.235 | 38,13 | ||||
| 2026-02-11 | 13F | M Holdings Securities, Inc. | 45.672 | 2 | ||||||
| 2026-04-08 | 13F | M.e. Allison & Co., Inc. | 7.300 | 0,00 | 361 | -6,23 | ||||
| 2026-01-26 | 13F | AE Wealth Management LLC | 1.236 | 65 | ||||||
| 2026-04-21 | 13F | Wedbush Securities Inc | 6.290 | 0 | ||||||
| 2026-04-21 | 13F | Quad-Cities Investment Group, LLC | 7.687 | 9,04 | 380 | 2,15 | ||||
| 2026-02-05 | 13F | Requisite Capital Management, LLC | 1.558.394 | 2,87 | 82.392 | 3,67 | ||||
| 2026-02-10 | 13F | Moors & Cabot, Inc. | 4.942 | 261 | ||||||
| 2026-01-30 | 13F | Strategic Blueprint, LLC | 29.396 | 111,86 | 1.554 | 113,76 | ||||
| 2026-02-05 | 13F | Cambridge Investment Research Advisors, Inc. | 32.164 | 12,12 | 2 | 0,00 | ||||
| 2026-04-14 | 13F | Wealthcare Advisory Partners LLC | 8.208 | 61,13 | 406 | 50,93 | ||||
| 2026-02-12 | 13F | Quadrant Capital Group Llc | 0 | -100,00 | 0 | |||||
| 2026-01-26 | 13F | PFG Investments, LLC | 31.474 | 118,36 | 1.664 | 120,11 | ||||
| 2026-01-27 | 13F | Private Wealth Partners, LLC | 41.550 | 37,36 | 2.197 | 38,46 | ||||
| 2026-02-11 | 13F | Mirae Asset Securities (usa) Inc. | 210.000 | 40,00 | 11.103 | 41,09 | ||||
| 2026-01-20 | 13F | Ethos Financial Group, LLC | 52.612 | -60,64 | 2.782 | -60,33 | ||||
| 2026-01-20 | 13F | Whalen Wealth Management Inc. | 0 | -100,00 | 0 | |||||
| 2026-02-06 | 13F | Larson Financial Group LLC | 266 | 2,70 | 14 | 7,69 | ||||
| 2026-04-15 | 13F | Nations Financial Group Inc, /ia/ /adv | 18.336 | 1,70 | 907 | -4,83 | ||||
| 2026-04-08 | 13F | Castle Rock Wealth Management, LLC | 54.922 | -3,45 | 2.729 | -7,96 | ||||
| 2026-02-10 | 13F | Texas Yale Capital Corp. | 5.000 | 19,05 | 264 | 20,00 | ||||
| 2026-02-13 | 13F | MAI Capital Management | 363 | 2,83 | 19 | 5,56 | ||||
| 2026-04-23 | 13F | Comprehensive Money Management Services LLC | 8.794 | 19,50 | 435 | 11,83 | ||||
| 2026-02-11 | 13F | O'shaughnessy Asset Management, Llc | 141 | 0,00 | 7 | 0,00 | ||||
| 2026-02-06 | 13F | Prevail Innovative Wealth Advisors, Llc | 31.287 | -32,72 | 1.654 | -32,19 | ||||
| 2026-04-24 | 13F | Private Advisor Group, LLC | 65.861 | 16,72 | 3.259 | 9,25 | ||||
| 2026-04-16 | 13F | Aurora Private Wealth, Inc. | 7.655 | 0,00 | 0 | |||||
| 2026-04-16 | 13F | XML Financial, LLC | 175.490 | 11,01 | 8.685 | 3,91 | ||||
| 2026-04-09 | 13F | DHJJ Financial Advisors, Ltd. | 5 | 0,00 | 0 | |||||
| 2026-04-16 | 13F | Financial Management Network Inc | 0 | -100,00 | 0 | |||||
| 2026-02-02 | 13F | Elite Wealth Management, Inc. | 4.236 | 224 | ||||||
| 2026-02-17 | 13F | IHT Wealth Management, LLC | 13.175 | 12,41 | 697 | 13,36 | ||||
| 2026-01-22 | 13F | Garrison Bradford & Associates Inc | 26.625 | 1.408 | ||||||
| 2026-02-13 | 13F | Pin Oak Investment Advisors Inc | 445 | 0,00 | 0 | -100,00 | ||||
| 2026-02-17 | 13F | Warren Averett Asset Management, LLC | 11.433 | 54,27 | 604 | 55,67 | ||||
| 2026-04-07 | 13F | Signaturefd, Llc | 4.250 | 210 | ||||||
| 2026-02-11 | 13F | Arsenal Capital Advisors LLC | 67.089 | 3.547 | ||||||
| 2026-04-17 | 13F | AdvisorNet Financial, Inc | 2.280 | 551,43 | 113 | 522,22 | ||||
| 2026-02-17 | 13F | Creative Planning | 19.445 | 1.028 | ||||||
| 2026-04-23 | 13F | URS Advisory LLC | 17.639 | 2,57 | 873 | -4,07 | ||||
| 2026-02-17 | 13F | Snowden Capital Advisors LLC | 11.965 | 633 | ||||||
| 2026-04-17 | 13F | Paragon Financial Partners, Inc. | 72.501 | 323,44 | 3.820 | 322,10 | ||||
| 2026-04-16 | 13F | Westmount Partners, LLC | 8.188 | 405 | ||||||
| 2026-02-17 | 13F | Harvest Investment Services, LLC | 13.000 | 687 | ||||||
| 2026-02-06 | 13F | Global Retirement Partners, LLC | 17.230 | -48,20 | 911 | -47,82 | ||||
| 2026-04-15 | 13F | Register Financial Advisors LLC | 3.175 | 111,67 | 157 | 98,73 | ||||
| 2026-02-04 | 13F | Ameritas Advisory Services, LLC | 0 | -100,00 | 0 | |||||
| 2026-01-20 | 13F | Stratos Wealth Advisors, LLC | 3.805 | 201 | ||||||
| 2026-02-17 | 13F | Jones Financial Companies Lllp | 5.451 | 288 | ||||||
| 2026-02-04 | 13F | Bensler, LLC | 222.468 | 11.762 | ||||||
| 2026-04-16 | 13F | Balboa Wealth Partners | 12.879 | 52,02 | 637 | 42,51 | ||||
| 2026-04-02 | 13F | Noble Wealth Management PBC | 10.094 | -8,29 | 500 | -14,11 | ||||
| 2026-04-15 | 13F | Activest Wealth Management | 500 | -94,51 | 24 | -95,02 | ||||
| 2026-04-22 | 13F | Janney Montgomery Scott LLC | 17.061 | 8,10 | 1 | |||||
| 2026-04-21 | 13F | Aurdan Capital Management, LLC | 70.763 | 3,98 | 3.502 | -2,67 | ||||
| 2026-02-17 | 13F | Herold Advisors, Inc. | 10.879 | 575 | ||||||
| 2026-04-17 | 13F | High Net Worth Advisory Group LLC | 7.951 | 0,00 | 393 | -6,43 | ||||
| 2026-02-11 | 13F | Simplex Trading, Llc | 2.065 | 167,49 | 109 | |||||
| 2026-04-20 | 13F | Concurrent Investment Advisors, LLC | 0 | -100,00 | 0 | -100,00 | ||||
| 2026-03-03 | 13F | NWF Advisory Services Inc. | 17.390 | 919 | ||||||
| 2026-04-24 | 13F | Semus Wealth Partners LLC | 88.673 | 3,04 | 4.388 | -3,54 | ||||
| 2026-04-13 | 13F | IFP Advisors, Inc | 100 | 0,00 | 5 | -20,00 | ||||
| 2026-01-23 | 13F | Forefront Wealth Management Inc. | 23.769 | 2,86 | 1.257 | 3,63 | ||||
| 2026-01-23 | 13F | Diversify Advisory Services, LLC | 4.000 | 212 | ||||||
| 2026-04-16 | 13F | Annex Advisory Services, LLC | 4.697 | 0,00 | 232 | -6,45 | ||||
| 2026-04-23 | 13F | American National Bank | 125.107 | 37,44 | 6.191 | 28,66 | ||||
| 2026-02-13 | 13F | Stifel Financial Corp | 31.862 | 1.685 | ||||||
| 2026-02-20 | 13F | Wick Capital Partners, LLC | 8.912 | -86,84 | 5.979 | 68,25 | ||||
| 2026-04-14 | 13F | Prospera Financial Services Inc | 5.313 | 263 | ||||||
| 2026-01-07 | 13F | Aventura Private Wealth, LLC | 2.930 | 3,61 | 155 | 4,05 | ||||
| 2026-02-14 | 13F | Rockefeller Capital Management L.P. | 51.077 | 23,26 | 2.704 | 24,44 | ||||
| 2026-02-12 | 13F | Triumph Capital Management | 3.792 | 200 | ||||||
| 2026-04-13 | 13F | Creative Financial Designs Inc /adv | 51.156 | 0,35 | 2.532 | -6,09 | ||||
| 2026-02-13 | 13F | Gen-Wealth Partners Inc | 63 | 3 | ||||||
| 2026-02-10 | 13F/A | Northwestern Mutual Wealth Management Co | 102.633 | 37,30 | 5.426 | 38,38 | ||||
| 2026-02-17 | 13F | Susquehanna International Group, Llp | 0 | -100,00 | 0 | |||||
| 2026-03-05 | 13F | Cedarwood Wealth LLC | 24.227 | 1.295 | ||||||
| 2026-02-13 | 13F | Navis Wealth Advisors, LLC | 46.717 | 2.470 | ||||||
| 2026-02-12 | 13F | Betterment LLC | 0 | -100,00 | 0 | |||||
| 2026-02-13 | 13F | Beta Wealth Group, Inc. | 42.349 | 8,15 | 2.239 | 9,01 | ||||
| 2026-02-17 | 13F | Royal Bank Of Canada | 460.780 | 224,91 | 24.362 | 227,45 | ||||
| 2026-04-15 | 13F | Signature Estate & Investment Advisors Llc | 15.197 | -8,95 | 752 | -14,74 | ||||
| 2026-02-13 | 13F | Kestra Advisory Services, LLC | 0 | -100,00 | 0 | |||||
| 2026-02-06 | 13F | HighTower Advisors, LLC | 1.057.006 | 16,48 | 55.884 | 17,39 | ||||
| 2026-02-09 | 13F | Harbour Investments, Inc. | 2.821 | -56,28 | 149 | -55,92 | ||||
| 2026-02-17 | 13F | Citadel Advisors Llc | 0 | -100,00 | 0 | |||||
| 2026-04-23 | 13F | J.w. Cole Advisors, Inc. | 23.644 | 37,96 | 1.170 | 29,14 |