Grundlæggende statistik
| Institutionelle ejere | 77 total, 77 long only, 0 short only, 0 long/short - change of -7,14% MRQ |
| Gennemsnitlig porteføljeallokering | 0.1981 % - change of 3,70% MRQ |
| Institutionelle aktier (lange) | 1.705.453 (ex 13D/G) - change of -0,03MM shares -1,99% MRQ |
| Institutionel værdi (lang) | $ 210.050 USD ($1000) |
Institutionelt ejerskab og aktionærer
SPDR Index Shares Funds - SPDR S&P Emerging Asia Pacific ETF (US:GMF) har 77 institutionelle ejere og aktionærer, der har indsendt 13D/G- eller 13F-formularer til Securities Exchange Commission (SEC). Disse institutioner har i alt 1,705,453 aktier. Største aktionærer omfatter Vontobel Holding Ltd., Stairway Partners, LLC, Rainey & Randall Investment Management Inc., First Pacific Financial, Financial Consulate, Inc, Old Mission Capital Llc, LPL Financial LLC, Wells Fargo & Company/mn, Federation des caisses Desjardins du Quebec, and Morgan Stanley .
SPDR Index Shares Funds - SPDR S&P Emerging Asia Pacific ETF (ARCA:GMF) institutionel ejerskabsstruktur viser aktuelle positioner i virksomheden efter institutioner og fonde, samt seneste ændringer i positionsstørrelse. Større aktionærer kan omfatte individuelle investorer, investeringsforeninger, hedgefonde eller institutioner. Skema 13D angiver, at investoren besidder (eller besidder) mere end 5 % af virksomheden og har til hensigt (eller har til hensigt at) aktivt at forfølge en ændring i forretningsstrategi. Skema 13G indikerer en passiv investering på over 5%.
The share price as of September 15, 2025 is 137,67 / share. Previously, on September 16, 2024, the share price was 112,52 / share. This represents an increase of 22,35% over that period.

Fondens stemningsscore
Fund Sentiment Score (fka Ownership Accumulation Score) finder de aktier, der bliver mest købt af fonde. Det er resultatet af en sofistikeret, multi-faktor kvantitativ model, der identificerer virksomheder med de højeste niveauer af institutionel akkumulering. Scoringsmodellen bruger en kombination af den samlede stigning i oplyste ejere, ændringerne i porteføljeallokeringer i disse ejere og andre målinger. Tallet går fra 0 til 100, hvor højere tal indikerer et højere niveau af akkumulering for sine jævnaldrende, og 50 er gennemsnittet.
Opdateringsfrekvens: Dagligt
Se Ownership Explorer, som giver en liste over højest rangerende virksomheder.
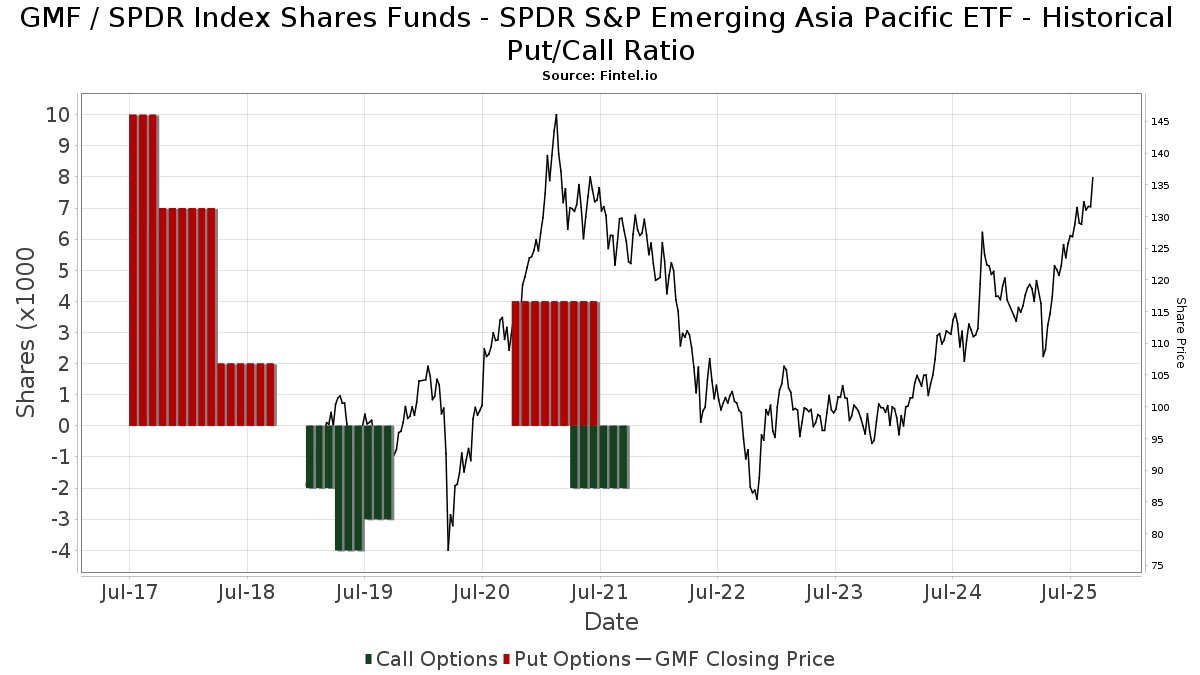
Institutionel Put/Call-forhold
Ud over at indberette standardaktie- og gældsudstedelser skal institutter med mere end 100 mill. aktiver under forvaltning også oplyse deres put- og call-optionsbeholdninger. Da salgsoptioner generelt indikerer negativ stemning, og købsoptioner indikerer positiv stemning, kan vi få en fornemmelse af den overordnede institutionelle stemning ved at plotte forholdet mellem put og kald. Diagrammet til højre viser det historiske put/call-forhold for dette instrument.
Brug af Put/Call Ratio som en indikator for investorernes stemning overvinder en af de vigtigste mangler ved at bruge totalt institutionelt ejerskab, som er, at en betydelig mængde af aktiver under forvaltning investeres passivt for at spore indekser. Passivt forvaltede fonde køber typisk ikke optioner, så indikatoren for put/call-forholdet følger mere nøje følelsen af aktivt forvaltede fonde.
13F og NPORT arkivering
Detaljer om 13F-arkivering er gratis. Detaljer om NP-ansøgninger kræver et premium-medlemskab. Grønne rækker angiver nye positioner. Røde rækker angiver lukkede positioner. Klik på linket ikon for at se den fulde transaktionshistorik.
Opgrader
for at låse premium-data op og eksportere til Excel ![]() .
.
| Fil dato | Kilde | Investor | Type | Gennemsnitlig pris (Øst) |
Aktier | Δ Aktier (%) |
Rapporteret Værdi ($1000) |
Δ Værdi (%) |
Port Alloc (%) |
|
|---|---|---|---|---|---|---|---|---|---|---|
| 2025-08-06 | 13F | AE Wealth Management LLC | 148 | 0,00 | 19 | 5,88 | ||||
| 2025-08-11 | 13F | Mill Creek Capital Advisors, LLC | 3.880 | -3,10 | 490 | 5,83 | ||||
| 2025-08-14 | 13F | Bank Of America Corp /de/ | 7.170 | 10,04 | 906 | 20,32 | ||||
| 2025-08-14 | 13F | Citadel Advisors Llc | 0 | -100,00 | 0 | |||||
| 2025-08-11 | 13F | HighTower Advisors, LLC | 16.407 | -8,27 | 2.074 | 0,24 | ||||
| 2025-08-15 | 13F | Resources Management Corp /ct/ /adv | 300 | 0,00 | 0 | |||||
| 2025-08-06 | 13F | Climber Capital SA | 2.460 | -1,80 | 309 | 27,16 | ||||
| 2025-08-14 | 13F | Quantinno Capital Management LP | 10.911 | -8,53 | 1.379 | 0,00 | ||||
| 2025-07-14 | 13F | Sowell Financial Services LLC | 7.339 | 0,00 | 928 | 9,32 | ||||
| 2025-09-04 | 13F/A | Advisor Group Holdings, Inc. | 744 | 20,58 | 94 | 32,39 | ||||
| 2025-08-04 | 13F | Creative Financial Designs Inc /adv | 0 | -100,00 | 0 | |||||
| 2025-05-13 | 13F | Hartland & Co., LLC | 0 | -100,00 | 0 | |||||
| 2025-08-04 | 13F | Bristlecone Advisors, LLC | 40 | 0,00 | 5 | 25,00 | ||||
| 2025-08-13 | 13F | Beacon Pointe Advisors, LLC | 25.479 | -20,97 | 3.220 | -13,65 | ||||
| 2025-07-30 | 13F | Whittier Trust Co Of Nevada Inc | 574 | 0,00 | 73 | 9,09 | ||||
| 2025-08-14 | 13F | Raymond James Financial Inc | 8.066 | -19,99 | 1.020 | -12,53 | ||||
| 2025-08-05 | 13F | Key FInancial Inc | 0 | -100,00 | 0 | |||||
| 2025-08-04 | 13F | Spire Wealth Management | 558 | 0,00 | 71 | 9,38 | ||||
| 2025-07-21 | 13F | Rainey & Randall Investment Management Inc. | 175.860 | 2,54 | 22.228 | 12,05 | ||||
| 2025-08-06 | 13F | Nicholas Hoffman & Company, LLC. | 1.972 | 0,66 | 249 | 10,18 | ||||
| 2025-08-13 | 13F | Brown Advisory Inc | 4.474 | 0,00 | 566 | 9,28 | ||||
| 2025-08-14 | 13F | CoreCap Advisors, LLC | 1.346 | 0,00 | 170 | 9,68 | ||||
| 2025-07-24 | 13F | Ronald Blue Trust, Inc. | 250 | 0,00 | 32 | 10,71 | ||||
| 2025-08-15 | 13F | Equitable Holdings, Inc. | 20.718 | 0,01 | 2.619 | 9,31 | ||||
| 2025-08-11 | 13F | Citigroup Inc | 388 | 0,00 | 49 | 11,36 | ||||
| 2025-08-12 | 13F | CIBC Private Wealth Group, LLC | 1.830 | -16,67 | 231 | 4,05 | ||||
| 2025-08-14 | 13F | UBS Group AG | 9.790 | -4,50 | 1.237 | 4,39 | ||||
| 2025-08-07 | 13F | Commerce Bank | 20.953 | 0,00 | 2.648 | 9,29 | ||||
| 2025-07-08 | 13F | Lowe Wealth Advisors, LLC | 83 | 0,00 | 10 | 11,11 | ||||
| 2025-08-13 | 13F | Flow Traders U.s. Llc | 7.888 | -60,63 | 1 | -100,00 | ||||
| 2025-08-06 | 13F | Rialto Wealth Management, LLC | 942 | 0,00 | 119 | 10,19 | ||||
| 2025-08-11 | 13F | Aptus Capital Advisors, LLC | 53 | 0,00 | 7 | 0,00 | ||||
| 2025-08-12 | 13F | OneAscent Financial Services LLC | 26.263 | 169,50 | 3 | 200,00 | ||||
| 2025-05-12 | 13F | Kohmann Bosshard Financial Services, LLC | 0 | -100,00 | 0 | |||||
| 2025-07-23 | 13F | Vontobel Holding Ltd. | 303.266 | -4,22 | 38.332 | 4,68 | ||||
| 2025-08-08 | 13F | Pnc Financial Services Group, Inc. | 425 | 0,00 | 54 | 8,16 | ||||
| 2025-08-14 | 13F | Fmr Llc | 450 | 0,22 | 57 | 9,80 | ||||
| 2025-08-12 | 13F | Edmond De Rothschild Holding S.a. | 2.000 | 0,00 | 253 | 9,09 | ||||
| 2025-07-25 | 13F | Atria Wealth Solutions, Inc. | 0 | -100,00 | 0 | |||||
| 2025-07-31 | 13F | AlTi Global, Inc. | 0 | -100,00 | 0 | |||||
| 2025-08-08 | 13F | Cetera Investment Advisers | 3.065 | -5,11 | 387 | 3,75 | ||||
| 2025-08-15 | 13F | Morgan Stanley | 50.878 | 4,49 | 6.431 | 14,19 | ||||
| 2025-08-04 | 13F | Atria Investments Llc | 26.263 | 169,50 | 3.320 | 194,50 | ||||
| 2025-08-14 | 13F | Old Mission Capital Llc | 85.518 | 48,59 | 10.809 | 62,39 | ||||
| 2025-07-29 | 13F | Yoffe Investment Management, LLC | 3.702 | 0,14 | 468 | 9,37 | ||||
| 2025-08-12 | 13F | Global Retirement Partners, LLC | 91 | 1,11 | 11 | 10,00 | ||||
| 2025-08-12 | 13F | LPL Financial LLC | 71.144 | 27,80 | 8.992 | 39,67 | ||||
| 2025-08-12 | 13F | MAI Capital Management | 106 | -94,00 | 13 | -93,63 | ||||
| 2025-08-12 | 13F | Coldstream Capital Management Inc | 0 | -100,00 | 0 | |||||
| 2025-08-14 | 13F | Federation des caisses Desjardins du Quebec | 57.776 | 4,02 | 7.303 | 13,67 | ||||
| 2025-07-23 | 13F | Magnolia Capital Management Ltd | 8.965 | 0,00 | 1 | 0,00 | ||||
| 2025-08-06 | 13F | SOUTH STATE Corp | 103 | 0,00 | 13 | 18,18 | ||||
| 2025-08-08 | 13F | Itau Unibanco Holding S.A. | 4.000 | 0,00 | 506 | |||||
| 2025-08-14 | 13F/A | Bank Julius Baer & Co. Ltd, Zurich | 18.300 | 24,60 | 2.313 | 20,53 | ||||
| 2025-08-26 | NP | EQ ADVISORS TRUST - EQ/All Asset Growth Allocation Portfolio Class IB | 15.550 | 0,00 | 1.965 | 9,29 | ||||
| 2025-04-23 | 13F | Mascagni Wealth Management, Inc. | 0 | -100,00 | 0 | -100,00 | ||||
| 2025-08-26 | NP | EQ ADVISORS TRUST - EQ/International Core Managed Volatility Portfolio Class IB | 5.079 | 0,00 | 642 | 9,20 | ||||
| 2025-08-18 | 13F/A | National Bank Of Canada /fi/ | 85 | 0,00 | 11 | 11,11 | ||||
| 2025-07-23 | 13F | Prime Capital Investment Advisors, LLC | 0 | -100,00 | 0 | |||||
| 2025-08-01 | 13F | Banco Santander, S.A. | 21.256 | -54,95 | 2.687 | -50,78 | ||||
| 2025-08-04 | 13F | Balentine LLC | 860 | 0,00 | 109 | 9,09 | ||||
| 2025-08-08 | 13F | SBI Securities Co., Ltd. | 1.082 | -4,08 | 137 | 4,62 | ||||
| 2025-04-30 | 13F | Principal Securities, Inc. | 0 | 0 | ||||||
| 2025-07-18 | 13F | First Pacific Financial | 173.457 | 1,23 | 21.925 | 10,63 | ||||
| 2025-07-11 | 13F | Farther Finance Advisors, LLC | 447 | 1,59 | 56 | 12,00 | ||||
| 2025-08-07 | 13F | Addison Advisors LLC | 17.046 | -3,94 | 2.155 | 4,97 | ||||
| 2025-08-12 | 13F | Proequities, Inc. | 0 | 0 | ||||||
| 2025-08-13 | 13F | Allie Family Office LLC | 1.870 | 0,00 | 236 | 9,26 | ||||
| 2025-04-28 | 13F | American Capital Advisory, LLC | 0 | -100,00 | 0 | |||||
| 2025-08-07 | 13F | Resources Investment Advisors, LLC. | 16.062 | -18,39 | 2.030 | -10,81 | ||||
| 2025-08-14 | 13F | Royal Bank Of Canada | 4.796 | 0,86 | 607 | 10,36 | ||||
| 2025-08-14 | 13F | Warren Averett Asset Management, LLC | 3.208 | 2,04 | 405 | 11,57 | ||||
| 2025-04-21 | 13F | Luken Investment Analytics, LLC | 0 | -100,00 | 0 | |||||
| 2025-08-12 | 13F | Jpmorgan Chase & Co | 309 | -37,32 | 39 | -31,58 | ||||
| 2025-07-18 | 13F | Financial Consulate, Inc | 90.694 | 4,20 | 11.464 | 13,87 | ||||
| 2025-07-24 | 13F | Us Bancorp \de\ | 55 | -42,71 | 7 | -45,45 | ||||
| 2025-07-11 | 13F | Great Waters Wealth Management | 2.867 | 0,63 | 362 | 10,03 | ||||
| 2025-08-14 | 13F | Wells Fargo & Company/mn | 70.314 | -18,47 | 8.887 | -10,90 | ||||
| 2025-07-03 | 13F | Stairway Partners, LLC | 246.932 | -0,48 | 31.212 | 8,76 | ||||
| 2025-08-08 | 13F | Creative Planning | 7.257 | 12,49 | 917 | 22,92 | ||||
| 2025-08-14 | 13F | Jane Street Group, Llc | 10.630 | 356,62 | 1.344 | 399,26 | ||||
| 2025-07-16 | 13F | ORG Partners LLC | 259 | 0,00 | 33 | 10,34 | ||||
| 2025-07-24 | 13F | Blair William & Co/il | 1.255 | 0,00 | 159 | 8,97 | ||||
| 2025-07-02 | 13F | Central Pacific Bank - Trust Division | 14 | 0,00 | 2 | 0,00 | ||||
| 2025-07-15 | 13F | Sheets Smith Wealth Management | 0 | -100,00 | 0 | |||||
| 2025-07-24 | 13F | Papp L Roy & Associates | 5.150 | 0,00 | 651 | 9,24 | ||||
| 2025-07-17 | 13F | K2 Financial Inc. | 2.742 | 5,46 | 352 | 23,16 | ||||
| 2025-07-16 | 13F | Signature Resources Capital Management, LLC | 200 | 0,00 | 25 | 8,70 | ||||
| 2025-08-05 | 13F | Bank Of Montreal /can/ | 326 | 0,00 | 41 | 10,81 | ||||
| 2025-08-15 | 13F | CI Private Wealth, LLC | 2.500 | 316 | ||||||
| 2025-08-12 | 13F | Deutsche Bank Ag\ | 1.681 | 0,00 | 212 | 9,28 | ||||
| 2025-08-14 | 13F | Susquehanna International Group, Llp | 8.532 | -64,43 | 1.078 | -61,14 |
Other Listings
| MX:GMF |