Grundlæggende statistik
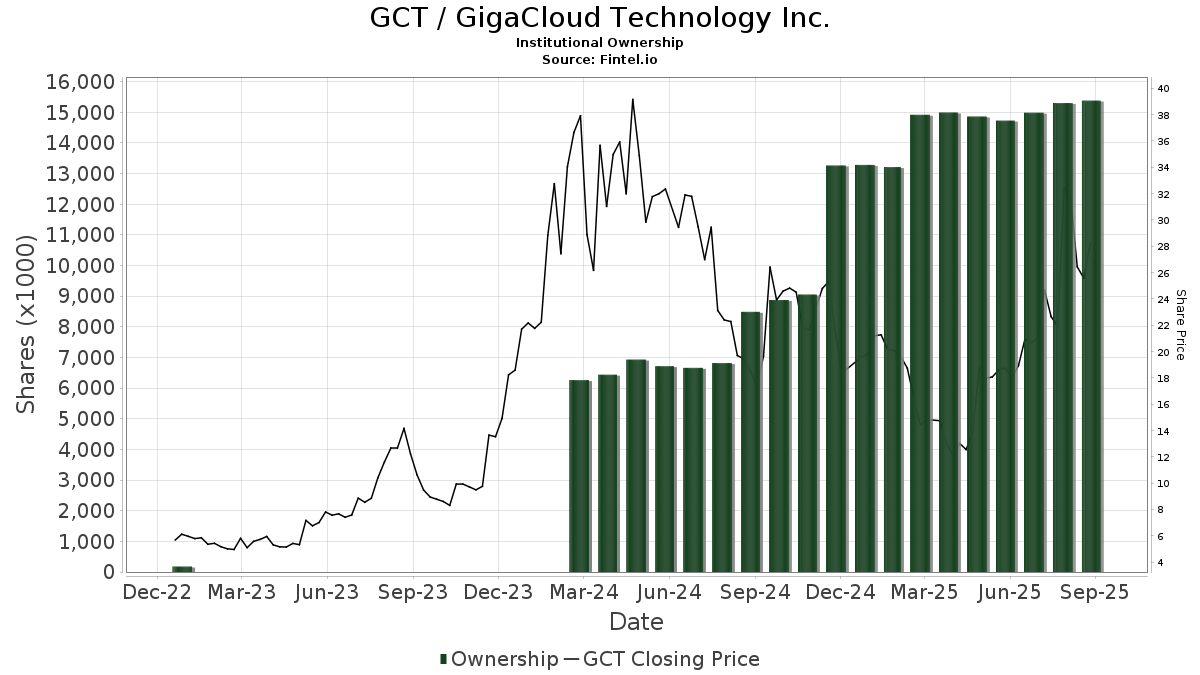
| Institutionelle aktier (lange) | 18.840.662 - 64,21% (ex 13D/G) - change of -2,39MM shares -11,25% MRQ |
| Institutionel værdi (lang) | $ 701.441 USD ($1000) |
Institutionelt ejerskab og aktionærer
GigaCloud Technology Inc. (US:GCT) har 197 institutionelle ejere og aktionærer, der har indsendt 13D/G- eller 13F-formularer til Securities Exchange Commission (SEC). Disse institutioner har i alt 18,840,662 aktier. Største aktionærer omfatter Fmr Llc, BlackRock, Inc., Vanguard Group Inc, Lsv Asset Management, Arrowstreet Capital, Limited Partnership, Geode Capital Management, Llc, Susquehanna International Group, Llp, State Street Corp, Nuveen, LLC, and Citadel Advisors Llc .
GigaCloud Technology Inc. (NasdaqGM:GCT) institutionel ejerskabsstruktur viser aktuelle positioner i virksomheden efter institutioner og fonde, samt seneste ændringer i positionsstørrelse. Større aktionærer kan omfatte individuelle investorer, investeringsforeninger, hedgefonde eller institutioner. Skema 13D angiver, at investoren besidder (eller besidder) mere end 5 % af virksomheden og har til hensigt (eller har til hensigt at) aktivt at forfølge en ændring i forretningsstrategi. Skema 13G indikerer en passiv investering på over 5%.
The share price as of April 10, 2026 is 44,54 / share. Previously, on April 14, 2025, the share price was 12,17 / share. This represents an increase of 266,02% over that period.
Fondens stemningsscore
Fund Sentiment Score (fka Ownership Accumulation Score) finder de aktier, der bliver mest købt af fonde. Det er resultatet af en sofistikeret, multi-faktor kvantitativ model, der identificerer virksomheder med de højeste niveauer af institutionel akkumulering. Scoringsmodellen bruger en kombination af den samlede stigning i oplyste ejere, ændringerne i porteføljeallokeringer i disse ejere og andre målinger. Tallet går fra 0 til 100, hvor højere tal indikerer et højere niveau af akkumulering for sine jævnaldrende, og 50 er gennemsnittet.
Opdateringsfrekvens: Dagligt
Se Ownership Explorer, som giver en liste over højest rangerende virksomheder.
AI+ Ask Fintel’s AI assistant about GigaCloud Technology Inc..
Select a question to share a public post with an AI-crafted answer.
Thinking of good questions…
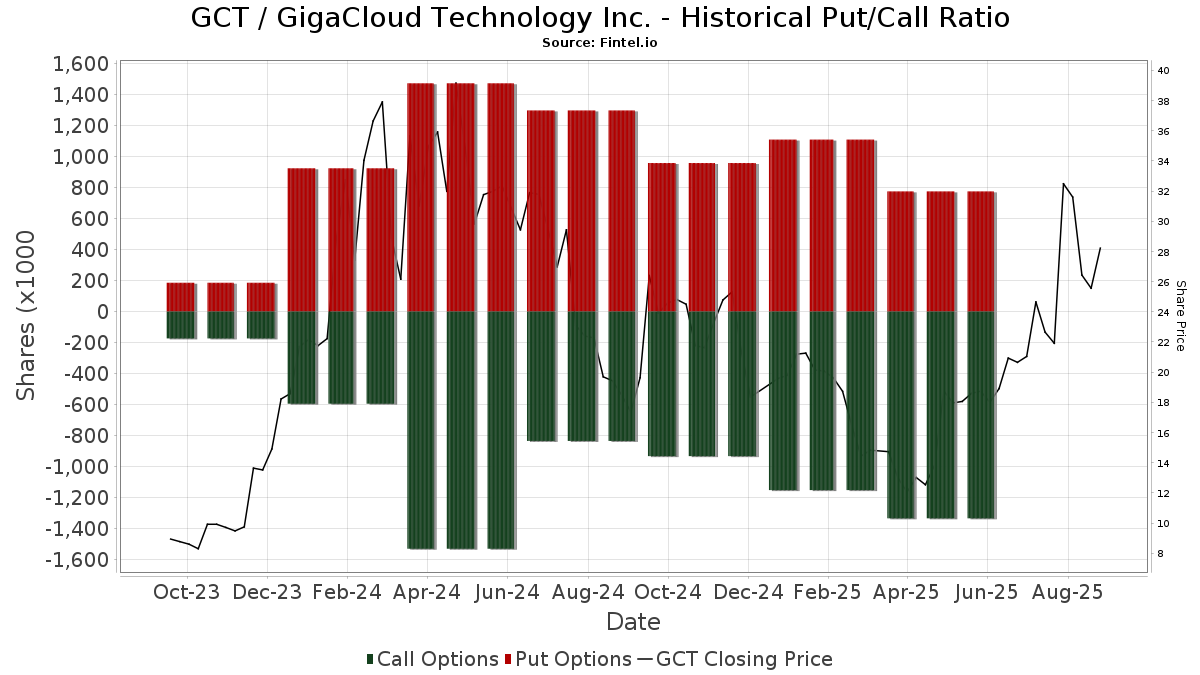
Institutionel Put/Call-forhold
Ud over at indberette standardaktie- og gældsudstedelser skal institutter med mere end 100 mill. aktiver under forvaltning også oplyse deres put- og call-optionsbeholdninger. Da salgsoptioner generelt indikerer negativ stemning, og købsoptioner indikerer positiv stemning, kan vi få en fornemmelse af den overordnede institutionelle stemning ved at plotte forholdet mellem put og kald. Diagrammet til højre viser det historiske put/call-forhold for dette instrument.
Brug af Put/Call Ratio som en indikator for investorernes stemning overvinder en af de vigtigste mangler ved at bruge totalt institutionelt ejerskab, som er, at en betydelig mængde af aktiver under forvaltning investeres passivt for at spore indekser. Passivt forvaltede fonde køber typisk ikke optioner, så indikatoren for put/call-forholdet følger mere nøje følelsen af aktivt forvaltede fonde.
13D/G-arkivering
Vi præsenterer 13D/G ansøgninger separat fra 13F ansøgninger på grund af den forskellige behandling af SEC. 13D/G-ansøgninger kan indgives af grupper af investorer (med én ledende), hvorimod 13F-ansøgninger ikke kan. Dette resulterer i situationer, hvor en investor kan indsende en 13D/G, der rapporterer én værdi for de samlede aktier (der repræsenterer alle de aktier, der ejes af investorgruppen), men derefter indsender en 13F, der rapporterer en anden værdi for de samlede aktier (der udelukkende repræsenterer deres egne) ejendomsret). Det betyder, at aktieejerskab af 13D/G-arkiver og 13F-arkiveringer ofte ikke er direkte sammenlignelige, så vi præsenterer dem separat.
Bemærk: Fra den 16. maj 2021 viser vi ikke længere ejere, der ikke har indsendt en 13D/G inden for det seneste år. Tidligere viste vi den fulde historie af 13D/G-arkiver. Generelt skal enheder, der er forpligtet til at indgive 13D/G-ansøgninger, indgive mindst årligt, før de indsender en afsluttende ansøgning. Dog forlader fonde nogle gange positioner uden at indsende en afsluttende ansøgning (dvs. de afvikler), så visning af den fulde historie resulterede nogle gange i forvirring om det nuværende ejerskab. For at undgå forvirring viser vi nu kun 'aktuelle' ejere - det vil sige - ejere, der har anmeldt inden for det seneste år.
Upgrade to unlock premium data.
| Fil dato | Form | Investor | Forrige Aktier |
Seneste Aktier |
Δ Aktier (Procent) |
Ejendomsret (Procent) |
Δ Ejerskab (Procent) |
|
|---|---|---|---|---|---|---|---|---|
| 2025-09-08 | FMR LLC | 4,372,409 | 14.80 | |||||
| 2025-07-17 | BlackRock, Inc. | 1,691,246 | 1,905,815 | 12.69 | 6.40 | 25.49 |
13F og NPORT arkivering
Detaljer om 13F-arkivering er gratis. Detaljer om NP-ansøgninger kræver et premium-medlemskab. Grønne rækker angiver nye positioner. Røde rækker angiver lukkede positioner. Klik på linket ikon for at se den fulde transaktionshistorik.
Opgrader
for at låse premium-data op og eksportere til Excel ![]() .
.
| Fil dato | Kilde | Investor | Type | Gennemsnitlig pris (Øst) |
Aktier | Δ Aktier (%) |
Rapporteret Værdi ($1000) |
Δ Værdi (%) |
Port Alloc (%) |
|
|---|---|---|---|---|---|---|---|---|---|---|
| 2026-02-13 | 13F | Natixis | 11.248 | 442 | ||||||
| 2025-11-13 | 13F | Capital Fund Management S.a. | Put | 0 | -100,00 | 0 | -100,00 | |||
| 2026-02-04 | 13F | Pacer Advisors, Inc. | 0 | -100,00 | 0 | |||||
| 2026-01-26 | 13F | Cwm, Llc | 1.930 | 2,17 | 0 | |||||
| 2026-02-12 | 13F | Wealthspire Advisors, LLC | 0 | -100,00 | 0 | |||||
| 2026-02-06 | 13F | IFP Advisors, Inc | 38 | 2,70 | 1 | 0,00 | ||||
| 2026-02-11 | 13F | J.Safra Asset Management Corp | 69 | 0,00 | 3 | 100,00 | ||||
| 2026-02-10 | 13F | Intech Investment Management Llc | 8.585 | -26,71 | 337 | 1,51 | ||||
| 2026-04-08 | 13F | NorthCrest Asset Manangement, LLC | 14.579 | 0,87 | 653 | 15,40 | ||||
| 2026-02-03 | 13F | Redwood Wealth Management Group, LLC | 7.380 | 0,96 | 290 | 39,61 | ||||
| 2026-01-29 | 13F | Vanguard Group Inc | 917.024 | 14,11 | 36.021 | 57,82 | ||||
| 2026-01-30 | 13F | New York State Teachers Retirement System | 2.260 | -5,83 | 0 | |||||
| 2026-02-12 | 13F | Swiss National Bank | 49.500 | 0,00 | 1.944 | 38,36 | ||||
| 2026-02-13 | 13F | Ubs Asset Management Americas Inc | 41.088 | 19,28 | 1.614 | 64,93 | ||||
| 2026-02-17 | 13F | Price T Rowe Associates Inc /md/ | 14.880 | 7,08 | 1 | |||||
| 2026-02-13 | 13F | Mariner, LLC | 30.775 | 15,32 | 1.209 | 59,58 | ||||
| 2026-02-12 | 13F | Steward Partners Investment Advisory, Llc | 155 | 0,00 | 6 | 50,00 | ||||
| 2026-02-13 | 13F | Quarry LP | 0 | -100,00 | 0 | |||||
| 2026-02-04 | 13F | Pacific Ridge Capital Partners, LLC | 21.269 | -12,38 | 835 | 21,19 | ||||
| 2026-02-13 | 13F | Barclays Plc | 38.196 | -14,61 | 1.500 | 18,11 | ||||
| 2026-02-13 | 13F | Oasis Management Co Ltd. | 312.995 | 0,00 | 12.294 | 38,31 | ||||
| 2026-02-17 | 13F | Canada Pension Plan Investment Board | 19.300 | 758 | ||||||
| 2026-02-10 | 13F/A | Northwestern Mutual Wealth Management Co | 46 | 0,00 | 2 | 0,00 | ||||
| 2026-01-08 | 13F | Nordea Investment Management Ab | 136.400 | 2,33 | 5.386 | 39,82 | ||||
| 2026-02-17 | 13F | D. E. Shaw & Co., Inc. | Put | 20.200 | 0,00 | 793 | 38,39 | |||
| 2026-01-23 | 13F | State of Alaska, Department of Revenue | 5.972 | 0 | ||||||
| 2026-02-17 | 13F | D. E. Shaw & Co., Inc. | Call | 97.100 | -12,29 | 3.814 | 21,35 | |||
| 2026-03-12 | 13F/A | Peak6 Llc | Put | 122.900 | -0,81 | 4.828 | 37,21 | |||
| 2026-01-27 | 13F | TD Waterhouse Canada Inc. | 0 | -100,00 | 0 | |||||
| 2026-02-12 | 13F | Campbell & CO Investment Adviser LLC | 11.479 | 451 | ||||||
| 2026-02-17 | 13F | D. E. Shaw & Co., Inc. | 386.019 | -8,85 | 15.163 | 26,07 | ||||
| 2026-03-12 | 13F/A | Peak6 Llc | Call | 18.400 | 0,00 | 723 | 38,31 | |||
| 2026-02-17 | 13F | Algert Global Llc | 111.201 | 4 | ||||||
| 2026-02-12 | 13F | BlackRock, Inc. | 2.133.330 | 0,08 | 83.797 | 38,42 | ||||
| 2026-02-12 | 13F | Voya Investment Management Llc | 14.195 | 0,17 | 558 | 38,56 | ||||
| 2026-02-18 | 13F | State of Tennessee, Treasury Department | 8.074 | 322 | ||||||
| 2026-01-14 | 13F | Spire Wealth Management | 370 | 146,67 | 15 | 250,00 | ||||
| 2026-02-11 | 13F | Ameritas Investment Partners, Inc. | 2.075 | 82 | ||||||
| 2026-02-06 | 13F | ProShare Advisors LLC | 100.035 | -21,41 | 3.929 | 8,72 | ||||
| 2026-02-06 | 13F | Lsv Asset Management | 736.600 | 824,22 | 29 | 1.300,00 | ||||
| 2025-11-13 | 13F | Riggs Asset Managment Co. Inc. | 0 | -100,00 | 0 | |||||
| 2026-02-13 | 13F | Y-Intercept (Hong Kong) Ltd | 10.390 | 408 | ||||||
| 2026-02-17 | 13F | Capital Fund Management S.a. | 34.853 | 1.369 | ||||||
| 2026-02-11 | 13F | Franklin Resources Inc | 300.641 | -28,67 | 11.809 | -1,35 | ||||
| 2026-01-26 | 13F | Private Trust Co Na | 255 | 0,00 | 10 | 42,86 | ||||
| 2026-01-21 | 13F | Sound Income Strategies, LLC | 426 | 0,00 | 17 | 41,67 | ||||
| 2026-02-17 | 13F | CWM Advisors, LLC | 30.315 | -17,20 | 1.191 | 14,53 | ||||
| 2025-11-04 | 13F | Thrivent Financial For Lutherans | 0 | -100,00 | 0 | |||||
| 2026-01-28 | 13F | Teacher Retirement System Of Texas | 42.246 | 25,97 | 1.659 | 74,26 | ||||
| 2026-02-13 | 13F | Mml Investors Services, Llc | 13.277 | 522 | ||||||
| 2026-03-12 | 13F/A | Peak6 Llc | 0 | -100,00 | 0 | -100,00 | ||||
| 2026-02-13 | 13F | Manufacturers Life Insurance Company, The | 0 | -100,00 | 0 | |||||
| 2026-04-08 | 13F | Wealth Enhancement Advisory Services, Llc | 16.098 | 1.345,06 | 68 | -5,56 | ||||
| 2026-02-05 | 13F | Cambridge Investment Research Advisors, Inc. | 8.800 | -0,02 | 0 | |||||
| 2026-02-26 | 13F/A | Sculptor Capital LP | 0 | -100,00 | 0 | |||||
| 2026-02-11 | 13F | Los Angeles Capital Management Llc | 31.773 | -1,10 | 870 | -4,71 | ||||
| 2026-02-26 | 13F/A | Sculptor Capital LP | Put | 0 | -100,00 | 0 | ||||
| 2026-02-11 | 13F | Group One Trading, L.p. | 155.023 | 14,42 | 6.089 | 58,28 | ||||
| 2026-02-10 | 13F | Avestar Capital, LLC | Call | 7.000 | 275 | |||||
| 2026-02-10 | 13F | Avestar Capital, LLC | 2.000 | 79 | ||||||
| 2026-02-17 | 13F | Cresset Asset Management, LLC | 5.558 | 218 | ||||||
| 2026-02-17 | 13F | Advisor Group Holdings, Inc. | 19.357 | -14,92 | 760 | 25,00 | ||||
| 2026-02-12 | 13F | MetLife Investment Management, LLC | 14.143 | -10,38 | 556 | 23,88 | ||||
| 2026-01-07 | 13F | Bay Rivers Group | 5.937 | 233 | ||||||
| 2026-02-03 | 13F | SBI Securities Co., Ltd. | 382 | -42,64 | 15 | -16,67 | ||||
| 2026-02-13 | 13F | SRS Capital Advisors, Inc. | 126 | -55,00 | 5 | -42,86 | ||||
| 2026-02-11 | 13F | Vermillion Wealth Management, Inc. | 54 | 0,00 | 2 | 100,00 | ||||
| 2025-11-14 | 13F | Point72 (DIFC) Ltd | 774 | 22 | ||||||
| 2025-12-09 | 13F/A | Tudor Investment Corp Et Al | Put | 11.300 | 8,65 | 321 | 56,10 | |||
| 2026-04-06 | 13F | Versant Capital Management, Inc | 294 | 2,80 | 13 | 18,18 | ||||
| 2026-02-13 | 13F | Walleye Trading LLC | 0 | -100,00 | 0 | -100,00 | ||||
| 2025-11-14 | 13F | Point72 Asia (Singapore) Pte. Ltd. | 2.226 | 63 | ||||||
| 2026-02-09 | 13F | Geode Capital Management, Llc | 627.336 | 1,10 | 24.646 | 39,84 | ||||
| 2026-01-27 | 13F | Zurcher Kantonalbank (Zurich Cantonalbank) | 7.234 | 23,59 | 284 | 71,08 | ||||
| 2026-02-13 | 13F | Victory Capital Management Inc | 52.078 | -23,53 | 2.046 | 5,74 | ||||
| 2025-11-14 | 13F | Wolverine Trading, Llc | Put | 29.200 | 53,68 | 860 | 128,46 | |||
| 2026-02-10 | 13F | Acadian Asset Management Llc | 9.405 | 1.301,64 | 0 | |||||
| 2026-02-17 | 13F | Russell Investments Group, Ltd. | 4.474 | -3,78 | 176 | 32,58 | ||||
| 2026-02-05 | 13F | Amalgamated Bank | 770 | -5,17 | 0 | |||||
| 2026-02-13 | 13F | Morgan Stanley | 425.045 | 27,98 | 16.696 | 77,02 | ||||
| 2026-02-13 | 13F | American Century Companies Inc | 268.932 | 1.997,10 | 10.564 | 2.801,92 | ||||
| 2026-02-13 | 13F | Kestra Advisory Services, LLC | 1.556 | 61 | ||||||
| 2026-02-17 | 13F | Raymond James Financial Inc | 19.442 | 764 | ||||||
| 2025-11-14 | 13F | Wolverine Trading, Llc | 18.821 | 14,32 | 554 | 70,46 | ||||
| 2025-11-14 | 13F | Wolverine Trading, Llc | Call | 77.800 | 0,39 | 2.290 | 49,28 | |||
| 2026-01-15 | 13F | Nisa Investment Advisors, Llc | 797 | -11,64 | 31 | 24,00 | ||||
| 2026-02-13 | 13F | OMERS ADMINISTRATION Corp | 0 | -100,00 | 0 | |||||
| 2026-02-17 | 13F | Credit Agricole S A | 186.031 | 307,01 | 7.307 | 462,94 | ||||
| 2026-02-17 | 13F | Creative Planning | 11.273 | 14,64 | 443 | 58,42 | ||||
| 2025-11-14 | 13F | Point72 Hong Kong Ltd | 2.189 | 62 | ||||||
| 2026-02-03 | 13F | Legacy Wealth Managment, LLC/ID | 28 | 0,00 | 1 | |||||
| 2026-02-09 | 13F | Harbour Investments, Inc. | 250 | 0,00 | 10 | 28,57 | ||||
| 2026-02-17 | 13F | Voloridge Investment Management, Llc | 0 | -100,00 | 0 | |||||
| 2026-02-11 | 13F | MidWestOne Financial Group, Inc. | 6.568 | -7,01 | 258 | 28,50 | ||||
| 2026-02-09 | 13F | Westover Capital Advisors, LLC | 11.118 | 437 | ||||||
| 2026-01-28 | 13F | Arizona State Retirement System | 7.007 | -7,06 | 275 | 28,50 | ||||
| 2026-02-12 | 13F | Commonwealth Equity Services, Llc | 14.106 | 22,20 | 554 | |||||
| 2026-02-03 | 13F | Denali Advisors Llc | 38.224 | 128,89 | 1.501 | 216,67 | ||||
| 2026-02-10 | 13F | Bank of New York Mellon Corp | 104.129 | -7,71 | 4.090 | 27,65 | ||||
| 2026-01-29 | 13F | UBS Group AG | 215.188 | -51,31 | 8.453 | -32,66 | ||||
| 2026-02-06 | 13F | Covestor Ltd | 3 | 0,00 | 0 | |||||
| 2026-02-13 | 13F | First Trust Advisors Lp | 96.811 | 12,24 | 3.803 | 55,25 | ||||
| 2026-02-17 | 13F | California State Teachers Retirement System | 25.192 | -0,76 | 990 | 37,36 | ||||
| 2025-11-07 | 13F | Gsa Capital Partners Llp | 0 | -100,00 | 0 | |||||
| 2026-02-17 | 13F | Aquatic Capital Management LLC | 8.979 | -37,65 | 353 | -13,73 | ||||
| 2026-01-07 | 13F | CWA Asset Management Group, LLC | 54.742 | 2.150 | ||||||
| 2026-02-17 | 13F | Optiver Holding B.V. | 19 | -75,00 | 1 | -100,00 | ||||
| 2026-04-07 | 13F | Farther Finance Advisors, LLC | 1.134 | 4.261,54 | 52 | 5.100,00 | ||||
| 2026-01-07 | 13F | Massmutual Trust Co Fsb/adv | 3 | 0 | ||||||
| 2026-02-17 | 13F | Point72 Asset Management, L.P. | 0 | -100,00 | 0 | |||||
| 2026-02-17 | 13F | Ameriprise Financial Inc | 48.309 | -23,25 | 1.898 | 6,16 | ||||
| 2026-02-04 | 13F | Swiss Life Asset Management Ltd | 5.145 | 202 | ||||||
| 2026-04-02 | 13F | Marex Group plc | 0 | -100,00 | 0 | -100,00 | ||||
| 2026-02-18 | 13F/A | Fuller & Thaler Asset Management, Inc. | 13.134 | 516 | ||||||
| 2026-02-02 | 13F | Principal Financial Group Inc | 29.276 | 42,75 | 1.150 | 97,42 | ||||
| 2026-03-31 | 13F/A | Barclays Plc | Call | 0 | -100,00 | 0 | -100,00 | |||
| 2026-01-28 | 13F | N.E.W. Advisory Services LLC | 0 | -100,00 | 0 | |||||
| 2026-02-13 | 13F | Prudential Financial Inc | 9.950 | 391 | ||||||
| 2026-02-17 | 13F | Jones Financial Companies Lllp | 2.047 | 125,44 | 80 | 207,69 | ||||
| 2026-02-17 | 13F | Northern Trust Corp | 293.520 | -11,36 | 11.529 | 22,60 | ||||
| 2026-02-17 | 13F | Cetera Investment Advisers | 34.266 | 16,67 | 1.346 | 61,27 | ||||
| 2026-02-18 | 13F | GWM Advisors LLC | 11.451 | 3.011,68 | 450 | 4.390,00 | ||||
| 2026-02-17 | 13F | XTX Topco Ltd | 53.031 | 2.083 | ||||||
| 2026-02-13 | 13F | State Street Corp | 566.091 | 1,76 | 22.236 | 40,74 | ||||
| 2026-02-13 | 13F | Kayne Anderson Rudnick Investment Management Llc | 108.464 | 32,39 | 4.260 | 83,15 | ||||
| 2026-02-17 | 13F | Qube Research & Technologies Ltd | 35.635 | 1.400 | ||||||
| 2026-01-06 | 13F | Tucker Asset Management Llc | 0 | -100,00 | 0 | |||||
| 2026-01-27 | 13F | WealthCollab, LLC | 45 | 0,00 | 2 | 0,00 | ||||
| 2026-02-13 | 13F | Walleye Trading LLC | Put | 22.100 | 127,84 | 868 | 215,64 | |||
| 2026-02-13 | 13F | Walleye Trading LLC | Call | 55.500 | 12,12 | 2.180 | 55,16 | |||
| 2026-01-30 | 13F | Us Bancorp \de\ | 318 | 8,16 | 12 | 50,00 | ||||
| 2026-02-17 | 13F | Advisory Services Network, LLC | 0 | -100,00 | 0 | |||||
| 2026-01-20 | 13F | Harbor Capital Advisors, Inc. | 220 | -1,79 | 0 | |||||
| 2026-03-06 | 13F | Hsbc Holdings Plc | 0 | -100,00 | 0 | |||||
| 2026-02-06 | 13F | Pnc Financial Services Group, Inc. | 2 | 0,00 | 0 | |||||
| 2026-02-10 | 13F | Catalyst Capital Advisors LLC | 20.400 | -5,99 | 801 | 30,03 | ||||
| 2026-02-17 | 13F | Fmr Llc | 4.346.673 | -0,58 | 170.737 | 37,51 | ||||
| 2026-02-18 | 13F | Vident Advisory, LLC | 15.026 | -30,64 | 590 | -4,07 | ||||
| 2026-02-13 | 13F | Verition Fund Management LLC | 20.461 | 0,88 | 804 | 39,41 | ||||
| 2026-02-13 | 13F | Squarepoint Ops LLC | 14.023 | 551 | ||||||
| 2026-02-10 | 13F | Goldman Sachs Group Inc | 399.454 | 46,16 | 15.691 | 102,16 | ||||
| 2026-02-11 | 13F | LPL Financial LLC | 122.642 | -10,17 | 4.817 | 24,25 | ||||
| 2026-02-06 | 13F | Tortoise Investment Management, LLC | 0 | -100,00 | 0 | |||||
| 2026-01-23 | 13F | Assetmark, Inc | 9 | 0,00 | 0 | |||||
| 2026-02-17 | 13F | Portolan Capital Management, LLC | 137.478 | -37,62 | 5.400 | -13,71 | ||||
| 2026-02-17 | 13F | Bank Of America Corp /de/ | 35.150 | 187,83 | 1.381 | 298,84 | ||||
| 2026-02-10 | 13F | Quantbot Technologies LP | 11.759 | -82,82 | 462 | -76,27 | ||||
| 2026-01-15 | 13F | Allspring Global Investments Holdings, LLC | 158.798 | 497,88 | 6.238 | 727,19 | ||||
| 2026-02-17 | 13F | Capital Fund Management S.a. | Call | 23.800 | 6,73 | 935 | 47,55 | |||
| 2026-02-06 | 13F | EverSource Wealth Advisors, LLC | 209 | -5,00 | 8 | 33,33 | ||||
| 2026-02-11 | 13F | J.w. Cole Advisors, Inc. | 0 | -100,00 | 0 | |||||
| 2026-01-26 | 13F | PFG Investments, LLC | 6.050 | -25,95 | 238 | 2,16 | ||||
| 2026-02-17 | 13F | Royal Bank Of Canada | 6.975 | -29,15 | 274 | -2,14 | ||||
| 2026-02-06 | 13F | Global Retirement Partners, LLC | 1.918 | 0,79 | 75 | 38,89 | ||||
| 2026-02-11 | 13F | Brandywine Global Investment Management, LLC | 43.286 | 1.700 | ||||||
| 2025-11-14 | 13F | Skopos Labs, Inc. | 0 | -100,00 | 0 | |||||
| 2026-01-29 | 13F | James Investment Research Inc | 17.990 | 0,00 | 707 | 38,43 | ||||
| 2026-02-17 | 13F | Bridgeway Capital Management Inc | 335.881 | -0,00 | 13.193 | 38,31 | ||||
| 2026-02-11 | 13F | Jpmorgan Chase & Co | 310.908 | 0,17 | 12.212 | 38,55 | ||||
| 2026-02-13 | 13F | Smartleaf Asset Management LLC | 158 | 6 | ||||||
| 2026-02-17 | 13F | Tudor Investment Corp Et Al | Call | 21.900 | -68,98 | 860 | -57,11 | |||
| 2026-02-10 | 13F | Bnp Paribas Arbitrage, Sa | 9.517 | -86,46 | 374 | -81,31 | ||||
| 2026-02-14 | 13F | Rockefeller Capital Management L.P. | 200 | -64,60 | 8 | -56,25 | ||||
| 2026-02-17 | 13F | Tudor Investment Corp Et Al | 99.319 | 3.901 | ||||||
| 2026-02-13 | 13F | Truvestments Capital Llc | 1.025 | -3,39 | 40 | 33,33 | ||||
| 2026-02-17 | 13F | Gotham Asset Management, LLC | 41.082 | 98,35 | 1.614 | 174,32 | ||||
| 2025-11-14 | 13F | Sherbrooke Park Advisers Llc | 0 | -100,00 | 0 | |||||
| 2026-02-13 | 13F | Charles Schwab Investment Management Inc | 214.417 | -2,14 | 8.422 | 35,36 | ||||
| 2026-01-09 | 13F | SG Americas Securities, LLC | 5.249 | 10,18 | 0 | |||||
| 2026-02-10 | 13F | Axq Capital, Lp | 8.689 | 341 | ||||||
| 2026-02-11 | 13F | Picton Mahoney Asset Management | 20.266 | -37,19 | 796 | |||||
| 2026-01-29 | 13F | IMC-Chicago, LLC | 17.781 | 6,39 | 698 | 47,26 | ||||
| 2026-02-10 | 13F | Root Financial Partners, LLC | 3 | 0 | ||||||
| 2026-02-13 | 13F | Wells Fargo & Company/mn | 32.260 | 62,55 | 1.267 | 125,04 | ||||
| 2026-02-13 | 13F | Caitong International Asset Management Co., Ltd | 193 | -81,98 | 8 | -76,67 | ||||
| 2026-02-17 | 13F | Point72 Asset Management, L.P. | Call | 44.500 | 185,26 | 1.748 | 294,36 | |||
| 2026-01-21 | 13F | Prime Capital Investment Advisors, LLC | 6.911 | -11,11 | 271 | 23,18 | ||||
| 2026-02-17 | 13F | Point72 Asset Management, L.P. | Put | 35.900 | 1.410 | |||||
| 2026-02-12 | 13F | Counterpoint Mutual Funds LLC | 0 | -100,00 | 0 | |||||
| 2026-02-20 | 13F | Sunbelt Securities, Inc. | 50 | 0,00 | 2 | 0,00 | ||||
| 2026-02-12 | 13F | Penserra Capital Management LLC | 0 | -100,00 | 0 | |||||
| 2026-02-17 | 13F | Balyasny Asset Management Llc | 0 | -100,00 | 0 | |||||
| 2026-01-22 | 13F | Massachusetts Financial Services Co /ma/ | 15.942 | 626 | ||||||
| 2026-02-13 | 13F | Arrowstreet Capital, Limited Partnership | 696.181 | 37,93 | 27.346 | 90,77 | ||||
| 2026-02-10 | 13F | Globeflex Capital L P | 54.975 | 0,00 | 2.159 | 38,31 | ||||
| 2026-02-17 | 13F | State Of Wisconsin Investment Board | 49.779 | -31,18 | 1.955 | -4,82 | ||||
| 2026-02-03 | 13F | NewEdge Wealth, LLC | 24.610 | 10,89 | 967 | 59,14 | ||||
| 2026-01-23 | 13F | Ritholtz Wealth Management | 5.398 | 212 | ||||||
| 2026-04-10 | 13F | Matrix Trust Co | 319 | 0 | ||||||
| 2026-02-05 | 13F | Allworth Financial LP | 851 | -0,82 | 33 | 37,50 | ||||
| 2026-02-13 | 13F | Toroso Investments, LLC | 9.779 | 384 | ||||||
| 2026-02-12 | 13F | New York State Common Retirement Fund | 18.600 | 60,34 | 731 | 121,88 | ||||
| 2026-02-06 | 13F | Banque Cantonale Vaudoise | 16.004 | 0,00 | 629 | |||||
| 2026-02-17 | 13F | Janus Henderson Group Plc | 10.600 | 0,00 | 416 | 38,67 | ||||
| 2026-02-12 | 13F | Alps Advisors Inc | 15.415 | 0,88 | 606 | 39,72 | ||||
| 2025-10-31 | 13F | Whittier Trust Co Of Nevada Inc | 0 | -100,00 | 0 | -100,00 | ||||
| 2026-02-12 | 13F | Federation des caisses Desjardins du Quebec | 902 | 0,00 | 35 | 40,00 | ||||
| 2026-02-17 | 13F | Tower Research Capital LLC (TRC) | 455 | -55,13 | 18 | -39,29 | ||||
| 2025-11-18 | 13F | Kozak & Associates, Inc. | 0 | -100,00 | 0 | -100,00 | ||||
| 2026-02-17 | 13F | Quantinno Capital Management LP | 8.399 | 330 | ||||||
| 2026-02-10 | 13F | State of Wyoming | 16.770 | 98,84 | 659 | 175,31 | ||||
| 2026-02-17 | 13F | Millennium Management Llc | 5.468 | -87,54 | 215 | -82,83 | ||||
| 2026-02-10 | 13F | Rothschild Investment Llc | 166 | 0,61 | 7 | 50,00 | ||||
| 2026-02-17 | 13F | Aqr Capital Management Llc | 52.852 | -2,82 | 2.076 | 34,46 | ||||
| 2025-11-14 | 13F | Cubist Systematic Strategies, LLC | 96.687 | 2.746 | ||||||
| 2026-02-13 | 13F | Arete Wealth Advisors, LLC | 14.200 | -4,05 | 1 | |||||
| 2025-11-06 | 13F | Ameritas Advisory Services, LLC | 0 | -100,00 | 0 | |||||
| 2026-01-30 | 13F | Strategic Blueprint, LLC | 7.729 | 0,00 | 304 | 38,36 | ||||
| 2026-01-28 | 13F | Klp Kapitalforvaltning As | 5.600 | 16,67 | 220 | 61,03 | ||||
| 2026-02-12 | 13F | Dimensional Fund Advisors Lp | 134.075 | 5.266 | ||||||
| 2025-11-14 | 13F | National Bank Of Canada /fi/ | 0 | -100,00 | 0 | -100,00 | ||||
| 2026-02-12 | 13F | Jane Street Group, Llc | 57.338 | -62,80 | 2.252 | -48,55 | ||||
| 2026-02-13 | 13F | Sterling Capital Management LLC | 13.682 | -2,16 | 537 | 35,26 | ||||
| 2026-02-12 | 13F | Jane Street Group, Llc | Put | 88.900 | -0,34 | 3.492 | 37,82 | |||
| 2026-02-12 | 13F | Jane Street Group, Llc | Call | 201.400 | 118,44 | 7.911 | 202,14 | |||
| 2026-01-20 | 13F | Stratos Wealth Partners, LTD. | 8.803 | -16,91 | 346 | 15,00 | ||||
| 2026-02-11 | 13F | Janney Montgomery Scott LLC | 17.570 | -24,76 | 1 | |||||
| 2026-02-12 | 13F | Nuveen, LLC | 542.454 | 32,19 | 21.308 | 82,85 | ||||
| 2026-02-11 | 13F | Empowered Funds, LLC | 170.081 | 4,03 | 6.681 | 43,90 | ||||
| 2026-02-11 | 13F | O'shaughnessy Asset Management, Llc | 52.216 | 47,49 | 2.051 | 104,08 | ||||
| 2025-11-21 | 13F | Nebula Research & Development LLC | 0 | -100,00 | 0 | |||||
| 2026-02-13 | 13F | Walleye Capital LLC | Call | 64.100 | 34,95 | 2.518 | 86,58 | |||
| 2026-02-13 | 13F | Walleye Capital LLC | Put | 2.100 | 82 | |||||
| 2026-02-04 | 13F | Virginia Retirement Systems Et Al | 24.350 | -1,42 | 956 | 36,38 | ||||
| 2026-02-13 | 13F | Walleye Capital LLC | 1 | -99,99 | 0 | -100,00 | ||||
| 2026-02-17 | 13F | MIRAE ASSET GLOBAL ETFS HOLDINGS Ltd. | 22.042 | -7,01 | 866 | 28,53 | ||||
| 2026-02-17 | 13F | Alliancebernstein L.p. | 24.550 | -20,93 | 964 | 9,42 | ||||
| 2026-02-17 | 13F | Schonfeld Strategic Advisors LLC | 22.800 | 896 | ||||||
| 2026-04-07 | 13F | Signaturefd, Llc | 124 | 275,76 | 6 | 400,00 | ||||
| 2026-02-11 | 13F | Parallel Advisors, LLC | 6 | 0 | ||||||
| 2026-02-09 | 13F | Legal & General Group Plc | 25.048 | -0,09 | 984 | 38,26 | ||||
| 2026-02-06 | 13F | Larson Financial Group LLC | 797 | -23,37 | 31 | 6,90 | ||||
| 2026-02-19 | 13F | Invesco Ltd. | 145.439 | 211,59 | 5.713 | 331,09 | ||||
| 2026-02-13 | 13F | Rhumbline Advisers | 32.529 | -20,53 | 1.278 | 9,90 | ||||
| 2026-02-13 | 13F | Police & Firemen's Retirement System of New Jersey | 7.000 | 0,00 | 275 | 38,38 | ||||
| 2026-01-20 | 13F | Ethos Financial Group, LLC | 73.955 | 6,68 | 2.905 | 47,56 | ||||
| 2026-02-17 | 13F | Man Group plc | 22.804 | 158,81 | 896 | 258,00 | ||||
| 2026-04-06 | 13F | GAMMA Investing LLC | 740 | 3,93 | 34 | 22,22 | ||||
| 2026-02-17 | 13F | Susquehanna International Group, Llp | Put | 141.800 | -3,86 | 5.570 | 32,94 | |||
| 2026-02-17 | 13F | Susquehanna International Group, Llp | Call | 568.600 | -54,56 | 22.335 | -37,15 | |||
| 2026-02-17 | 13F | Susquehanna International Group, Llp | 5.387 | 212 | ||||||
| 2026-02-11 | 13F | Deutsche Bank Ag\ | 21.078 | 8,05 | 828 | 49,55 | ||||
| 2026-01-16 | 13F | Ellsworth Advisors, LLC | 19.140 | 796 | ||||||
| 2025-11-12 | 13F | Dunhill Financial, LLC | 0 | -100,00 | 0 | -100,00 | ||||
| 2026-02-02 | 13F | Strs Ohio | 10.700 | 137,78 | 420 | 230,71 | ||||
| 2026-02-13 | 13F | Citigroup Inc | 3.728 | -88,83 | 146 | -84,58 | ||||
| 2026-02-02 | 13F | Hussman Strategic Advisors, Inc. | 52.500 | -58,33 | 2.062 | -42,37 | ||||
| 2026-02-17 | 13F | Occudo Quantitative Strategies Lp | 10.459 | 411 | ||||||
| 2026-02-17 | 13F | Citadel Advisors Llc | Call | 49.100 | 1.929 | |||||
| 2026-02-17 | 13F | Citadel Advisors Llc | Put | 378.900 | -21,06 | 14.883 | 9,18 | |||
| 2026-02-17 | 13F | Citadel Advisors Llc | 467.572 | -46,94 | 18.366 | -26,61 |