Grundlæggende statistik
| Institutionelle ejere | 144 total, 144 long only, 0 short only, 0 long/short - change of 26,09% MRQ |
| Gennemsnitlig porteføljeallokering | 0.3221 % - change of -22,08% MRQ |
| Institutionelle aktier (lange) | 32.129.941 (ex 13D/G) - change of 9,45MM shares 41,70% MRQ |
| Institutionel værdi (lang) | $ 1.223.445 USD ($1000) |
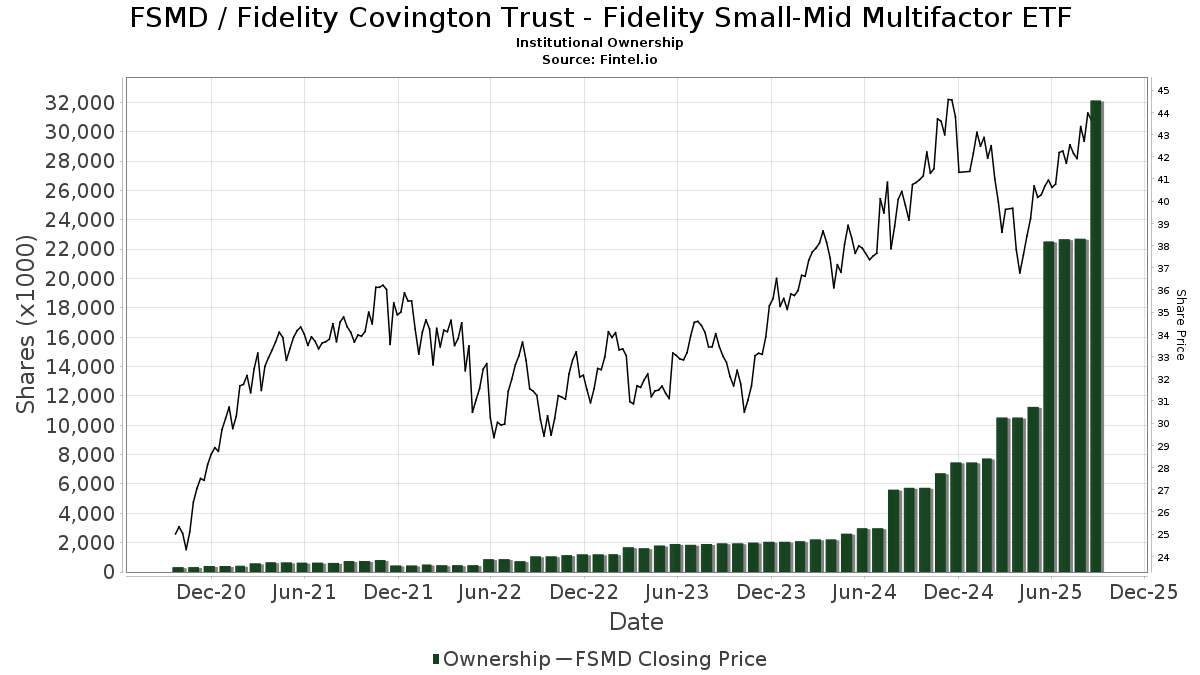
Institutionelt ejerskab og aktionærer
Fidelity Covington Trust - Fidelity Small-Mid Multifactor ETF (US:FSMD) har 144 institutionelle ejere og aktionærer, der har indsendt 13D/G- eller 13F-formularer til Securities Exchange Commission (SEC). Disse institutioner har i alt 32,129,941 aktier. Største aktionærer omfatter Fmr Llc, Retirement Planning Group, Commonwealth Equity Services, Llc, Bank Of America Corp /de/, LPL Financial LLC, Advocacy Wealth Management Services, LLC, Envestnet Asset Management Inc, Kestra Advisory Services, LLC, Systelligence, LLC, and Cetera Investment Advisers .
Fidelity Covington Trust - Fidelity Small-Mid Multifactor ETF (ARCA:FSMD) institutionel ejerskabsstruktur viser aktuelle positioner i virksomheden efter institutioner og fonde, samt seneste ændringer i positionsstørrelse. Større aktionærer kan omfatte individuelle investorer, investeringsforeninger, hedgefonde eller institutioner. Skema 13D angiver, at investoren besidder (eller besidder) mere end 5 % af virksomheden og har til hensigt (eller har til hensigt at) aktivt at forfølge en ændring i forretningsstrategi. Skema 13G indikerer en passiv investering på over 5%.
The share price as of September 12, 2025 is 44,15 / share. Previously, on September 16, 2024, the share price was 40,63 / share. This represents an increase of 8,66% over that period.
Fondens stemningsscore
Fund Sentiment Score (fka Ownership Accumulation Score) finder de aktier, der bliver mest købt af fonde. Det er resultatet af en sofistikeret, multi-faktor kvantitativ model, der identificerer virksomheder med de højeste niveauer af institutionel akkumulering. Scoringsmodellen bruger en kombination af den samlede stigning i oplyste ejere, ændringerne i porteføljeallokeringer i disse ejere og andre målinger. Tallet går fra 0 til 100, hvor højere tal indikerer et højere niveau af akkumulering for sine jævnaldrende, og 50 er gennemsnittet.
Opdateringsfrekvens: Dagligt
Se Ownership Explorer, som giver en liste over højest rangerende virksomheder.
Institutionel Put/Call-forhold
Ud over at indberette standardaktie- og gældsudstedelser skal institutter med mere end 100 mill. aktiver under forvaltning også oplyse deres put- og call-optionsbeholdninger. Da salgsoptioner generelt indikerer negativ stemning, og købsoptioner indikerer positiv stemning, kan vi få en fornemmelse af den overordnede institutionelle stemning ved at plotte forholdet mellem put og kald. Diagrammet til højre viser det historiske put/call-forhold for dette instrument.
Brug af Put/Call Ratio som en indikator for investorernes stemning overvinder en af de vigtigste mangler ved at bruge totalt institutionelt ejerskab, som er, at en betydelig mængde af aktiver under forvaltning investeres passivt for at spore indekser. Passivt forvaltede fonde køber typisk ikke optioner, så indikatoren for put/call-forholdet følger mere nøje følelsen af aktivt forvaltede fonde.
13F og NPORT arkivering
Detaljer om 13F-arkivering er gratis. Detaljer om NP-ansøgninger kræver et premium-medlemskab. Grønne rækker angiver nye positioner. Røde rækker angiver lukkede positioner. Klik på linket ikon for at se den fulde transaktionshistorik.
Opgrader
for at låse premium-data op og eksportere til Excel ![]() .
.
| Fil dato | Kilde | Investor | Type | Gennemsnitlig pris (Øst) |
Aktier | Δ Aktier (%) |
Rapporteret Værdi ($1000) |
Δ Værdi (%) |
Port Alloc (%) |
|
|---|---|---|---|---|---|---|---|---|---|---|
| 2025-07-29 | 13F | Private Trust Co Na | 42 | 0,00 | 2 | 0,00 | ||||
| 2025-09-04 | 13F/A | Advisor Group Holdings, Inc. | 236.855 | 26,53 | 9.826 | 34,00 | ||||
| 2025-07-14 | 13F | Sweeney & Michel, Llc | 10.785 | -0,14 | 453 | 21,12 | ||||
| 2025-08-12 | 13F/A | Cozad Asset Management Inc | 6.021 | 250 | ||||||
| 2025-04-15 | 13F | Noble Wealth Management PBC | 1.300 | 0,00 | 51 | -5,66 | ||||
| 2025-07-30 | 13F | Parcion Private Wealth LLC | 0 | -100,00 | 0 | |||||
| 2025-07-07 | 13F | Nova Wealth Management, Inc. | 3.704 | 19,95 | 154 | 27,50 | ||||
| 2025-07-09 | 13F | Sterling Manor Financial, LLC | 111.628 | -2,53 | 4.629 | 3,23 | ||||
| 2025-07-30 | 13F | Rehmann Capital Advisory Group | 0 | -100,00 | 0 | |||||
| 2025-08-01 | 13F | Envestnet Asset Management Inc | 631.790 | 44,27 | 26.200 | 52,78 | ||||
| 2025-08-13 | 13F | Twin Peaks Wealth Advisors, LLC | 543 | 23 | ||||||
| 2025-07-25 | 13F | Cwm, Llc | 6.845 | 94,52 | 0 | |||||
| 2025-07-24 | 13F | Blair William & Co/il | 255 | 11 | ||||||
| 2025-07-25 | 13F | Atria Wealth Solutions, Inc. | 13.197 | 0,15 | 547 | 6,01 | ||||
| 2025-08-11 | 13F | United Capital Financial Advisers, Llc | 8.134 | -0,12 | 337 | 5,97 | ||||
| 2025-08-15 | 13F | Montag & Caldwell, Llc | 16.819 | 0,01 | 697 | 5,93 | ||||
| 2025-08-15 | 13F | Kestra Advisory Services, LLC | 441.185 | 43,10 | 18.296 | 51,55 | ||||
| 2025-05-15 | 13F | Creative Planning | 0 | -100,00 | 0 | |||||
| 2025-08-07 | 13F | Kestra Private Wealth Services, Llc | 55.152 | 2,38 | 2.287 | 8,44 | ||||
| 2025-08-06 | 13F | Hoxton Planning & Management, LLC | 4.910 | 204 | ||||||
| 2025-08-08 | 13F | Avantax Advisory Services, Inc. | 54.221 | 26,62 | 2.249 | 34,13 | ||||
| 2025-08-14 | 13F | Stifel Financial Corp | 247.254 | 11,24 | 10.254 | 17,81 | ||||
| 2025-08-04 | 13F | Spire Wealth Management | 20.438 | 85.058,33 | 848 | |||||
| 2025-08-14 | 13F | Mml Investors Services, Llc | 139.142 | 2.394,93 | 6 | |||||
| 2025-08-13 | 13F | Renaissance Technologies Llc | 8.300 | 344 | ||||||
| 2025-08-15 | 13F | Equitable Holdings, Inc. | 34.905 | 41,63 | 1.448 | 49,95 | ||||
| 2025-07-18 | 13F | Provident Wealth Management, LLC | 161.237 | 0,12 | 6.686 | 6,03 | ||||
| 2025-08-14 | 13F | Visionary Wealth Advisors | 29.947 | 1.242 | ||||||
| 2025-08-13 | 13F | EverSource Wealth Advisors, LLC | 787 | 33 | ||||||
| 2025-08-14 | 13F | Hilltop Holdings Inc. | 31.681 | -1,16 | 1.314 | 4,62 | ||||
| 2025-08-14 | 13F | Fmr Llc | 16.578.869 | 82,93 | 687.526 | 93,72 | ||||
| 2025-08-14 | 13F | Susquehanna International Group, Llp | 30.352 | -64,98 | 1.259 | -62,93 | ||||
| 2025-07-21 | 13F | Ameritas Advisory Services, LLC | 470 | 19 | ||||||
| 2025-08-14 | 13F/A | Rockefeller Capital Management L.P. | 20.426 | 26,75 | 847 | 34,23 | ||||
| 2025-08-14 | 13F | Qube Research & Technologies Ltd | 77 | 3 | ||||||
| 2025-08-13 | 13F | Advocacy Wealth Management Services, LLC | 686.805 | -4,54 | 28.482 | 1,09 | ||||
| 2025-08-13 | 13F | Summit Wealth Group Llc / Co | 8.263 | 343 | ||||||
| 2025-08-12 | 13F | MAI Capital Management | 42 | 2 | ||||||
| 2025-08-15 | 13F | Tower Research Capital LLC (TRC) | 0 | -100,00 | 0 | |||||
| 2025-08-07 | 13F | Resources Investment Advisors, LLC. | 48.778 | 2.023 | ||||||
| 2025-07-28 | 13F | Holistic Planning, LLC | 5.358 | -10,18 | 222 | -4,72 | ||||
| 2025-07-16 | 13F | Novem Group | 167.625 | 6.951 | ||||||
| 2025-08-11 | 13F | HighTower Advisors, LLC | 5.561 | -0,30 | 231 | 5,50 | ||||
| 2025-08-12 | 13F | Howe & Rusling Inc | 155 | 6 | ||||||
| 2025-08-04 | 13F | Atria Investments Llc | 375.662 | 15.579 | ||||||
| 2025-08-14 | 13F | Bank Of America Corp /de/ | 1.116.813 | 30,62 | 46.314 | 38,33 | ||||
| 2025-08-12 | 13F | J.w. Cole Advisors, Inc. | 22.725 | 33,71 | 942 | 41,65 | ||||
| 2025-08-11 | 13F | Private Advisor Group, LLC | 15.778 | -15,49 | 654 | -10,53 | ||||
| 2025-08-06 | 13F | First Horizon Advisors, Inc. | 2.926 | 121 | ||||||
| 2025-07-29 | 13F | Fundamentun, Llc | 7.156 | -94,44 | 297 | -94,12 | ||||
| 2025-08-26 | NP | EVTTX - The E-Valuator Conservative/Moderate (30%-50%) RMS Fund Service Class Shares | 13.652 | -0,55 | 566 | 5,40 | ||||
| 2025-07-11 | 13F | Farther Finance Advisors, LLC | 66.731 | 95,26 | 2.767 | 106,65 | ||||
| 2025-05-02 | 13F | Capital A Wealth Management, LLC | 20 | 0,00 | 1 | |||||
| 2025-07-22 | 13F | Iron Horse Wealth Management, LLC | 0 | -100,00 | 0 | |||||
| 2025-07-22 | 13F | Merit Financial Group, LLC | 11.898 | 1,41 | 493 | 7,41 | ||||
| 2025-08-14 | 13F | Clarity Asset Management, Inc. | 138 | 6 | ||||||
| 2025-07-30 | 13F | Principle Wealth Partners Llc | 6.200 | 257 | ||||||
| 2025-08-08 | 13F | Pnc Financial Services Group, Inc. | 75 | 50,00 | 3 | 200,00 | ||||
| 2025-08-13 | 13F | Van Hulzen Asset Management, LLC | 73.228 | 2,54 | 3.037 | 8,58 | ||||
| 2025-08-08 | 13F | Laurel Wealth Planning LLC | 49.798 | 11,69 | 2.065 | 18,34 | ||||
| 2025-08-12 | 13F | SRS Capital Advisors, Inc. | 936 | 39 | ||||||
| 2025-07-10 | 13F | Wealth Enhancement Advisory Services, Llc | 8.947 | 15,80 | 380 | 25,83 | ||||
| 2025-08-14 | 13F | Wiley Bros.-aintree Capital, Llc | 32.341 | 353,78 | 1.341 | 385,87 | ||||
| 2025-07-28 | 13F | BRYN MAWR TRUST Co | 0 | -100,00 | 0 | |||||
| 2025-08-14 | 13F | Clg Llc | 7.204 | 4,32 | 299 | 10,37 | ||||
| 2025-07-29 | 13F | Riverbend Wealth Management, LLC | 27.058 | 1,61 | 1.122 | 7,68 | ||||
| 2025-08-15 | 13F | Semmax Financial Advisors Inc. | 124 | 0,00 | 5 | 25,00 | ||||
| 2025-07-10 | 13F | Focus Financial Network, Inc. | 5.977 | 248 | ||||||
| 2025-08-12 | 13F | PKS Advisory Services, LLC | 7.119 | -3,45 | 295 | 2,43 | ||||
| 2025-07-17 | 13F | Emerald Advisors, LLC | 7.250 | 301 | ||||||
| 2025-07-31 | 13F | Trademark Financial Management, LLC | 8.206 | -83,49 | 340 | -82,53 | ||||
| 2025-08-14 | 13F | Sunbelt Securities, Inc. | 14 | -98,88 | 1 | -100,00 | ||||
| 2025-07-29 | 13F | AssuredPartners Investment Advisors, LLC | 227.826 | -7,64 | 9.448 | -2,19 | ||||
| 2025-08-12 | 13F | Steward Partners Investment Advisory, Llc | 201.710 | -1,76 | 8.365 | 4,03 | ||||
| 2025-08-08 | 13F | Foundations Investment Advisors, LLC | 30.272 | 55,94 | 1.255 | 65,13 | ||||
| 2025-07-18 | 13F | Dogwood Wealth Management LLC | 4 | 0 | ||||||
| 2025-08-12 | 13F | Jpmorgan Chase & Co | 18.613 | 96,24 | 772 | 107,82 | ||||
| 2025-07-17 | 13F | Fifth Third Securities, Inc. | 0 | -100,00 | 0 | |||||
| 2025-07-29 | 13F | Stratos Wealth Partners, LTD. | 9.738 | -12,64 | 404 | -7,57 | ||||
| 2025-08-14 | 13F | Raymond James Financial Inc | 397.102 | 7,93 | 16.468 | 14,30 | ||||
| 2025-07-28 | 13F | Frazier Financial Advisors, LLC | 48 | 2 | ||||||
| 2025-08-14 | 13F | Jane Street Group, Llc | 71.309 | -56,79 | 2.957 | -54,24 | ||||
| 2025-08-14 | 13F | Mariner, LLC | 9.583 | 14,15 | 397 | 21,04 | ||||
| 2025-09-04 | 13F | ZynergyRetirementPlanningLLC | 0 | -100,00 | 0 | |||||
| 2025-08-07 | 13F | New England Private Wealth Advisors LLC | 5.615 | 0,36 | 237 | 7,76 | ||||
| 2025-08-05 | 13F | Bank Of Montreal /can/ | 470 | -42,68 | 19 | -40,62 | ||||
| 2025-08-08 | 13F | Cetera Investment Advisers | 407.073 | 8,53 | 16.881 | 14,94 | ||||
| 2025-08-05 | 13F | GPS Wealth Strategies Group, LLC | 40 | 0,00 | 2 | 0,00 | ||||
| 2025-08-19 | 13F | Advisory Services Network, LLC | 138.702 | 112,57 | 5.812 | 127,44 | ||||
| 2025-08-01 | 13F | Cedar Point Capital Partners, LLC | 17.881 | -6,64 | 742 | -1,20 | ||||
| 2025-08-26 | NP | EVVLX - The E-Valuator Very Conservative (0%-15%) RMS Fund Service Class Shares | 2.265 | -10,69 | 94 | -6,06 | ||||
| 2025-08-13 | 13F | Northwestern Mutual Wealth Management Co | 286.148 | -11,99 | 11.867 | -6,80 | ||||
| 2025-08-04 | 13F | Creative Financial Designs Inc /adv | 253 | 0,00 | 11 | 11,11 | ||||
| 2025-08-14 | 13F | Comerica Bank | 876 | 36 | ||||||
| 2025-05-08 | 13F | We Are One Seven, LLC | 0 | -100,00 | 0 | |||||
| 2025-07-30 | 13F | BG Investment Services, Inc. | 16.055 | -33,64 | 666 | -29,70 | ||||
| 2025-08-05 | 13F | Huntington National Bank | 248 | 47,90 | ||||||
| 2025-08-06 | 13F | Atlantic Union Bankshares Corp | 12 | 0 | ||||||
| 2025-07-25 | 13F | Concurrent Investment Advisors, LLC | 17.261 | 14,49 | 716 | 21,19 | ||||
| 2025-08-14 | 13F | Ambassador Advisors, LLC | 13.999 | 30,58 | 581 | 38,42 | ||||
| 2025-07-11 | 13F | SILVER OAK SECURITIES, Inc | 8.221 | -3,45 | 341 | 3,03 | ||||
| 2025-08-12 | 13F | O'shaughnessy Asset Management, Llc | 187 | 8 | ||||||
| 2025-08-06 | 13F | AE Wealth Management LLC | 12.980 | -75,34 | 538 | -73,90 | ||||
| 2025-08-12 | 13F | Global Retirement Partners, LLC | 5.072 | 0,42 | 210 | 1,45 | ||||
| 2025-08-13 | 13F | Jones Financial Companies Lllp | 562 | 23 | ||||||
| 2025-08-12 | 13F | Proequities, Inc. | 0 | 0 | ||||||
| 2025-07-31 | 13F | Cambridge Investment Research Advisors, Inc. | 256.896 | 3,02 | 11 | 11,11 | ||||
| 2025-08-07 | 13F | Allworth Financial LP | 683 | 80,69 | 28 | 100,00 | ||||
| 2025-07-08 | 13F | Parallel Advisors, LLC | 3.842 | 159 | ||||||
| 2025-07-14 | 13F | Abound Wealth Management | 50 | 0,00 | 2 | 100,00 | ||||
| 2025-05-12 | 13F | Sandy Spring Bank | 12 | 0,00 | 0 | |||||
| 2025-08-14 | 13F | Goldman Sachs Group Inc | 90.242 | 115,08 | 3.742 | 127,75 | ||||
| 2025-08-26 | NP | EVAGX - The E-Valuator Aggressive Growth (85%-99%) RMS Fund Service Class Shares | 158.641 | 11,46 | 6.579 | 18,03 | ||||
| 2025-08-13 | 13F | Kuhn & Co Investment Counsel | 23.974 | 87,43 | 994 | 98,80 | ||||
| 2025-08-26 | NP | EVMLX - The E-Valuator Moderate (50%-70%) RMS Fund Service Class Shares | 77.745 | 1,44 | 3.224 | 7,43 | ||||
| 2025-07-09 | 13F | Breakwater Capital Group | 16.182 | 671 | ||||||
| 2025-07-30 | 13F | Retirement Planning Group | 3.551.494 | 2,11 | 147.280 | 8,14 | ||||
| 2025-07-29 | 13F | Chicago Partners Investment Group LLC | 16.450 | 0,00 | 700 | 8,37 | ||||
| 2025-07-30 | 13F | Strategic Blueprint, LLC | 18.500 | 767 | ||||||
| 2025-07-07 | 13F | Kings Path Partners LLC | 20 | 1 | ||||||
| 2025-07-17 | 13F | Sound Income Strategies, LLC | 2.605 | -50,00 | 108 | -47,06 | ||||
| 2025-07-28 | 13F | RFG Advisory, LLC | 10.571 | 0,01 | 438 | 6,05 | ||||
| 2025-06-11 | 13F | Fortitude Financial, LLC | 155.604 | 6.093 | ||||||
| 2025-08-14 | 13F | Two Sigma Investments, Lp | 52.600 | 2.181 | ||||||
| 2025-08-06 | 13F | Golden State Wealth Management, LLC | 44.974 | 1.865 | ||||||
| 2025-08-13 | 13F | Per Stirling Capital Management, LLC. | 0 | -100,00 | 0 | |||||
| 2025-08-11 | 13F | Diversified Portfolios, Inc. | 8.564 | -5,20 | 355 | 0,57 | ||||
| 2025-08-14 | 13F | UBS Group AG | 5.574 | -6,52 | 231 | -0,86 | ||||
| 2025-08-14 | 13F | Diversify Advisory Services, LLC | 12.029 | 7,86 | 514 | 19,58 | ||||
| 2025-08-04 | 13F | Prairie Wealth Advisors, Inc. | 5.431 | 0,48 | 225 | 6,64 | ||||
| 2025-08-26 | NP | EVGLX - The E-Valuator Growth (70%-85%) RMS Fund Service Class Shares | 149.938 | -1,21 | 6.218 | 4,61 | ||||
| 2025-05-16 | 13F/A | Kestra Investment Management, LLC | 0 | -100,00 | 0 | |||||
| 2025-07-28 | 13F | Harbour Investments, Inc. | 419 | 852,27 | 17 | 1.600,00 | ||||
| 2025-08-26 | NP | EVCLX - The E-Valuator Conservative (15%-30%) RMS Fund Service Class Shares | 9.046 | 7,37 | 375 | 13,98 | ||||
| 2025-07-29 | 13F | BKM Wealth Management, LLC | 5.587 | 232 | ||||||
| 2025-07-30 | 13F | Cullen/frost Bankers, Inc. | 6.926 | 11,05 | 287 | 17,62 | ||||
| 2025-08-12 | 13F | CIBC Private Wealth Group, LLC | 1.116 | 46 | ||||||
| 2025-08-13 | 13F | Russell Investments Group, Ltd. | 13 | 0,00 | 1 | |||||
| 2025-08-14 | 13F | CoreCap Advisors, LLC | 7.696 | 15,73 | 319 | 22,69 | ||||
| 2025-08-06 | 13F | Commonwealth Equity Services, Llc | 2.208.276 | 20,63 | 92 | 28,17 | ||||
| 2025-08-12 | 13F | LPL Financial LLC | 845.378 | 36,18 | 35.058 | 44,21 | ||||
| 2025-08-14 | 13F | Great Valley Advisor Group, Inc. | 33.669 | 89,89 | 1.396 | 101,15 | ||||
| 2025-08-08 | 13F | Thoroughbred Financial Services, Llc | 11.816 | -0,40 | 0 | |||||
| 2025-07-10 | 13F | Global Financial Private Client, LLC | 16.201 | 672 | ||||||
| 2025-07-29 | 13F | Systelligence, LLC | 411.287 | 4,01 | 17.056 | 10,15 | ||||
| 2025-05-12 | 13F | Independent Advisor Alliance | 0 | -100,00 | 0 | |||||
| 2025-08-14 | 13F | Citadel Advisors Llc | 44.789 | 1.857 | ||||||
| 2025-08-14 | 13F | Wells Fargo & Company/mn | 198 | 19.700,00 | 8 | |||||
| 2025-05-08 | 13F | Eastern Bank | 0 | -100,00 | 0 | |||||
| 2025-08-14 | 13F | Royal Bank Of Canada | 42.993 | 130,51 | 1.783 | 144,25 | ||||
| 2025-08-11 | 13F | Principal Securities, Inc. | 6.124 | 238,34 | 254 | 241,89 | ||||
| 2025-07-31 | 13F | Glass Jacobson Investment Advisors llc | 563 | 78,73 | 23 | 91,67 | ||||
| 2025-07-25 | 13F | Envestnet Portfolio Solutions, Inc. | 20.795 | 15,04 | 862 | 21,92 | ||||
| 2025-07-07 | 13F | Roxbury Financial LLC | 19.894 | -7,66 | 825 | -6,58 | ||||
| 2025-07-24 | 13F | IFP Advisors, Inc | 1.144 | 116,67 | 47 | 135,00 | ||||
| 2025-08-14 | 13F | Balanced Rock Investment Advisor | 7.636 | 317 | ||||||
| 2025-07-16 | 13F | Evergreen Private Wealth LLC | 122.952 | 4,29 | 5.099 | 10,44 | ||||
| 2025-07-22 | 13F | Wealthcare Advisory Partners LLC | 37.068 | 1.537 | ||||||
| 2025-08-15 | 13F | Morgan Stanley | 8.023 | 9.566,27 | 333 | 10.966,67 |