Grundlæggende statistik
| Institutionelle ejere | 161 total, 161 long only, 0 short only, 0 long/short - change of 14,18% MRQ |
| Gennemsnitlig porteføljeallokering | 0.5856 % - change of 14,53% MRQ |
| Institutionelle aktier (lange) | 20.603.562 (ex 13D/G) - change of 4,32MM shares 26,55% MRQ |
| Institutionel værdi (lang) | $ 793.466 USD ($1000) |
Institutionelt ejerskab og aktionærer
EA Series Trust - Freedom 100 Emerging Markets ETF (US:FRDM) har 161 institutionelle ejere og aktionærer, der har indsendt 13D/G- eller 13F-formularer til Securities Exchange Commission (SEC). Disse institutioner har i alt 20,603,562 aktier. Største aktionærer omfatter Retirement Planning Group, Northwestern Mutual Wealth Management Co, Wells Fargo & Company/mn, Ellevest, Inc., Tanglewood Wealth Management, Inc., Willis Johnson & Associates, Inc., Aptus Capital Advisors, LLC, Guardian Wealth Advisors, Llc / Nc, Coyle Financial Counsel LLC, and Kathmere Capital Management, LLC .
EA Series Trust - Freedom 100 Emerging Markets ETF (BATS:FRDM) institutionel ejerskabsstruktur viser aktuelle positioner i virksomheden efter institutioner og fonde, samt seneste ændringer i positionsstørrelse. Større aktionærer kan omfatte individuelle investorer, investeringsforeninger, hedgefonde eller institutioner. Skema 13D angiver, at investoren besidder (eller besidder) mere end 5 % af virksomheden og har til hensigt (eller har til hensigt at) aktivt at forfølge en ændring i forretningsstrategi. Skema 13G indikerer en passiv investering på over 5%.
The share price as of September 9, 2025 is 42,74 / share. Previously, on September 10, 2024, the share price was 33,82 / share. This represents an increase of 26,37% over that period.

Fondens stemningsscore
Fund Sentiment Score (fka Ownership Accumulation Score) finder de aktier, der bliver mest købt af fonde. Det er resultatet af en sofistikeret, multi-faktor kvantitativ model, der identificerer virksomheder med de højeste niveauer af institutionel akkumulering. Scoringsmodellen bruger en kombination af den samlede stigning i oplyste ejere, ændringerne i porteføljeallokeringer i disse ejere og andre målinger. Tallet går fra 0 til 100, hvor højere tal indikerer et højere niveau af akkumulering for sine jævnaldrende, og 50 er gennemsnittet.
Opdateringsfrekvens: Dagligt
Se Ownership Explorer, som giver en liste over højest rangerende virksomheder.
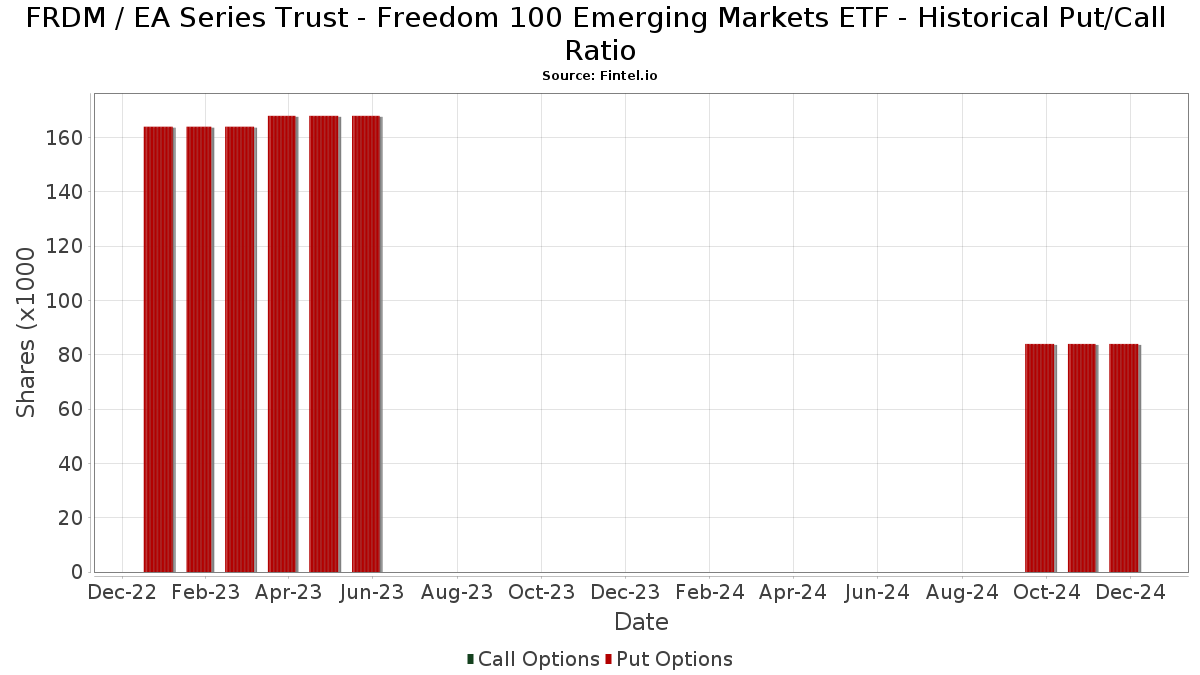
Institutionel Put/Call-forhold
Ud over at indberette standardaktie- og gældsudstedelser skal institutter med mere end 100 mill. aktiver under forvaltning også oplyse deres put- og call-optionsbeholdninger. Da salgsoptioner generelt indikerer negativ stemning, og købsoptioner indikerer positiv stemning, kan vi få en fornemmelse af den overordnede institutionelle stemning ved at plotte forholdet mellem put og kald. Diagrammet til højre viser det historiske put/call-forhold for dette instrument.
Brug af Put/Call Ratio som en indikator for investorernes stemning overvinder en af de vigtigste mangler ved at bruge totalt institutionelt ejerskab, som er, at en betydelig mængde af aktiver under forvaltning investeres passivt for at spore indekser. Passivt forvaltede fonde køber typisk ikke optioner, så indikatoren for put/call-forholdet følger mere nøje følelsen af aktivt forvaltede fonde.
13F og NPORT arkivering
Detaljer om 13F-arkivering er gratis. Detaljer om NP-ansøgninger kræver et premium-medlemskab. Grønne rækker angiver nye positioner. Røde rækker angiver lukkede positioner. Klik på linket ikon for at se den fulde transaktionshistorik.
Opgrader
for at låse premium-data op og eksportere til Excel ![]() .
.
| Fil dato | Kilde | Investor | Type | Gennemsnitlig pris (Øst) |
Aktier | Δ Aktier (%) |
Rapporteret Værdi ($1000) |
Δ Værdi (%) |
Port Alloc (%) |
|
|---|---|---|---|---|---|---|---|---|---|---|
| 2025-07-23 | 13F | Lansing Street Advisors | 37.230 | 25,76 | 1.504 | 45,03 | ||||
| 2025-08-06 | 13F | Ethos Financial Group, LLC | 51.537 | 74,11 | 2.082 | 115,31 | ||||
| 2025-08-13 | 13F | Millstone Evans Group, LLC | 634 | 0,32 | 26 | 13,64 | ||||
| 2025-08-13 | 13F | WCG Wealth Advisors LLC | 174.390 | -21,80 | 7.045 | -9,88 | ||||
| 2025-08-14 | 13F | Susquehanna International Group, Llp | 30.620 | 1.237 | ||||||
| 2025-08-07 | 13F | Mayport, Llc | 265.391 | 6,57 | 10.722 | 22,83 | ||||
| 2025-08-08 | 13F | Smithfield Trust Co | 1.328 | 0,00 | 0 | |||||
| 2025-07-25 | 13F | Commonwealth Financial Services, LLC | 259.753 | 0,84 | 10.494 | 16,24 | ||||
| 2025-07-30 | 13F | Brookstone Capital Management | 5.164 | -46,29 | 209 | -38,28 | ||||
| 2025-08-14 | 13F | Financial Network Wealth Advisors LLC | 2.119 | -32,06 | 86 | -22,02 | ||||
| 2025-07-24 | 13F | Us Bancorp \de\ | 3.858 | 21,59 | 156 | 39,64 | ||||
| 2025-08-14 | 13F | Raymond James Financial Inc | 454.117 | 16,51 | 18.346 | 34,29 | ||||
| 2025-08-07 | 13F | Sierra Ocean, Llc | 1.600 | 65 | ||||||
| 2025-07-17 | 13F | XY Planning Network, Inc. | 8.801 | 356 | ||||||
| 2025-08-13 | 13F | Jones Financial Companies Lllp | 25.396 | 157,30 | 1.019 | 194,51 | ||||
| 2025-04-25 | 13F | Smallwood Wealth Investment Management, LLC | 113.884 | 3,65 | 3.992 | 11,17 | ||||
| 2025-07-11 | 13F | Farther Finance Advisors, LLC | 236 | 293,33 | 10 | 350,00 | ||||
| 2025-08-14 | 13F | Guardian Wealth Advisors, Llc / Nc | 622.371 | 83,09 | 25.144 | 110,63 | ||||
| 2025-07-16 | 13F | Beaumont Financial Advisors, LLC | 220.075 | 14,20 | 8.891 | 31,64 | ||||
| 2025-08-14 | 13F | Mercer Global Advisors Inc /adv | 12.109 | -41,94 | 489 | -33,11 | ||||
| 2025-07-10 | 13F | Signal Advisors Wealth, LLC | 85.799 | 57,61 | 3.466 | 81,66 | ||||
| 2025-07-08 | 13F | Parallel Advisors, LLC | 5.317 | 0,00 | 215 | 15,05 | ||||
| 2025-08-12 | 13F | O'shaughnessy Asset Management, Llc | 935 | 3,89 | 38 | 19,35 | ||||
| 2025-03-12 | 13F/A | Private Capital Management Llc | 12.295 | 434 | ||||||
| 2025-08-11 | 13F | Citigroup Inc | 7.971 | 322 | ||||||
| 2025-07-10 | 13F | Redhawk Wealth Advisors, Inc. | 8.046 | 4,47 | 325 | 20,82 | ||||
| 2025-08-08 | 13F | Foundations Investment Advisors, LLC | 87.706 | 11,90 | 3.543 | 28,98 | ||||
| 2025-05-15 | 13F | Gts Securities Llc | 0 | -100,00 | 0 | |||||
| 2025-09-09 | 13F | Cambridge Financial Group, LLC | 6.883 | 0,61 | 278 | 15,83 | ||||
| 2025-07-28 | 13F | Harbour Investments, Inc. | 1.920 | 1,64 | 78 | 16,67 | ||||
| 2025-08-14 | 13F | Fmr Llc | 1.304 | -22,79 | 53 | -11,86 | ||||
| 2025-07-29 | 13F | Angeles Wealth Management, Llc | 30.072 | 1.215 | ||||||
| 2025-08-07 | 13F | 1620 Investment Advisors, Inc. | 62.574 | 4,01 | 2.528 | 19,88 | ||||
| 2025-08-14 | 13F | UBS Group AG | 813 | 33 | ||||||
| 2025-08-08 | 13F | Larson Financial Group LLC | 86 | -86,11 | 3 | -85,71 | ||||
| 2025-07-17 | 13F | Sound Income Strategies, LLC | 1 | 0 | ||||||
| 2025-07-21 | 13F | Tanglewood Wealth Management, Inc. | 1.107.772 | 48,58 | 44.754 | 71,24 | ||||
| 2025-07-30 | 13F | Strategic Blueprint, LLC | 0 | -100,00 | 0 | |||||
| 2025-07-23 | 13F | Quarry Hill Advisors, Llc | 134.479 | -1,85 | 5.433 | 13,12 | ||||
| 2025-08-06 | 13F | Prospera Financial Services Inc | 24.986 | 1.009 | ||||||
| 2025-08-07 | 13F | Resources Investment Advisors, LLC. | 160.176 | -0,73 | 6.471 | 14,43 | ||||
| 2025-08-14 | 13F | Bank Of America Corp /de/ | 12.431 | -6,56 | 502 | 7,73 | ||||
| 2025-08-13 | 13F | Willis Johnson & Associates, Inc. | 982.672 | 4,38 | 39.700 | 20,31 | ||||
| 2025-08-14 | 13F | Great Valley Advisor Group, Inc. | 178.208 | -1,74 | 7.200 | 13,25 | ||||
| 2025-08-12 | 13F | Frontier Asset Management, LLC | 7.294 | -90,97 | 295 | -89,61 | ||||
| 2025-08-13 | 13F | Baird Financial Group, Inc. | 7.940 | 321 | ||||||
| 2025-08-15 | 13F | Koesten, Hirschmann & Crabtree, INC. | 19 | 0,00 | 1 | |||||
| 2025-07-23 | 13F | Heck Capital Advisors, LLC | 249.563 | 0,22 | 10.082 | 15,51 | ||||
| 2025-08-12 | 13F | Jpmorgan Chase & Co | 184 | 0,00 | 7 | 16,67 | ||||
| 2025-08-06 | 13F | SOUTH STATE Corp | 25.440 | -15,02 | 1.028 | -2,10 | ||||
| 2025-07-11 | 13F | William Howard & Co Financial Advisors Inc | 16.137 | 0,70 | 652 | 16,04 | ||||
| 2025-08-14 | 13F | Jane Street Group, Llc | 46.326 | 1.872 | ||||||
| 2025-07-24 | 13F | IFP Advisors, Inc | 24.877 | 827,55 | 1.005 | 969,15 | ||||
| 2025-08-14 | 13F | Integrated Wealth Concepts LLC | 250.227 | 461,77 | 10.109 | 547,60 | ||||
| 2025-07-22 | 13F | Yardley Wealth Management LLC | 360.025 | -1,64 | 15 | 16,67 | ||||
| 2025-08-13 | 13F | EverSource Wealth Advisors, LLC | 30 | 0,00 | 1 | 0,00 | ||||
| 2025-07-08 | 13F | Prism Advisors, Inc. | 28.337 | -39,00 | 1.145 | -29,73 | ||||
| 2025-04-23 | 13F | Mascagni Wealth Management, Inc. | 0 | -100,00 | 0 | -100,00 | ||||
| 2025-07-18 | 13F/A | MJT & Associates Financial Advisory Group, Inc. | 685 | 28 | ||||||
| 2025-08-12 | 13F | Tableaux Llc | 15.000 | -86,72 | 15 | -99,62 | ||||
| 2025-08-13 | 13F | Northwestern Mutual Wealth Management Co | 1.438.388 | 12,01 | 58.111 | 29,10 | ||||
| 2025-08-19 | 13F | Advisory Services Network, LLC | 47.054 | 21,55 | 1.896 | 39,75 | ||||
| 2025-08-05 | 13F | Lord & Richards Wealth Management, LLC | 21.950 | 146,68 | 887 | 184,89 | ||||
| 2025-08-15 | 13F | Kestra Advisory Services, LLC | 362.962 | -0,75 | 14.664 | 14,39 | ||||
| 2025-08-15 | 13F | Morgan Stanley | 139.220 | -29,31 | 5.624 | -18,53 | ||||
| 2025-07-25 | 13F | Cwm, Llc | 31.665 | -27,02 | 1 | 0,00 | ||||
| 2025-07-23 | 13F | High Note Wealth, LLC | 178.666 | 186,57 | 7.218 | 230,34 | ||||
| 2025-07-11 | 13F/A | Umb Bank N A/mo | 200 | 0,00 | 8 | 14,29 | ||||
| 2025-05-15 | 13F | Bank Of America Corp /de/ | Put | 0 | -100,00 | 0 | -100,00 | |||
| 2025-08-11 | 13F | TD Waterhouse Canada Inc. | 1.632 | 0,00 | 66 | 14,04 | ||||
| 2025-07-21 | 13F | Investment Planning Advisors, Inc. | 416.007 | 107,51 | 16.807 | 139,16 | ||||
| 2025-05-13 | 13F/A | Magnolia Capital Advisors Llc | 26.757 | 3,61 | 874 | -4,17 | ||||
| 2025-08-12 | 13F | CIBC Private Wealth Group, LLC | 193 | 0,00 | 8 | 40,00 | ||||
| 2025-07-16 | 13F | Magnus Financial Group LLC | 32.105 | -0,12 | 1.297 | 15,19 | ||||
| 2025-07-28 | 13F | Mutual Advisors, LLC | 25.267 | 4,53 | 1.031 | 18,53 | ||||
| 2025-07-03 | 13F | TrueWealth Advisors, LLC | 128.729 | -4,52 | 5.201 | 10,03 | ||||
| 2025-08-14 | 13F | Mariner, LLC | 163.305 | -10,48 | 6.598 | 3,17 | ||||
| 2025-08-14 | 13F | Wells Fargo & Company/mn | 1.264.419 | 228,60 | 51.083 | 278,75 | ||||
| 2025-07-31 | 13F | Trademark Financial Management, LLC | 72.304 | 270,13 | 2.921 | 327,05 | ||||
| 2025-08-08 | 13F | Islay Capital Management, Llc | 71.613 | 4,53 | 2.893 | 20,49 | ||||
| 2025-08-13 | 13F | Colonial Trust Co / SC | 3.000 | 0,00 | 121 | 15,24 | ||||
| 2025-08-13 | 13F | Level Four Advisory Services, Llc | 23.568 | 0,58 | 952 | 15,96 | ||||
| 2025-08-14 | 13F | Comerica Bank | 2.401 | 0,00 | 97 | 15,48 | ||||
| 2025-07-21 | 13F | Ameritas Advisory Services, LLC | 2.133 | 86 | ||||||
| 2025-08-11 | 13F | HighTower Advisors, LLC | 396.795 | 8,89 | 16.030 | 25,50 | ||||
| 2025-07-15 | 13F | Mather Group, Llc. | 21.469 | 0,00 | 867 | 15,29 | ||||
| 2025-07-28 | 13F | Lunt Capital Management, Inc. | 62.234 | 0,81 | 2.514 | 16,23 | ||||
| 2025-08-06 | 13F | Savant Capital, LLC | 10.248 | 414 | ||||||
| 2025-08-14 | 13F | L2 Asset Management, LLC | 8.816 | 356 | ||||||
| 2025-07-17 | 13F | Janney Montgomery Scott LLC | 270.737 | 1,50 | 11 | 11,11 | ||||
| 2025-07-23 | 13F | Clear Creek Financial Management, LLC | 59.183 | -2,31 | 2.391 | 11,73 | ||||
| 2025-07-17 | 13F | HB Wealth Management, LLC | 5.300 | 214 | ||||||
| 2025-08-08 | 13F | Bailard, Inc. | 5.200 | 210 | ||||||
| 2025-08-26 | 13F/A | Thrivent Financial For Lutherans | 72.481 | -87,76 | 3 | -90,00 | ||||
| 2025-08-27 | 13F/A | Brinker Capital Investments, LLC | 55.000 | 0,00 | 2.222 | 15,31 | ||||
| 2025-05-15 | 13F/A | Orion Portfolio Solutions, LLC | 55.000 | 0,00 | 1.928 | 7,23 | ||||
| 2025-07-23 | 13F | L.K. Benson & Company, P.C. | 14.206 | 17,03 | 574 | 34,82 | ||||
| 2025-05-02 | 13F | Transcendent Capital Group LLC | 0 | -100,00 | 0 | |||||
| 2025-08-15 | 13F | Global View Capital Management LLC | 20.857 | -10,17 | 843 | 3,57 | ||||
| 2025-07-11 | 13F | SILVER OAK SECURITIES, Inc | 24.654 | 0,94 | 996 | 16,08 | ||||
| 2025-08-14 | 13F | CoreCap Advisors, LLC | 450 | 18 | ||||||
| 2025-08-14 | 13F | Coyle Financial Counsel LLC | 523.087 | 5,48 | 21.133 | 21,57 | ||||
| 2025-05-12 | 13F | Independent Advisor Alliance | 0 | -100,00 | 0 | |||||
| 2025-07-29 | 13F | Financial Guidance Group, Inc. | 31.969 | 1.292 | ||||||
| 2025-07-31 | 13F | Longview Financial Advisors, Inc. | 40.180 | 13,59 | 1.623 | 30,99 | ||||
| 2025-07-16 | 13F | Kathmere Capital Management, LLC | 519.600 | 0,78 | 20.992 | 16,15 | ||||
| 2025-07-25 | 13F | Pandora Wealth, Inc. | 45.188 | 0,65 | 1.826 | 16,02 | ||||
| 2025-08-12 | 13F | Proequities, Inc. | 0 | 0 | ||||||
| 2025-08-14 | 13F | Marshall Investment Management, Llc | 0 | -100,00 | 0 | |||||
| 2025-08-15 | 13F | Captrust Financial Advisors | 20.746 | 37,98 | 838 | 59,01 | ||||
| 2025-07-15 | 13F | Fifth Third Bancorp | 0 | -100,00 | 0 | |||||
| 2025-08-05 | 13F | Bank of New York Mellon Corp | 7.427 | 15,52 | 300 | 33,33 | ||||
| 2025-08-12 | 13F | Maripau Wealth Management Llc | 44.870 | 47,80 | 1.826 | 71,52 | ||||
| 2025-08-14 | 13F | Mml Investors Services, Llc | 55.313 | 275,44 | 2 | |||||
| 2025-08-18 | 13F/A | National Bank Of Canada /fi/ | 4.992 | 5,45 | 202 | 21,82 | ||||
| 2025-07-25 | 13F | Envestnet Portfolio Solutions, Inc. | 0 | -100,00 | 0 | |||||
| 2025-08-08 | 13F | Avantax Advisory Services, Inc. | 10.432 | 18,05 | 421 | 36,25 | ||||
| 2025-08-11 | 13F | Principal Securities, Inc. | 11.689 | 1.111,30 | 472 | 1.422,58 | ||||
| 2025-08-14 | 13F | Colony Group, LLC | 60.967 | -14,77 | 2.463 | -1,79 | ||||
| 2025-07-17 | 13F | Beacon Capital Management, LLC | 48 | 2,13 | 2 | 0,00 | ||||
| 2025-07-29 | 13F | Koshinski Asset Management, Inc. | 5.432 | 219 | ||||||
| 2025-05-06 | 13F | Venturi Wealth Management, LLC | 0 | -100,00 | 0 | |||||
| 2025-07-11 | 13F | Skyline Advisors, Inc. | 8.717 | 0,68 | 352 | 16,17 | ||||
| 2025-07-17 | 13F | Smith Anglin Financial, LLC | 11.844 | -5,87 | 478 | 8,39 | ||||
| 2025-08-13 | 13F | Townsquare Capital Llc | 0 | -100,00 | 0 | |||||
| 2025-08-07 | 13F | Tfo-tdc, Llc | 10.000 | 404 | ||||||
| 2025-08-07 | 13F | New England Private Wealth Advisors LLC | 113.580 | 1,62 | 4.597 | 17,33 | ||||
| 2025-08-08 | 13F | Creative Planning | 13.532 | 28,10 | 547 | 47,57 | ||||
| 2025-07-31 | 13F | Stegent Equity Advisors, Inc. | 11.763 | 0,00 | 475 | 15,29 | ||||
| 2025-04-21 | 13F | Nelson, Van Denburg & Campbell Wealth Management Group, LLC | 0 | -100,00 | 0 | |||||
| 2025-07-14 | 13F | AdvisorNet Financial, Inc | 1.441 | -66,57 | 58 | -61,59 | ||||
| 2025-08-06 | 13F | Stokes Family Office, LLC | 226.851 | -0,38 | 9.165 | 14,81 | ||||
| 2025-08-13 | 13F | Northern Trust Corp | 5.161 | 209 | ||||||
| 2025-05-14 | 13F | Flow Traders U.s. Llc | 0 | -100,00 | 0 | |||||
| 2025-08-13 | 13F | New Harbor Financial Group, LLC | 5.589 | -4,61 | 226 | 9,76 | ||||
| 2025-08-12 | 13F | Watchman Group, Inc. | 190.367 | -0,70 | 7.691 | 14,45 | ||||
| 2025-07-09 | 13F | Dynamic Advisor Solutions LLC | 10.109 | -3,03 | 408 | 11,78 | ||||
| 2025-08-19 | 13F | Anchor Investment Management, LLC | 5.010 | -8,98 | 202 | 5,21 | ||||
| 2025-09-04 | 13F/A | Advisor Group Holdings, Inc. | 22.443 | -37,71 | 907 | -28,32 | ||||
| 2025-04-16 | 13F | Fortitude Family Office, LLC | 0 | -100,00 | 0 | |||||
| 2025-04-10 | 13F | Clarus Wealth Advisors | 0 | -100,00 | 0 | |||||
| 2025-08-11 | 13F | Rothschild Investment Llc | 0 | -100,00 | 0 | |||||
| 2025-07-31 | 13F | Cambridge Investment Research Advisors, Inc. | 23.269 | 29,61 | 1 | |||||
| 2025-07-24 | 13F | Capital Advisors, Ltd. LLC | 8.583 | 21,31 | 0 | |||||
| 2025-08-06 | 13F | Commonwealth Equity Services, Llc | 72.132 | 5,36 | 3 | 0,00 | ||||
| 2025-08-14 | 13F | IHT Wealth Management, LLC | 7.729 | -3,04 | 312 | 11,83 | ||||
| 2025-04-28 | 13F | Strategic Financial Concepts, LLC | 0 | -100,00 | 0 | -100,00 | ||||
| 2025-08-14 | 13F | GWM Advisors LLC | 28.306 | 3,23 | 1.144 | 18,94 | ||||
| 2025-08-12 | 13F | Allen Capital Group, LLC | 33.656 | 9,53 | 1.360 | 26,18 | ||||
| 2025-08-18 | 13F | Geneos Wealth Management Inc. | 89.981 | 402,43 | 3.635 | 479,74 | ||||
| 2025-08-01 | 13F | Rossby Financial, LCC | 196.276 | 1,86 | 7.930 | 14,43 | ||||
| 2025-08-13 | 13F | Lumbard & Kellner, LLC | 154.307 | 97,17 | 6.234 | 127,27 | ||||
| 2025-08-01 | 13F | Envestnet Asset Management Inc | 356.976 | 527,54 | 14.422 | 623,58 | ||||
| 2025-08-05 | 13F | Ellevest, Inc. | 1.140.983 | 458,64 | 46.096 | 543,96 | ||||
| 2025-07-30 | 13F | Mills Wealth Advisors LLC | 5.280 | 213 | ||||||
| 2025-07-25 | 13F | We Are One Seven, LLC | 10.611 | -3,01 | 429 | 11,75 | ||||
| 2025-08-08 | 13F | Cetera Investment Advisers | 11.387 | -11,69 | 460 | 2,00 | ||||
| 2025-08-19 | 13F | Asset Dedication, LLC | 1.121 | 0,00 | 45 | 15,38 | ||||
| 2025-06-27 | NP | GIAX - Nicholas Global Equity and Income ETF | 57.776 | 22,11 | 2.089 | 29,69 | ||||
| 2025-08-04 | 13F | Center for Financial Planning, Inc. | 650 | 48,40 | 26 | 73,33 | ||||
| 2025-08-14 | 13F | Toroso Investments, LLC | 60.830 | 5,29 | 2.458 | 21,33 | ||||
| 2025-08-15 | 13F | First Heartland Consultants, Inc. | 362.182 | 14.632 | ||||||
| 2025-04-30 | 13F | Bull Oak Capital, LLC | 0 | -100,00 | 0 | |||||
| 2025-05-15 | 13F | Old Mission Capital Llc | 0 | -100,00 | 0 | |||||
| 2025-08-14 | 13F | Citadel Advisors Llc | 0 | -100,00 | 0 | |||||
| 2025-08-14 | 13F | Royal Bank Of Canada | 729 | -98,73 | 29 | -98,56 | ||||
| 2025-07-09 | 13F | Intelligence Driven Advisers, LLC | 422.619 | 25,95 | 17.074 | 45,17 | ||||
| 2025-08-01 | 13F | SwitchPoint Financial Planning, LLC | 5.644 | 228 | ||||||
| 2025-07-25 | 13F | Stephens Consulting, LLC | 187.682 | 14,25 | 7.582 | 31,70 | ||||
| 2025-08-11 | 13F | Aptus Capital Advisors, LLC | 658.174 | 91,48 | 26.590 | 120,70 | ||||
| 2025-07-15 | 13F | EWG Elevate Inc. | 93.518 | 3.778 | ||||||
| 2025-08-07 | 13F | Gs Investments, Inc. | 8.055 | 0,00 | 325 | 15,25 | ||||
| 2025-08-06 | 13F | AE Wealth Management LLC | 341 | -77,67 | 14 | -75,47 | ||||
| 2025-07-16 | 13F | ORG Partners LLC | 1.000 | 0,00 | 40 | 14,29 | ||||
| 2025-08-14 | 13F | Ancora Advisors, LLC | 3.371 | 28,47 | 136 | 49,45 | ||||
| 2025-08-12 | 13F | LPL Financial LLC | 227.106 | 25,38 | 9.175 | 44,51 | ||||
| 2025-05-15 | 13F | CAPROCK Group, Inc. | 37.747 | 1.333 | ||||||
| 2025-07-30 | 13F | Retirement Planning Group | 2.386.771 | 1,20 | 96.426 | 16,64 | ||||
| 2025-08-14 | 13F | Arete Wealth Advisors, LLC | 12.874 | -5,93 | 1 | |||||
| 2025-07-18 | 13F | Warren Street Wealth Advisors, LLC | 5.828 | 0,00 | 235 | 15,20 | ||||
| 2025-08-12 | 13F | Ameritas Investment Partners, Inc. | 94.884 | 5,72 | 3.833 | 21,88 | ||||
| 2025-07-22 | 13F | Wealthcare Advisory Partners LLC | 45.526 | 88,34 | 1.839 | 117,12 |