Grundlæggende statistik
| Institutionelle aktier (lange) | 58.825.629 - 36,74% (ex 13D/G) - change of -0,91MM shares -1,52% MRQ |
| Institutionel værdi (lang) | $ 1.290.087 USD ($1000) |
Institutionelt ejerskab og aktionærer
Firefly Aerospace Inc. (US:FLY) har 168 institutionelle ejere og aktionærer, der har indsendt 13D/G- eller 13F-formularer til Securities Exchange Commission (SEC). Disse institutioner har i alt 58,825,629 aktier. Største aktionærer omfatter Ae Industrial Partners, Lp, Vanguard Group Inc, Hudson Bay Capital Management LP, UBS Group AG, BlackRock, Inc., Capital World Investors, Temasek Holdings (Private) Ltd, Price T Rowe Associates Inc /md/, Wcm Investment Management, Llc, and Jpmorgan Chase & Co .
Firefly Aerospace Inc. (NasdaqGM:FLY) institutionel ejerskabsstruktur viser aktuelle positioner i virksomheden efter institutioner og fonde, samt seneste ændringer i positionsstørrelse. Større aktionærer kan omfatte individuelle investorer, investeringsforeninger, hedgefonde eller institutioner. Skema 13D angiver, at investoren besidder (eller besidder) mere end 5 % af virksomheden og har til hensigt (eller har til hensigt at) aktivt at forfølge en ændring i forretningsstrategi. Skema 13G indikerer en passiv investering på over 5%.
The share price as of April 24, 2026 is 35,13 / share. Previously, on August 7, 2025, the share price was 60,35 / share. This represents a decline of 41,79% over that period.
Fondens stemningsscore
Fund Sentiment Score (fka Ownership Accumulation Score) finder de aktier, der bliver mest købt af fonde. Det er resultatet af en sofistikeret, multi-faktor kvantitativ model, der identificerer virksomheder med de højeste niveauer af institutionel akkumulering. Scoringsmodellen bruger en kombination af den samlede stigning i oplyste ejere, ændringerne i porteføljeallokeringer i disse ejere og andre målinger. Tallet går fra 0 til 100, hvor højere tal indikerer et højere niveau af akkumulering for sine jævnaldrende, og 50 er gennemsnittet.
Opdateringsfrekvens: Dagligt
Se Ownership Explorer, som giver en liste over højest rangerende virksomheder.
AI+ Ask Fintel’s AI assistant about Firefly Aerospace Inc..
Select a question to share a public post with an AI-crafted answer.
Thinking of good questions…
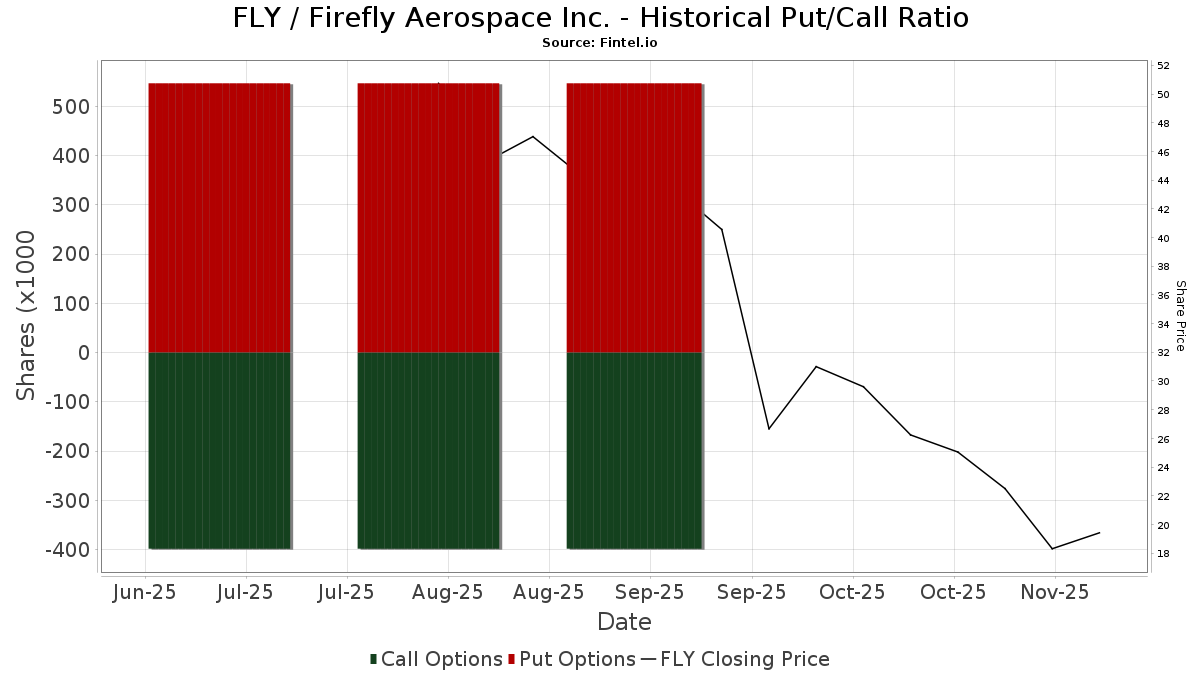
Institutionel Put/Call-forhold
Ud over at indberette standardaktie- og gældsudstedelser skal institutter med mere end 100 mill. aktiver under forvaltning også oplyse deres put- og call-optionsbeholdninger. Da salgsoptioner generelt indikerer negativ stemning, og købsoptioner indikerer positiv stemning, kan vi få en fornemmelse af den overordnede institutionelle stemning ved at plotte forholdet mellem put og kald. Diagrammet til højre viser det historiske put/call-forhold for dette instrument.
Brug af Put/Call Ratio som en indikator for investorernes stemning overvinder en af de vigtigste mangler ved at bruge totalt institutionelt ejerskab, som er, at en betydelig mængde af aktiver under forvaltning investeres passivt for at spore indekser. Passivt forvaltede fonde køber typisk ikke optioner, så indikatoren for put/call-forholdet følger mere nøje følelsen af aktivt forvaltede fonde.
13D/G-arkivering
Vi præsenterer 13D/G ansøgninger separat fra 13F ansøgninger på grund af den forskellige behandling af SEC. 13D/G-ansøgninger kan indgives af grupper af investorer (med én ledende), hvorimod 13F-ansøgninger ikke kan. Dette resulterer i situationer, hvor en investor kan indsende en 13D/G, der rapporterer én værdi for de samlede aktier (der repræsenterer alle de aktier, der ejes af investorgruppen), men derefter indsender en 13F, der rapporterer en anden værdi for de samlede aktier (der udelukkende repræsenterer deres egne) ejendomsret). Det betyder, at aktieejerskab af 13D/G-arkiver og 13F-arkiveringer ofte ikke er direkte sammenlignelige, så vi præsenterer dem separat.
Bemærk: Fra den 16. maj 2021 viser vi ikke længere ejere, der ikke har indsendt en 13D/G inden for det seneste år. Tidligere viste vi den fulde historie af 13D/G-arkiver. Generelt skal enheder, der er forpligtet til at indgive 13D/G-ansøgninger, indgive mindst årligt, før de indsender en afsluttende ansøgning. Dog forlader fonde nogle gange positioner uden at indsende en afsluttende ansøgning (dvs. de afvikler), så visning af den fulde historie resulterede nogle gange i forvirring om det nuværende ejerskab. For at undgå forvirring viser vi nu kun 'aktuelle' ejere - det vil sige - ejere, der har anmeldt inden for det seneste år.
Upgrade to unlock premium data.
| Fil dato | Form | Investor | Forrige Aktier |
Seneste Aktier |
Δ Aktier (Procent) |
Ejendomsret (Procent) |
Δ Ejerskab (Procent) |
|
|---|---|---|---|---|---|---|---|---|
| 2026-02-02 | AEROEQUITY GP, LLC | 58,805,752 | 58,805,752 | 0.00 | 36.90 | 0.00 | ||
| 2025-11-10 | Astera Institute | 13,081,389 | 8.90 |
13F og NPORT arkivering
Detaljer om 13F-arkivering er gratis. Detaljer om NP-ansøgninger kræver et premium-medlemskab. Grønne rækker angiver nye positioner. Røde rækker angiver lukkede positioner. Klik på linket ikon for at se den fulde transaktionshistorik.
Opgrader
for at låse premium-data op og eksportere til Excel ![]() .
.
| Fil dato | Kilde | Investor | Type | Gennemsnitlig pris (Øst) |
Aktier | Δ Aktier (%) |
Rapporteret Værdi ($1000) |
Δ Værdi (%) |
Port Alloc (%) |
|
|---|---|---|---|---|---|---|---|---|---|---|
| 2026-02-17 | 13F | Davidson Kempner Capital Management Lp | 0 | -100,00 | 0 | -100,00 | ||||
| 2026-04-21 | 13F | Founders Capital Management | 0 | -100,00 | 0 | |||||
| 2026-01-29 | 13F | Vanguard Group Inc | 1.962.912 | 7,76 | 43.910 | -17,79 | ||||
| 2026-02-17 | 13F | Price T Rowe Associates Inc /md/ | 869.939 | -53,26 | 19 | -64,81 | ||||
| 2026-02-13 | 13F | Hudson Bay Capital Management LP | 1.787.904 | -1,32 | 39.460 | -22,19 | ||||
| 2026-04-15 | 13F | Activest Wealth Management | 7.016 | 200 | ||||||
| 2026-02-13 | 13F | Hudson Bay Capital Management LP | Call | 220.000 | 4.921 | |||||
| 2026-02-18 | 13F | State of Tennessee, Treasury Department | 0 | -100,00 | 0 | -100,00 | ||||
| 2026-02-12 | 13F | Nuveen, LLC | 25.402 | 568 | ||||||
| 2026-02-10 | 13F | Rothschild Investment Llc | 30 | 1 | ||||||
| 2025-11-12 | 13F | Nomura Asset Management Co Ltd | 0 | 0 | ||||||
| 2026-02-03 | 13F | Mitsubishi UFJ Kokusai Asset Management Co., Ltd. | 124.900 | 478,24 | 2.968 | 368,72 | ||||
| 2026-02-17 | 13F | TCG Advisory Services, LLC | 0 | -100,00 | 0 | -100,00 | ||||
| 2026-02-12 | 13F | New York State Common Retirement Fund | 3.400 | 76 | ||||||
| 2026-04-22 | 13F | Penney Financial, LLC | 22.793 | 649 | ||||||
| 2026-02-17 | 13F | Raymond James Financial Inc | 120.259 | 2.690 | ||||||
| 2026-02-17 | 13F | MIRAE ASSET GLOBAL ETFS HOLDINGS Ltd. | 9.996 | 224 | ||||||
| 2026-02-17 | 13F | Citadel Advisors Llc | 309.472 | -47,20 | 6.923 | -59,72 | ||||
| 2026-01-20 | 13F | Stratos Wealth Partners, LTD. | 48.721 | 1.090 | ||||||
| 2026-01-30 | 13F | Us Bancorp \de\ | 15 | 0,00 | 0 | |||||
| 2026-02-13 | 13F | Morgan Stanley | 173.343 | 81,78 | 3.878 | 38,71 | ||||
| 2026-02-17 | 13F | Citadel Advisors Llc | Put | 326.300 | 121,22 | 7.299 | 68,80 | |||
| 2026-02-17 | 13F | Citadel Advisors Llc | Call | 286.400 | 43,85 | 6.407 | 9,75 | |||
| 2026-02-17 | 13F | Sandia Investment Management LP | 3.205 | -35,90 | 72 | -51,37 | ||||
| 2026-04-21 | 13F | Huntleigh Advisors, Inc. | 46.546 | 2,82 | 1.325 | 30,93 | ||||
| 2026-02-23 | 13F | Virtu Financial LLC | 14.824 | 103,96 | 0 | |||||
| 2026-04-16 | 13F | SG Americas Securities, LLC | 19.065 | 96,12 | 1 | |||||
| 2026-01-29 | 13F | Rakuten Securities, Inc. | 3.081 | 69 | ||||||
| 2026-02-13 | 13F | Walleye Capital LLC | 261.211 | -0,82 | 5.843 | -24,33 | ||||
| 2026-02-17 | 13F | D. E. Shaw & Co., Inc. | 0 | -100,00 | 0 | -100,00 | ||||
| 2026-02-17 | 13F | Fmr Llc | 301.597 | -58,57 | 6.747 | -68,39 | ||||
| 2026-02-11 | 13F | Deutsche Bank Ag\ | 25.686 | -29,37 | 575 | -46,15 | ||||
| 2026-02-13 | 13F | Walleye Capital LLC | Call | 9.900 | 221 | |||||
| 2026-02-13 | 13F | Walleye Capital LLC | Put | 5.300 | 119 | |||||
| 2026-02-06 | 13F | GPS Wealth Strategies Group, LLC | 0 | -100,00 | 0 | -100,00 | ||||
| 2026-02-17 | 13F | Balyasny Asset Management Llc | 457.295 | 10.230 | ||||||
| 2026-02-09 | 13F | Annis Gardner Whiting Capital Advisors, LLC | 9 | 0,00 | 0 | |||||
| 2026-01-29 | 13F | Concord Wealth Partners | 23 | 1 | ||||||
| 2026-02-10 | 13F | Bnp Paribas Arbitrage, Sa | 4.500 | 414,29 | 101 | 300,00 | ||||
| 2026-02-17 | 13F | Susquehanna International Group, Llp | Call | 621.300 | 578,28 | 13.898 | 417,62 | |||
| 2026-04-15 | 13F | Tema Etfs Llc | 1.708 | 49 | ||||||
| 2026-02-17 | 13F | Burkehill Global Management, LP | 125.000 | 0,00 | 2.796 | -23,71 | ||||
| 2026-02-17 | 13F | Susquehanna International Group, Llp | 419.187 | 126,93 | 9.377 | 73,17 | ||||
| 2026-02-17 | 13F | Susquehanna International Group, Llp | Put | 506.900 | 77,36 | 11.339 | 35,33 | |||
| 2026-02-12 | 13F | CIBC Private Wealth Group, LLC | 3.300 | 266,67 | 74 | 180,77 | ||||
| 2026-01-27 | 13F | Zurcher Kantonalbank (Zurich Cantonalbank) | 0 | -100,00 | 0 | -100,00 | ||||
| 2026-02-17 | 13F | Woodline Partners LP | 0 | -100,00 | 0 | -100,00 | ||||
| 2026-03-12 | 13F/A | Peak6 Llc | Call | 132.300 | 2.960 | |||||
| 2026-02-11 | 13F | Prestige Wealth Management Group LLC | 0 | -100,00 | 0 | |||||
| 2026-04-07 | 13F | Signaturefd, Llc | 22.838 | 18.170,40 | 650 | 32.400,00 | ||||
| 2026-04-06 | 13F | GAMMA Investing LLC | 326 | 757,89 | 9 | |||||
| 2026-04-07 | 13F | Farther Finance Advisors, LLC | 685 | 356,67 | 20 | 566,67 | ||||
| 2026-02-17 | 13F | Northern Trust Corp | 155.244 | 319,60 | 3.473 | 220,30 | ||||
| 2026-02-10 | 13F | Goldman Sachs Group Inc | 128.787 | 31,79 | 2.881 | 0,52 | ||||
| 2026-02-10 | 13F | Norges Bank | 360.000 | 8.053 | ||||||
| 2026-02-13 | 13F | MAI Capital Management | 5 | 0,00 | 0 | |||||
| 2026-02-17 | 13F | Two Sigma Investments, Lp | 435.873 | 1.033,05 | 9.750 | 765,13 | ||||
| 2026-02-17 | 13F | Ameriprise Financial Inc | 44.218 | -22,25 | 989 | -40,67 | ||||
| 2026-01-28 | 13F | Teacher Retirement System Of Texas | 130.831 | 0,00 | 2.927 | -23,70 | ||||
| 2026-02-17 | 13F | Caption Management, LLC | Call | 18.800 | 421 | |||||
| 2026-02-11 | 13F | Franklin Resources Inc | 0 | -100,00 | 0 | -100,00 | ||||
| 2026-02-11 | 13F | Capital Research Global Investors | 0 | -100,00 | 0 | -100,00 | ||||
| 2026-02-13 | 13F | Rhumbline Advisers | 23.922 | 535 | ||||||
| 2026-02-12 | 13F | Marex Group plc | 204.130 | 4.566 | ||||||
| 2026-02-11 | 13F | Resolute Advisors LLC | 10.700 | 239 | ||||||
| 2026-02-13 | 13F | Healthcare Of Ontario Pension Plan Trust Fund | 240.000 | -14,29 | 5.369 | -34,61 | ||||
| 2026-02-10 | 13F | Td Asset Management Inc | 0 | -100,00 | 0 | -100,00 | ||||
| 2026-02-17 | 13F | Millennium Management Llc | 263.506 | -18,37 | 5.895 | -37,72 | ||||
| 2026-02-03 | 13F | Harel Insurance Investments & Financial Services Ltd. | 10.000 | 0,00 | 0 | |||||
| 2026-04-14 | 13F | Tradewinds Capital Management, LLC | 1.824 | 52 | ||||||
| 2026-02-13 | 13F | Alyeska Investment Group, L.P. | 211.366 | 89,79 | 4.728 | 44,81 | ||||
| 2026-02-17 | 13F | Lykos Global Management, LP | 20.000 | 447 | ||||||
| 2026-02-17 | 13F | Jones Financial Companies Lllp | 4.646 | 1.050,00 | 104 | 635,71 | ||||
| 2026-02-13 | 13F | MYDA Advisors LLC | 25.000 | 559 | ||||||
| 2026-04-24 | 13F | Strs Ohio | 3.800 | 0,00 | 108 | 27,06 | ||||
| 2026-02-09 | 13F | Huntington National Bank | 501 | 11 | ||||||
| 2026-02-11 | 13F | Ameritas Investment Partners, Inc. | 1.745 | 39 | ||||||
| 2026-02-09 | 13F | Legal & General Group Plc | 2.133 | 225,15 | 48 | 147,37 | ||||
| 2026-02-17 | 13F | Bank Of America Corp /de/ | 191.962 | 61,87 | 4.294 | 23,50 | ||||
| 2025-11-14 | 13F | Wolverine Trading, Llc | Call | 60.600 | 2.240 | |||||
| 2026-04-01 | 13F | Bangor Savings Bank | 125 | 0,00 | 4 | 50,00 | ||||
| 2025-11-14 | 13F | Wolverine Trading, Llc | Put | 35.700 | 1.319 | |||||
| 2026-02-17 | 13F | Armistice Capital, Llc | 0 | -100,00 | 0 | -100,00 | ||||
| 2026-02-17 | 13F | Liontrust Investment Partners LLP | 114.099 | 86,94 | 2.552 | 42,65 | ||||
| 2026-02-11 | 13F | Ae Industrial Partners, Lp | 35.227.754 | -2,91 | 788.045 | -25,93 | ||||
| 2026-02-17 | 13F | Caisse De Depot Et Placement Du Quebec | 0 | -100,00 | 0 | -100,00 | ||||
| 2026-04-16 | 13F | REX Advisers, LLC | Put | 58.800 | 4 | |||||
| 2026-01-22 | 13F | Massachusetts Financial Services Co /ma/ | 0 | -100,00 | 0 | -100,00 | ||||
| 2026-02-17 | 13F | Scarborough Advisors, LLC | 25 | 0,00 | 1 | |||||
| 2026-02-11 | 13F | Parallel Advisors, LLC | 593 | 537,63 | 13 | 550,00 | ||||
| 2026-02-09 | 13F | Wcm Investment Management, Llc | 681.341 | 3,05 | 15.480 | -36,65 | ||||
| 2026-02-11 | 13F | LPL Financial LLC | 44.440 | 314,09 | 994 | 216,56 | ||||
| 2026-04-16 | 13F | REX Advisers, LLC | Call | 58.800 | 197 | |||||
| 2026-04-16 | 13F | REX Advisers, LLC | 29.400 | 837 | ||||||
| 2026-02-17 | 13F | LuminArx Capital Management LP | 107.564 | 2.406 | ||||||
| 2026-04-15 | 13F | Fortitude Family Office, LLC | 170 | 0,00 | 5 | 33,33 | ||||
| 2026-02-13 | 13F | Needham Investment Management Llc | 60.000 | 50,00 | 1.342 | 14,51 | ||||
| 2026-02-13 | 13F | Quarry LP | 0 | -100,00 | 0 | -100,00 | ||||
| 2026-02-12 | 13F | Loomis Sayles & Co L P | 0 | -100,00 | 0 | |||||
| 2026-04-14 | 13F | Davidson Capital Management Inc. | 0 | -100,00 | 0 | |||||
| 2026-02-12 | 13F | MetLife Investment Management, LLC | 12.334 | 276 | ||||||
| 2026-04-23 | 13F | Oppenheimer & Co Inc | 29.115 | 829 | ||||||
| 2026-02-05 | 13F | Allworth Financial LP | 400 | 9 | ||||||
| 2026-02-06 | 13F | Leonteq Securities AG | 694 | 16 | ||||||
| 2026-02-19 | 13F | Invesco Ltd. | 518.877 | 11.607 | ||||||
| 2026-04-16 | 13F | Thompson Davis & Co., Inc. | 7.735 | 220 | ||||||
| 2026-02-12 | 13F | BlackRock, Inc. | 1.454.128 | 45,44 | 32.529 | 10,96 | ||||
| 2026-02-17 | 13F | Concentric Capital Strategies, LP | 92.142 | 2.061 | ||||||
| 2026-01-29 | 13F | UBS Group AG | 1.773.607 | 233,62 | 39.676 | 154,54 | ||||
| 2026-02-17 | 13F | Polymer Capital Management (US) LLC | 22.500 | 0,00 | 503 | -23,67 | ||||
| 2026-02-17 | 13F | Jain Global LLC | 0 | -100,00 | 0 | -100,00 | ||||
| 2026-04-22 | 13F | Stone House Investment Management, LLC | 50 | 0,00 | 1 | 0,00 | ||||
| 2026-02-12 | 13F | Ankerstar Wealth, LLC | 69 | 2 | ||||||
| 2026-02-17 | 13F | VARCOV Co. | 11.697 | 262 | ||||||
| 2026-01-26 | 13F | Cwm, Llc | 10 | 0,00 | 0 | |||||
| 2026-01-26 | 13F | La Banque Postale Asset Management SA | 223.855 | 265,55 | 5.008 | 178,94 | ||||
| 2026-02-13 | 13F | Kestra Advisory Services, LLC | 7.622 | 171 | ||||||
| 2026-02-13 | 13F | Citigroup Inc | 118.159 | 2.643 | ||||||
| 2026-02-17 | 13F | Adage Capital Partners Gp, L.l.c. | 0 | -100,00 | 0 | -100,00 | ||||
| 2026-02-17 | 13F | Tower Research Capital LLC (TRC) | 11.240 | 1.030,78 | 251 | 765,52 | ||||
| 2026-02-13 | 13F | SRS Capital Advisors, Inc. | 9 | 80,00 | 0 | |||||
| 2026-02-13 | 13F | Citigroup Inc | Put | 240.000 | 5.369 | |||||
| 2026-04-22 | 13F | Sterling Capital Management LLC | 383 | -29,98 | 11 | -16,67 | ||||
| 2026-04-20 | 13F | Ronald Blue Trust, Inc. | 30 | 1 | ||||||
| 2026-02-11 | 13F | Jpmorgan Chase & Co | 661.342 | -0,42 | 14.794 | -24,02 | ||||
| 2026-02-03 | 13F | SBI Securities Co., Ltd. | 4.379 | 74,60 | 98 | 32,88 | ||||
| 2026-01-21 | 13F | Newbridge Financial Services Group, Inc. | 25 | 0,00 | 1 | |||||
| 2026-02-17 | 13F | Valiant Capital Management, L.P. | 0 | -100,00 | 0 | -100,00 | ||||
| 2026-02-13 | 13F | Itau Unibanco Holding S.A. | 0 | -100,00 | 0 | -100,00 | ||||
| 2026-02-17 | 13F | Blackstone Group Inc | 0 | -100,00 | 0 | -100,00 | ||||
| 2025-11-12 | 13F | CIBC Bancorp USA Inc. | 24.205 | 710 | ||||||
| 2026-02-13 | 13F | Barclays Plc | 33.587 | 292,01 | 751 | 199,20 | ||||
| 2026-02-11 | 13F | Group One Trading, L.p. | 86.209 | 370,01 | 1.928 | 259,03 | ||||
| 2026-02-14 | 13F | Rockefeller Capital Management L.P. | 6.080 | 136 | ||||||
| 2026-02-13 | 13F | American Century Companies Inc | 335.079 | -20,70 | 7.496 | -39,50 | ||||
| 2026-02-09 | 13F | Geode Capital Management, Llc | 608.197 | 92,84 | 13.607 | 47,12 | ||||
| 2026-02-11 | 13F | Simplex Trading, Llc | 17.531 | -60,51 | 392 | 39.100,00 | ||||
| 2026-02-13 | 13F | Mml Investors Services, Llc | 41.326 | 924 | ||||||
| 2026-02-13 | 13F | Marshall Wace, Llp | 124.006 | 724,23 | 2.774 | 529,02 | ||||
| 2026-02-02 | 13F | Fifth Third Bancorp | 413 | 9 | ||||||
| 2026-02-12 | 13F | Hm Payson & Co | 0 | -100,00 | 0 | -100,00 | ||||
| 2026-02-13 | 13F | Wells Fargo & Company/mn | 96.978 | 7.981,50 | 2.169 | 6.097,14 | ||||
| 2026-04-13 | 13F | IFP Advisors, Inc | 20 | 1 | ||||||
| 2026-02-04 | 13F | Tsfg, Llc | 1 | 0,00 | 0 | |||||
| 2026-04-08 | 13F | Wealth Enhancement Advisory Services, Llc | 6.960 | 229 | ||||||
| 2026-02-17 | 13F | California State Teachers Retirement System | 1.322 | 30 | ||||||
| 2026-02-17 | 13F | Temasek Holdings (Private) Ltd | 1.069.588 | 151,25 | 23.927 | 91,70 | ||||
| 2026-02-13 | 13F | Police & Firemen's Retirement System of New Jersey | 5.232 | 117 | ||||||
| 2026-01-30 | 13F | Jennison Associates Llc | 356.692 | 6,05 | 7.979 | -19,09 | ||||
| 2026-03-03 | 13F/A | Caitong International Asset Management Co., Ltd | 28.689 | 140,20 | 642 | 83,14 | ||||
| 2026-02-13 | 13F | First Trust Advisors Lp | 30.108 | 674 | ||||||
| 2026-02-11 | 13F | Capital World Investors | 1.205.209 | 0,00 | 26.961 | -23,70 | ||||
| 2026-04-15 | 13F | FNY Investment Advisers, LLC | Call | 0 | -100,00 | 0 | ||||
| 2026-02-17 | 13F | Russell Investments Group, Ltd. | 1.703 | 38 | ||||||
| 2026-02-06 | 13F | Pnc Financial Services Group, Inc. | 228 | 1,33 | 5 | -16,67 | ||||
| 2026-04-15 | 13F | FNY Investment Advisers, LLC | 0 | -100,00 | 0 | |||||
| 2026-02-10 | 13F | Seven Grand Managers, Llc | 150.000 | 0,00 | 3.356 | -23,72 | ||||
| 2026-02-09 | 13F | Hartland & Co., LLC | 55 | 0,00 | 1 | 0,00 | ||||
| 2026-01-29 | 13F | IMC-Chicago, LLC | 107.152 | 2.397 | ||||||
| 2026-04-17 | 13F | Bell Investment Advisors, Inc | 19 | 1 | ||||||
| 2026-02-17 | 13F | Jump Financial, LLC | 9.239 | 207 | ||||||
| 2026-02-17 | 13F | Ilex Capital Partners (UK) LLP | 0 | -100,00 | 0 | -100,00 | ||||
| 2026-01-29 | 13F | Comerica Bank | 23 | 283,33 | 1 | |||||
| 2026-02-11 | 13F | Cerity Partners LLC | 14.165 | 32,38 | 317 | 0,96 | ||||
| 2026-02-13 | 13F | Victory Capital Management Inc | 9.479 | 212 | ||||||
| 2026-02-17 | 13F | Freestone Grove Partners LP | 249.999 | 23,26 | 5.592 | -5,95 | ||||
| 2026-02-17 | 13F | Ghisallo Capital Management LLC | 160.000 | 0,00 | 3.579 | -23,70 | ||||
| 2026-04-09 | 13F | Pacifica Partners Inc. | 200 | 6 | ||||||
| 2026-02-17 | 13F | Royal Bank Of Canada | 11.859 | -95,09 | 265 | -96,26 | ||||
| 2026-02-09 | 13F | Kingsview Wealth Management, LLC | 10.681 | 239 | ||||||
| 2026-02-12 | 13F | Jane Street Group, Llc | 0 | -100,00 | 0 | -100,00 | ||||
| 2026-01-15 | 13F | J. Safra Sarasin Holding AG | 10.191 | 228 | ||||||
| 2026-02-13 | 13F | Walleye Trading LLC | Call | 8.800 | 197 | |||||
| 2026-02-12 | 13F | Colonial Trust Advisors | 10 | 0,00 | 0 | |||||
| 2026-02-13 | 13F | Walleye Trading LLC | Put | 4.200 | 94 | |||||
| 2026-02-17 | 13F | Zimmer Partners, LP | 0 | -100,00 | 0 | -100,00 | ||||
| 2026-02-17 | 13F | Shay Capital LLC | 62.778 | -48,88 | 1.404 | -61,00 | ||||
| 2026-02-05 | 13F | Amalgamated Bank | 675 | 0 | ||||||
| 2026-02-13 | 13F | Charles Schwab Investment Management Inc | 152.130 | 36,78 | 3.403 | 4,39 | ||||
| 2026-02-12 | 13F | Penserra Capital Management LLC | 280.396 | 122,22 | 6 | 100,00 | ||||
| 2026-02-20 | 13F | Sunbelt Securities, Inc. | 40 | 0,00 | 1 | -100,00 | ||||
| 2026-02-05 | 13F | Phoenix Holdings Ltd. | 660.060 | 33,76 | 14.765 | 2,05 | ||||
| 2026-02-12 | 13F | Jane Street Group, Llc | Put | 128.200 | 63,31 | 2.868 | 24,60 | |||
| 2026-02-12 | 13F | Jane Street Group, Llc | Call | 116.100 | 148,08 | 2.597 | 89,29 | |||
| 2026-02-03 | 13F | Costello Asset Management, INC | 500 | 0,00 | 11 | -21,43 | ||||
| 2026-02-17 | 13F | Alliancebernstein L.p. | 28.670 | 641 | ||||||
| 2026-04-06 | 13F | Versant Capital Management, Inc | 21 | 1 | ||||||
| 2026-02-17 | 13F | Aster Capital Management (DIFC) Ltd | 0 | -100,00 | 0 | -100,00 | ||||
| 2026-02-13 | 13F | State Street Corp | 391.279 | 413,48 | 8.753 | 291,76 | ||||
| 2026-02-17 | 13F | Tudor Investment Corp Et Al | 608.698 | -10,31 | 13.617 | -31,57 | ||||
| 2026-04-14 | 13F | Nbc Securities, Inc. | 1.362 | -20,12 | 39 | 0,00 | ||||
| 2026-02-17 | 13F | Capital Fund Management S.a. | 91.572 | 2.048 | ||||||
| 2026-04-21 | 13F | Wedbush Securities Inc | 7.300 | 0 | ||||||
| 2026-02-12 | 13F | Steward Partners Investment Advisory, Llc | 303 | 7 | ||||||
| 2026-02-13 | 13F | Verition Fund Management LLC | Put | 40.000 | 895 | |||||
| 2026-02-13 | 13F | Verition Fund Management LLC | 32.000 | -92,79 | 716 | -94,50 | ||||
| 2026-02-12 | 13F | Federation des caisses Desjardins du Quebec | 85 | 0,00 | 2 | -50,00 | ||||
| 2026-04-16 | 13F | Toth Financial Advisory Corp | 4.020 | 114 | ||||||
| 2026-04-24 | 13F | Midwest Capital Advisors, LLC | 0 | -100,00 | 0 | |||||
| 2026-02-17 | 13F | LMR Partners LLP | 151.546 | 0,00 | 3.390 | -23,70 | ||||
| 2026-01-29 | 13F | Dunhill Financial, LLC | 1 | 0 | ||||||
| 2026-02-17 | 13F | Capstone Investment Advisors, Llc | 0 | -100,00 | 0 | -100,00 | ||||
| 2026-02-11 | 13F | Clearbridge Investments, LLC | 0 | -100,00 | 0 | -100,00 | ||||
| 2026-04-23 | 13F | SJS Investment Consulting Inc. | 2 | 0 | ||||||
| 2026-02-06 | 13F | Bare Financial Services, Inc | 18 | 0 | ||||||
| 2026-02-13 | 13F | Cohen & Steers, Inc. | 0 | -100,00 | 0 | |||||
| 2026-02-17 | 13F | Advisor Group Holdings, Inc. | 4.106 | 1.040,56 | 92 | 506,67 | ||||
| 2026-02-03 | 13F | Canal Insurance CO | 10.000 | 0,00 | 0 | |||||
| 2026-02-10 | 13F | Bank of New York Mellon Corp | 58.774 | 1.315 | ||||||
| 2026-02-13 | 13F | Wexford Capital Lp | 1.330 | 30 | ||||||
| 2026-02-13 | 13F | Neuberger Berman Group LLC | 73.010 | -1,41 | 1.633 | -24,78 | ||||
| 2026-02-17 | 13F | Scientech Research LLC | 0 | -100,00 | 0 | -100,00 | ||||
| 2026-02-12 | 13F | Renaissance Technologies Llc | 23.500 | 526 | ||||||
| 2026-02-13 | 13F | Fifth Lane Capital, Lp | Put | 100 | 2 | |||||
| 2026-02-19 | 13F/A | T. Rowe Price Investment Management, Inc. | 0 | -100,00 | 0 | -100,00 | ||||
| 2026-02-13 | 13F | Fifth Lane Capital, Lp | 11.150 | 249 | ||||||
| 2026-02-06 | 13F | Berbice Capital Management LLC | 0 | -100,00 | 0 | |||||
| 2026-02-17 | 13F | BlueCrest Capital Management Ltd | 478.698 | 0,00 | 10.708 | -23,71 | ||||
| 2026-04-15 | 13F | Exchange Traded Concepts, Llc | 16.876 | 480 |