Grundlæggende statistik
| Institutionelle ejere | 150 total, 150 long only, 0 short only, 0 long/short - change of 5,63% MRQ |
| Gennemsnitlig porteføljeallokering | 0.1666 % - change of 41,86% MRQ |
| Institutionelle aktier (lange) | 17.482.605 (ex 13D/G) - change of 4,05MM shares 30,12% MRQ |
| Institutionel værdi (lang) | $ 454.798 USD ($1000) |
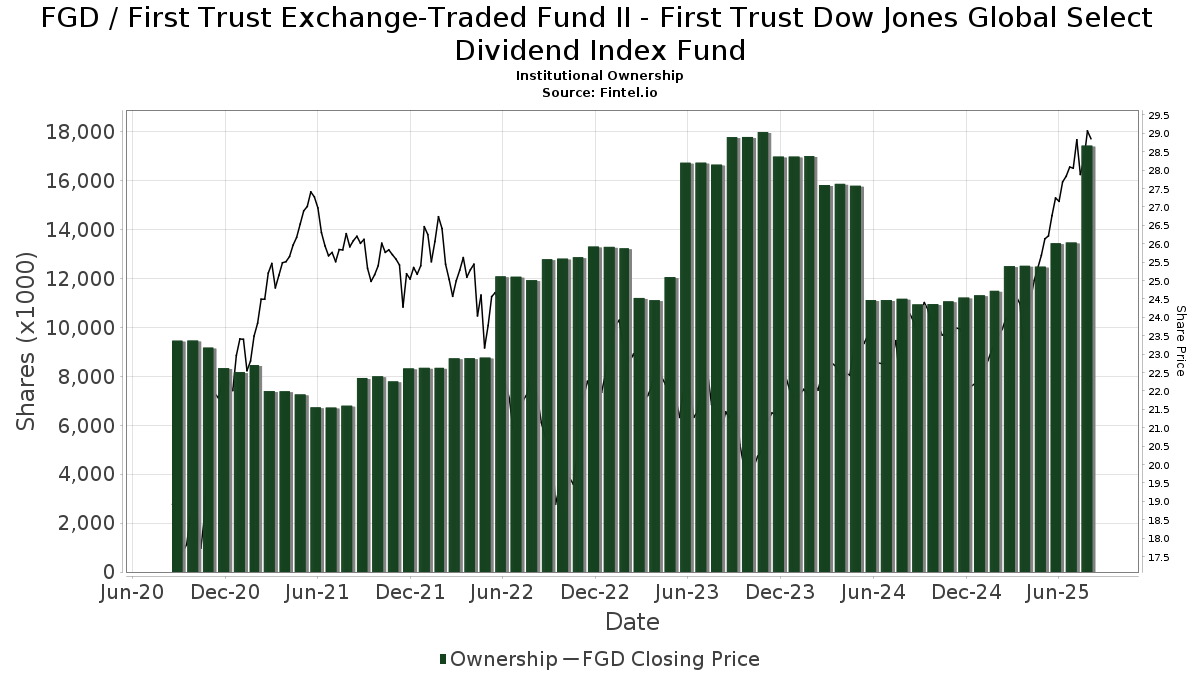
Institutionelt ejerskab og aktionærer
First Trust Exchange-Traded Fund II - First Trust Dow Jones Global Select Dividend Index Fund (US:FGD) har 150 institutionelle ejere og aktionærer, der har indsendt 13D/G- eller 13F-formularer til Securities Exchange Commission (SEC). Disse institutioner har i alt 17,482,605 aktier. Største aktionærer omfatter LPL Financial LLC, Wells Fargo & Company/mn, Ameriprise Financial Inc, Raymond James Financial Inc, FUKOKU MUTUAL LIFE INSURANCE Co, Morgan Stanley, AE Wealth Management LLC, UBS Group AG, Bank Of America Corp /de/, and Park National Corp /oh/ .
First Trust Exchange-Traded Fund II - First Trust Dow Jones Global Select Dividend Index Fund (ARCA:FGD) institutionel ejerskabsstruktur viser aktuelle positioner i virksomheden efter institutioner og fonde, samt seneste ændringer i positionsstørrelse. Større aktionærer kan omfatte individuelle investorer, investeringsforeninger, hedgefonde eller institutioner. Skema 13D angiver, at investoren besidder (eller besidder) mere end 5 % af virksomheden og har til hensigt (eller har til hensigt at) aktivt at forfølge en ændring i forretningsstrategi. Skema 13G indikerer en passiv investering på over 5%.
The share price as of September 16, 2025 is 29,63 / share. Previously, on September 17, 2024, the share price was 24,17 / share. This represents an increase of 22,57% over that period.
Fondens stemningsscore
Fund Sentiment Score (fka Ownership Accumulation Score) finder de aktier, der bliver mest købt af fonde. Det er resultatet af en sofistikeret, multi-faktor kvantitativ model, der identificerer virksomheder med de højeste niveauer af institutionel akkumulering. Scoringsmodellen bruger en kombination af den samlede stigning i oplyste ejere, ændringerne i porteføljeallokeringer i disse ejere og andre målinger. Tallet går fra 0 til 100, hvor højere tal indikerer et højere niveau af akkumulering for sine jævnaldrende, og 50 er gennemsnittet.
Opdateringsfrekvens: Dagligt
Se Ownership Explorer, som giver en liste over højest rangerende virksomheder.
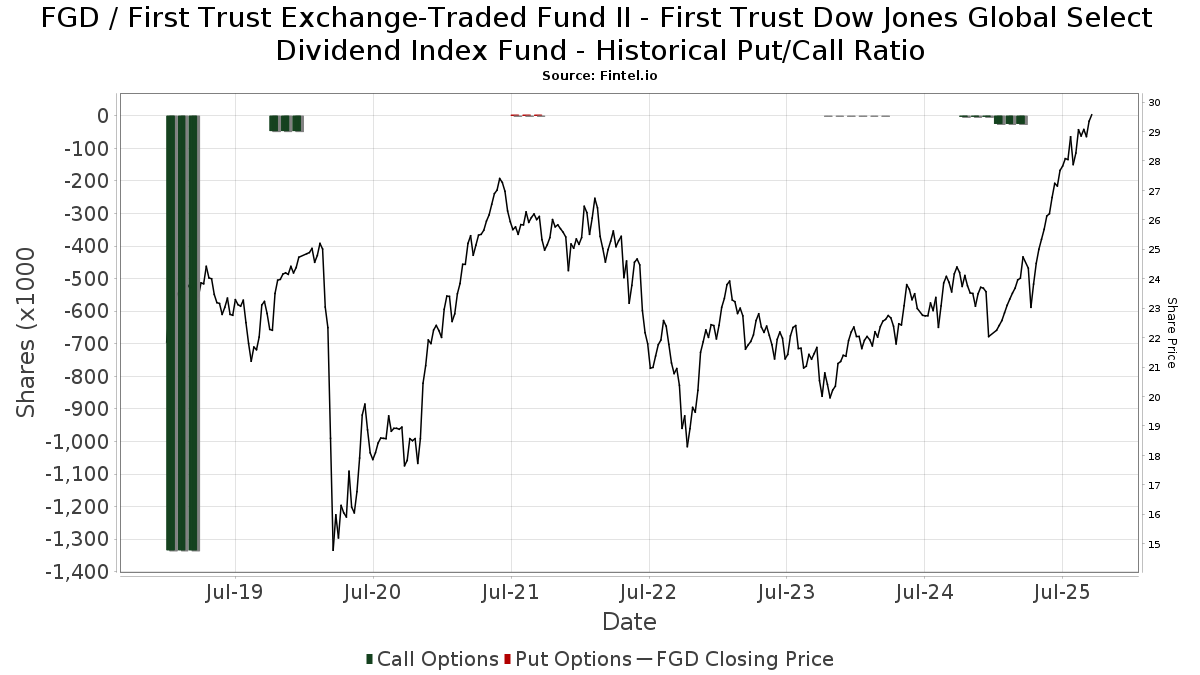
Institutionel Put/Call-forhold
Ud over at indberette standardaktie- og gældsudstedelser skal institutter med mere end 100 mill. aktiver under forvaltning også oplyse deres put- og call-optionsbeholdninger. Da salgsoptioner generelt indikerer negativ stemning, og købsoptioner indikerer positiv stemning, kan vi få en fornemmelse af den overordnede institutionelle stemning ved at plotte forholdet mellem put og kald. Diagrammet til højre viser det historiske put/call-forhold for dette instrument.
Brug af Put/Call Ratio som en indikator for investorernes stemning overvinder en af de vigtigste mangler ved at bruge totalt institutionelt ejerskab, som er, at en betydelig mængde af aktiver under forvaltning investeres passivt for at spore indekser. Passivt forvaltede fonde køber typisk ikke optioner, så indikatoren for put/call-forholdet følger mere nøje følelsen af aktivt forvaltede fonde.
13F og NPORT arkivering
Detaljer om 13F-arkivering er gratis. Detaljer om NP-ansøgninger kræver et premium-medlemskab. Grønne rækker angiver nye positioner. Røde rækker angiver lukkede positioner. Klik på linket ikon for at se den fulde transaktionshistorik.
Opgrader
for at låse premium-data op og eksportere til Excel ![]() .
.
| Fil dato | Kilde | Investor | Type | Gennemsnitlig pris (Øst) |
Aktier | Δ Aktier (%) |
Rapporteret Værdi ($1000) |
Δ Værdi (%) |
Port Alloc (%) |
|
|---|---|---|---|---|---|---|---|---|---|---|
| 2025-07-18 | 13F | Lynx Investment Advisory | 150.205 | -8,51 | 4.137 | 4,10 | ||||
| 2025-08-13 | 13F | Transce3nd, LLC | 4.089 | -7,38 | 113 | 5,66 | ||||
| 2025-08-12 | 13F | Park Square Financial Group, LLC | 10.372 | -7,47 | 286 | 5,17 | ||||
| 2025-07-01 | 13F | Park National Corp /oh/ | 468.517 | 8,92 | 12.903 | 23,95 | ||||
| 2025-08-14 | 13F | Sei Investments Co | 31.167 | 858 | ||||||
| 2025-07-21 | 13F | Barrett & Company, Inc. | 0 | -100,00 | 0 | |||||
| 2025-07-30 | 13F | Mid-American Wealth Advisory Group, Inc. | 389 | 11 | ||||||
| 2025-08-08 | 13F | Creative Planning | 14.345 | -49,05 | 395 | -42,00 | ||||
| 2025-07-14 | 13F | AdvisorNet Financial, Inc | 264 | 68,15 | 7 | 133,33 | ||||
| 2025-08-11 | 13F | Aptus Capital Advisors, LLC | 616 | 0,00 | 17 | 14,29 | ||||
| 2025-08-12 | 13F | Wealthbridge Capital Management, Llc | 55.409 | 1,97 | 1.526 | 15,97 | ||||
| 2025-08-08 | 13F | Avantax Advisory Services, Inc. | 0 | -100,00 | 0 | |||||
| 2025-08-14 | 13F/A | Rockefeller Capital Management L.P. | 13.991 | 29,93 | 385 | 48,08 | ||||
| 2025-07-21 | 13F | Crews Bank & Trust | 1.670 | 0,00 | 46 | 12,50 | ||||
| 2025-08-14 | 13F | Royal Bank Of Canada | 236.625 | 13,01 | 6.517 | 28,62 | ||||
| 2025-08-14 | 13F | Harvest Investment Services, LLC | 86.175 | -0,30 | 2.373 | 13,49 | ||||
| 2025-08-13 | 13F | EverSource Wealth Advisors, LLC | 100 | 0,00 | 3 | 0,00 | ||||
| 2025-08-14 | 13F | Federation des caisses Desjardins du Quebec | 2.260 | 0,00 | 62 | 14,81 | ||||
| 2025-07-08 | 13F | Nbc Securities, Inc. | 13.350 | -0,98 | 0 | |||||
| 2025-08-14 | 13F | Wiley Bros.-aintree Capital, Llc | 28.710 | 791 | ||||||
| 2025-05-01 | 13F | Quest 10 Wealth Builders, Inc. | 23.293 | 1,41 | 564 | 10,39 | ||||
| 2025-07-29 | 13F | Creekside Partners | 114.542 | 0,79 | 3.154 | 14,69 | ||||
| 2025-08-13 | 13F | Jones Financial Companies Lllp | 84.008 | 84,50 | 2.301 | 108,24 | ||||
| 2025-08-14 | 13F | Bank Of America Corp /de/ | 473.246 | 13,54 | 13.033 | 29,22 | ||||
| 2025-08-08 | 13F | Advisors Capital Management, LLC | 18.741 | 0,00 | 516 | 13,91 | ||||
| 2025-08-12 | 13F | LPL Financial LLC | 2.554.546 | 35,38 | 70.352 | 54,07 | ||||
| 2025-07-24 | 13F | IFP Advisors, Inc | 8.383 | 0,00 | 231 | 13,86 | ||||
| 2025-08-06 | 13F | Commonwealth Equity Services, Llc | 360.909 | 209,36 | 10 | 350,00 | ||||
| 2025-08-07 | 13F | 1620 Investment Advisors, Inc. | 200 | 0,00 | 6 | 25,00 | ||||
| 2025-05-15 | 13F | Hrt Financial Lp | 0 | -100,00 | 0 | |||||
| 2025-07-25 | 13F | Cwm, Llc | 1.081 | 0,00 | 0 | |||||
| 2025-07-23 | 13F | RiverTree Advisors, LLC | 54.358 | 1.497 | ||||||
| 2025-08-06 | 13F | AE Wealth Management LLC | 858.509 | -6,87 | 23.643 | 5,98 | ||||
| 2025-08-11 | 13F | Citigroup Inc | 700 | 0,00 | 19 | 18,75 | ||||
| 2025-08-08 | 13F/A | Sterling Capital Management LLC | 49 | -15,52 | 1 | 0,00 | ||||
| 2025-08-06 | 13F | Golden State Wealth Management, LLC | 103 | -7,21 | 3 | 0,00 | ||||
| 2025-08-11 | 13F | Wealthspire Advisors, LLC | 7.470 | 206 | ||||||
| 2025-08-08 | 13F | Pnc Financial Services Group, Inc. | 160.740 | -11,54 | 4.427 | 0,66 | ||||
| 2025-08-15 | 13F | Morgan Stanley | 1.059.317 | 4,32 | 29.174 | 18,72 | ||||
| 2025-08-11 | 13F | Principal Securities, Inc. | 2.686 | -8,33 | 74 | 12,31 | ||||
| 2025-08-14 | 13F | GWM Advisors LLC | 8.010 | 1.007,88 | 221 | 1.194,12 | ||||
| 2025-08-14 | 13F | Guardian Wealth Advisors, Llc / Nc | 616 | 0,00 | 17 | 14,29 | ||||
| 2025-05-06 | 13F | Rsm Us Wealth Management Llc | 0 | -100,00 | 0 | |||||
| 2025-07-16 | 13F | ORG Partners LLC | 9.481 | 0,00 | 263 | 14,35 | ||||
| 2025-07-09 | 13F | Triumph Capital Management | 26.245 | -0,38 | 723 | 13,34 | ||||
| 2025-07-17 | 13F | Global Trust Asset Management, LLC | 2.980 | 0,00 | 82 | 13,89 | ||||
| 2025-08-11 | 13F | Rothschild Investment Llc | 1.491 | 0,00 | 41 | 13,89 | ||||
| 2025-08-12 | 13F | Jpmorgan Chase & Co | 0 | -100,00 | 0 | |||||
| 2025-08-12 | 13F | CIBC Private Wealth Group, LLC | 17.394 | 479 | ||||||
| 2025-08-13 | 13F | Rockport Wealth LLC | 17.764 | -17,96 | 489 | -6,68 | ||||
| 2025-08-13 | 13F | Cerity Partners LLC | 9.973 | -4,58 | 275 | 8,73 | ||||
| 2025-08-14 | 13F | Financial Advisory Service, Inc. | 270 | 0,00 | 7 | 16,67 | ||||
| 2025-08-13 | 13F | Northwestern Mutual Wealth Management Co | 81.470 | -9,20 | 2.244 | 3,32 | ||||
| 2025-08-04 | 13F | Assetmark, Inc | 4 | 0,00 | 0 | |||||
| 2025-08-06 | 13F | DDFG, Inc | 23.773 | -1,23 | 655 | 12,37 | ||||
| 2025-07-16 | 13F | Novem Group | 7.500 | 207 | ||||||
| 2025-08-14 | 13F | Susquehanna International Group, Llp | 22.646 | -29,20 | 624 | -19,51 | ||||
| 2025-07-14 | 13F | Matrix Trust Co | 13.830 | 0,66 | 0 | |||||
| 2025-08-13 | 13F | StoneX Group Inc. | 0 | -100,00 | 0 | -100,00 | ||||
| 2025-08-14 | 13F | Comerica Bank | 19.475 | -0,18 | 536 | 13,56 | ||||
| 2025-08-12 | 13F | Archer Investment Corp | 7.711 | 0,00 | 212 | 13,98 | ||||
| 2025-08-14 | 13F | Raymond James Financial Inc | 1.163.034 | 428,34 | 32.030 | 501,26 | ||||
| 2025-07-18 | 13F | Truist Financial Corp | 28.155 | -6,88 | 775 | 6,02 | ||||
| 2025-08-14 | 13F | Mission Creek Capital Partners, Inc. | 59.467 | 0,90 | 1.638 | 14,80 | ||||
| 2025-08-01 | 13F | Envestnet Asset Management Inc | 209.197 | -4,88 | 5.761 | 8,25 | ||||
| 2025-08-06 | 13F | Moors & Cabot, Inc. | 27.411 | 755 | ||||||
| 2025-08-12 | 13F | Gladstone Institutional Advisory LLC | 21.541 | 67,20 | 593 | 90,68 | ||||
| 2025-08-11 | 13F | Slagle Financial, LLC | 9.161 | -10,98 | 252 | 1,20 | ||||
| 2025-07-17 | 13F | Janney Montgomery Scott LLC | 447.827 | 133,82 | 12 | 200,00 | ||||
| 2025-08-13 | 13F | Virtue Capital Management, LLC | 0 | -100,00 | 0 | |||||
| 2025-08-14 | 13F | Wells Fargo & Company/mn | 1.835.188 | -4,31 | 50.541 | 8,90 | ||||
| 2025-08-11 | 13F | Pineridge Advisors LLC | 1.270 | -6,69 | 35 | 6,25 | ||||
| 2025-07-17 | 13F | Vermillion Wealth Management, Inc. | 443 | 0,00 | 12 | 20,00 | ||||
| 2025-07-28 | 13F | Harbour Investments, Inc. | 11.820 | 0,03 | 326 | 14,04 | ||||
| 2025-05-15 | 13F | Talon Private Wealth, LLC | 0 | -100,00 | 0 | -100,00 | ||||
| 2025-07-22 | 13F | Simplicity Wealth,LLC | 26.476 | 60,65 | 729 | 83,17 | ||||
| 2025-07-23 | 13F | Tcfg Wealth Management, Llc | 42.392 | -0,96 | 1.167 | 12,75 | ||||
| 2025-07-25 | 13F | Envestnet Portfolio Solutions, Inc. | 0 | -100,00 | 0 | |||||
| 2025-07-15 | 13F | FLP Wealth Management, LLC | 8.294 | 2,89 | 201 | 11,73 | ||||
| 2025-07-18 | 13F | B.O.S.S. Retirement Advisors, LLC | 93.417 | -13,04 | 2.573 | -1,04 | ||||
| 2025-07-11 | 13F | Farther Finance Advisors, LLC | 17.001 | 6,34 | 468 | 20,62 | ||||
| 2025-07-14 | 13F | U.S. Capital Wealth Advisors, LLC | 9.119 | 0,00 | 251 | 14,09 | ||||
| 2025-08-12 | 13F | FUKOKU MUTUAL LIFE INSURANCE Co | 1.063.000 | 68,20 | 29.275 | 91,41 | ||||
| 2025-08-14 | 13F | Jane Street Group, Llc | 351.755 | 3.856,30 | 9.687 | 4.405,58 | ||||
| 2025-07-25 | 13F | Atria Wealth Solutions, Inc. | 7.709 | 214 | ||||||
| 2025-08-07 | 13F | Kestra Private Wealth Services, Llc | 14.402 | 37,78 | 397 | 57,14 | ||||
| 2025-07-23 | 13F | Trueblood Wealth Management, LLC | 82.346 | 11,31 | 2.268 | 26,65 | ||||
| 2025-08-08 | 13F | Capital Investment Advisory Services, LLC | 22.645 | -7,17 | 624 | 5,59 | ||||
| 2025-07-21 | 13F | Ameritas Advisory Services, LLC | 588 | 16 | ||||||
| 2025-08-08 | 13F | Foundations Investment Advisors, LLC | 12.572 | 1,82 | 346 | 16,11 | ||||
| 2025-07-11 | 13F | Pinnacle Bancorp, Inc. | 2.100 | 0,00 | 58 | 14,00 | ||||
| 2025-07-29 | 13F | Private Trust Co Na | 15.525 | 0,00 | 428 | 13,87 | ||||
| 2025-09-04 | 13F/A | Advisor Group Holdings, Inc. | 93.136 | 7,05 | 2.565 | 21,81 | ||||
| 2025-07-30 | 13F | LifeWealth Investments, LLC | 27.700 | 11,25 | 763 | 26,58 | ||||
| 2025-07-31 | 13F | Brinker Capital Investments, LLC | 0 | -100,00 | 0 | -100,00 | ||||
| 2025-07-30 | 13F | BlueChip Wealth Advisors LLC | 13.634 | 0,00 | 375 | 13,98 | ||||
| 2025-08-14 | 13F | Fmr Llc | 2.543 | 8,77 | 70 | 25,00 | ||||
| 2025-07-29 | 13F | Stephens Inc /ar/ | 10.765 | 0,00 | 296 | 13,85 | ||||
| 2025-07-16 | 13F | PFS Partners, LLC | 130 | 0,00 | 4 | 0,00 | ||||
| 2025-07-16 | 13F | Owen LaRue, LLC | 101.700 | 2.801 | ||||||
| 2025-07-28 | 13F | ForthRight Wealth Management, LLC | 176.385 | 20,62 | 4.858 | 37,28 | ||||
| 2025-08-13 | 13F | Luminist Capital LLC | 297 | 0,00 | 8 | 14,29 | ||||
| 2025-08-14 | 13F | Mariner, LLC | 13.378 | -4,21 | 368 | 9,20 | ||||
| 2025-08-13 | 13F | Baird Financial Group, Inc. | 91.706 | -8,87 | 2.526 | 3,70 | ||||
| 2025-08-05 | 13F | Intellectus Partners, LLC | 29.210 | 2,75 | 804 | 17,03 | ||||
| 2025-08-05 | 13F | Sigma Planning Corp | 48.947 | -1,84 | 1.348 | 11,69 | ||||
| 2025-08-12 | 13F | MAI Capital Management | 371 | 0,00 | 10 | 25,00 | ||||
| 2025-05-12 | 13F | Sandy Spring Bank | 3.735 | 0,46 | 90 | 9,76 | ||||
| 2025-08-11 | 13F | HighTower Advisors, LLC | 23.062 | -10,32 | 635 | 2,09 | ||||
| 2025-08-14 | 13F | Main Street Financial Solutions, LLC | 12.237 | 1,20 | 337 | 15,07 | ||||
| 2025-08-06 | 13F | Stonebridge Financial Planning Group, LLC | 56.983 | 1.569 | ||||||
| 2025-08-12 | 13F | Ameritas Investment Partners, Inc. | 1.910 | -4,98 | 53 | 8,33 | ||||
| 2025-05-13 | 13F | PFG Private Wealth Management, LLC | 0 | -100,00 | 0 | |||||
| 2025-08-05 | 13F | Claro Advisors LLC | 7.383 | 203 | ||||||
| 2025-08-08 | 13F | SBI Securities Co., Ltd. | 1.420 | 26,67 | 39 | 44,44 | ||||
| 2025-08-14 | 13F | Integrated Wealth Concepts LLC | 69.470 | 10,95 | 1.913 | 26,27 | ||||
| 2025-07-31 | 13F | Oppenheimer & Co Inc | 12.030 | 0,00 | 331 | 13,75 | ||||
| 2025-08-14 | 13F | Benjamin Edwards Inc | 21.149 | 10,05 | 582 | 25,16 | ||||
| 2025-08-14 | 13F | Warren Averett Asset Management, LLC | 29.542 | 6,70 | 814 | 21,52 | ||||
| 2025-08-14 | 13F | Transamerica Financial Advisors, Inc. | 23 | -4,17 | 1 | |||||
| 2025-08-14 | 13F | Old Mission Capital Llc | 0 | -100,00 | 0 | |||||
| 2025-08-11 | 13F | Private Advisor Group, LLC | 9.056 | -13,64 | 249 | -1,58 | ||||
| 2025-08-14 | 13F | Ameriprise Financial Inc | 1.807.702 | 48,86 | 49.794 | 69,44 | ||||
| 2025-08-12 | 13F | J.w. Cole Advisors, Inc. | 9.771 | 14,83 | 269 | 31,22 | ||||
| 2025-08-13 | 13F | SMART Wealth LLC | 123.117 | 12,83 | 3.391 | 28,41 | ||||
| 2025-08-12 | 13F | Steward Partners Investment Advisory, Llc | 113.590 | -6,72 | 3.128 | 6,18 | ||||
| 2025-08-14 | 13F | Citadel Advisors Llc | 0 | -100,00 | 0 | |||||
| 2025-07-30 | 13F | IMG Wealth Management, Inc. | 139.946 | 16.660,00 | 3.854 | 19.170,00 | ||||
| 2025-08-12 | 13F | Global Retirement Partners, LLC | 1.458 | 14,89 | 40 | 42,86 | ||||
| 2025-07-16 | 13F | Twelve Points Wealth Management LLC | 110.814 | 2,43 | 3.052 | 16,54 | ||||
| 2025-08-14 | 13F | UBS Group AG | 705.721 | 14,28 | 19.436 | 30,05 | ||||
| 2025-07-29 | 13F | Cottonwood Capital Advisors, Llc | 34.455 | -1,06 | 949 | 12,59 | ||||
| 2025-07-30 | 13F | D.a. Davidson & Co. | 54.107 | 58,32 | 1.490 | 80,17 | ||||
| 2025-07-31 | 13F | Cambridge Investment Research Advisors, Inc. | 92.782 | 13,51 | 3 | 100,00 | ||||
| 2025-04-17 | 13F | Authentikos Wealth Advisory, LLC | 0 | -100,00 | 0 | |||||
| 2025-08-14 | 13F | Snowden Capital Advisors LLC | 9.102 | 0,00 | 251 | 13,64 | ||||
| 2025-07-21 | 13F | TFG Advisers LLC | 8.694 | 1,52 | 239 | 15,46 | ||||
| 2025-08-04 | 13F | L.m. Kohn & Company | 44.086 | -2,42 | 1.214 | 11,07 | ||||
| 2025-08-15 | 13F | Equitable Holdings, Inc. | 67.147 | 6,33 | 1.849 | 21,01 | ||||
| 2025-08-14 | 13F | Mml Investors Services, Llc | 12.879 | 0 | ||||||
| 2025-07-25 | 13F | Concurrent Investment Advisors, LLC | 35.735 | 17,33 | 984 | 33,51 | ||||
| 2025-08-11 | 13F | Tidemark, LLC | 645 | -7,19 | 18 | 6,25 | ||||
| 2025-07-10 | 13F | Wealth Enhancement Advisory Services, Llc | 18.395 | -5,69 | 512 | 8,70 | ||||
| 2025-08-05 | 13F | Holistic Financial Partners | 9.577 | 0,00 | 264 | 13,85 | ||||
| 2025-04-15 | 13F | Collier Financial | 24.221 | 586 | ||||||
| 2025-08-08 | 13F | Gts Securities Llc | 17.725 | 488 | ||||||
| 2025-08-13 | 13F | Proactive Wealth Strategies LLC | 10.951 | 0,04 | 0 | |||||
| 2025-08-08 | 13F | Cetera Investment Advisers | 95.789 | 43,00 | 2.638 | 62,74 | ||||
| 2025-07-30 | 13F | Whittier Trust Co Of Nevada Inc | 2.000 | 0,00 | 55 | 14,58 | ||||
| 2025-08-18 | 13F | Geneos Wealth Management Inc. | 350 | 0,00 | 10 | 12,50 | ||||
| 2025-08-05 | 13F | Bank Of Montreal /can/ | 200 | 0,00 | 6 | 25,00 | ||||
| 2025-08-14 | 13F | Stifel Financial Corp | 106.152 | 48,15 | 2.923 | 68,57 | ||||
| 2025-08-18 | 13F/A | National Bank Of Canada /fi/ | 208 | 0,00 | 6 | 0,00 | ||||
| 2025-08-06 | 13F | New Millennium Group LLC | 70 | 0,00 | 2 | 0,00 | ||||
| 2025-08-12 | 13F | Proequities, Inc. | 0 | 0 | ||||||
| 2025-08-13 | 13F | Flow Traders U.s. Llc | 0 | -100,00 | 0 | |||||
| 2025-08-12 | 13F | Howe & Rusling Inc | 11.236 | 2,95 | 309 | 17,05 | ||||
| 2025-08-12 | 13F | Financial Advocates Investment Management | 10.950 | 302 | ||||||
| 2025-07-29 | 13F | Stratos Wealth Partners, LTD. | 15.986 | 8,56 | 440 | 23,60 | ||||
| 2025-07-15 | 13F | Elevated Capital Advisors, LLC | 52.634 | 0,00 | 1.274 | 0,00 | ||||
| 2025-08-15 | 13F | Kestra Advisory Services, LLC | 54.178 | 0,08 | 1.492 | 13,98 | ||||
| 2025-08-06 | 13F | Atlantic Union Bankshares Corp | 3.802 | 105 | ||||||
| 2025-08-14 | 13F | Citadel Advisors Llc | Call | 0 | -100,00 | 0 | ||||
| 2025-07-15 | 13F | Retirement Guys Formula Llc | 11.778 | -4,65 | 324 | 8,72 | ||||
| 2025-08-05 | 13F | GPS Wealth Strategies Group, LLC | 16.282 | 0,06 | 448 | 13,99 | ||||
| 2025-05-14 | 13F | Triad Wealth Partners, LLC | 0 | -100,00 | 0 | |||||
| 2025-07-17 | 13F | Worth Financial Advisory Group, LLC | 11.071 | 0,00 | 305 | 13,86 | ||||
| 2025-08-11 | 13F | Western Wealth Management, LLC | 23.774 | 40,87 | 655 | 60,29 | ||||
| 2025-05-16 | 13F | Coppell Advisory Solutions LLC | 0 | -100,00 | 0 |
Other Listings
| MX:FGD |