Grundlæggende statistik
| Institutionelle aktier (lange) | 86.195.418 - 44,38% (ex 13D/G) - change of -47,69MM shares -35,62% MRQ |
| Institutionel værdi (lang) | $ 182.050 USD ($1000) |
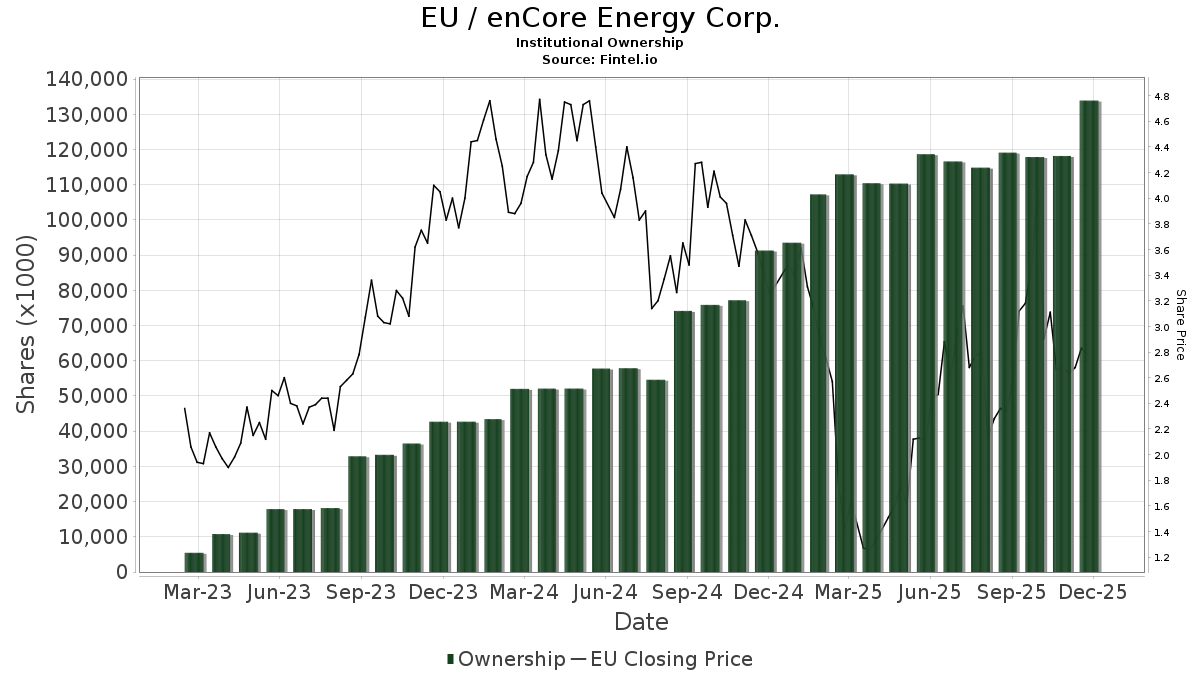
Institutionelt ejerskab og aktionærer
enCore Energy Corp. (US:EU) har 150 institutionelle ejere og aktionærer, der har indsendt 13D/G- eller 13F-formularer til Securities Exchange Commission (SEC). Disse institutioner har i alt 86,195,418 aktier. Største aktionærer omfatter MIRAE ASSET GLOBAL ETFS HOLDINGS Ltd., Van Eck Associates Corp, BlackRock, Inc., UBS Group AG, Extract Advisors LLC, MMCAP International Inc. SPC, Azarias Capital Management, L.P., Morgan Stanley, State Street Corp, and Vident Advisory, LLC .
enCore Energy Corp. (NasdaqCM:EU) institutionel ejerskabsstruktur viser aktuelle positioner i virksomheden efter institutioner og fonde, samt seneste ændringer i positionsstørrelse. Større aktionærer kan omfatte individuelle investorer, investeringsforeninger, hedgefonde eller institutioner. Skema 13D angiver, at investoren besidder (eller besidder) mere end 5 % af virksomheden og har til hensigt (eller har til hensigt at) aktivt at forfølge en ændring i forretningsstrategi. Skema 13G indikerer en passiv investering på over 5%.
The share price as of April 6, 2026 is 1,88 / share. Previously, on April 7, 2025, the share price was 1,19 / share. This represents an increase of 57,98% over that period.
Fondens stemningsscore
Fund Sentiment Score (fka Ownership Accumulation Score) finder de aktier, der bliver mest købt af fonde. Det er resultatet af en sofistikeret, multi-faktor kvantitativ model, der identificerer virksomheder med de højeste niveauer af institutionel akkumulering. Scoringsmodellen bruger en kombination af den samlede stigning i oplyste ejere, ændringerne i porteføljeallokeringer i disse ejere og andre målinger. Tallet går fra 0 til 100, hvor højere tal indikerer et højere niveau af akkumulering for sine jævnaldrende, og 50 er gennemsnittet.
Opdateringsfrekvens: Dagligt
Se Ownership Explorer, som giver en liste over højest rangerende virksomheder.
AI+ Ask Fintel’s AI assistant about enCore Energy Corp..
Select a question to share a public post with an AI-crafted answer.
Thinking of good questions…
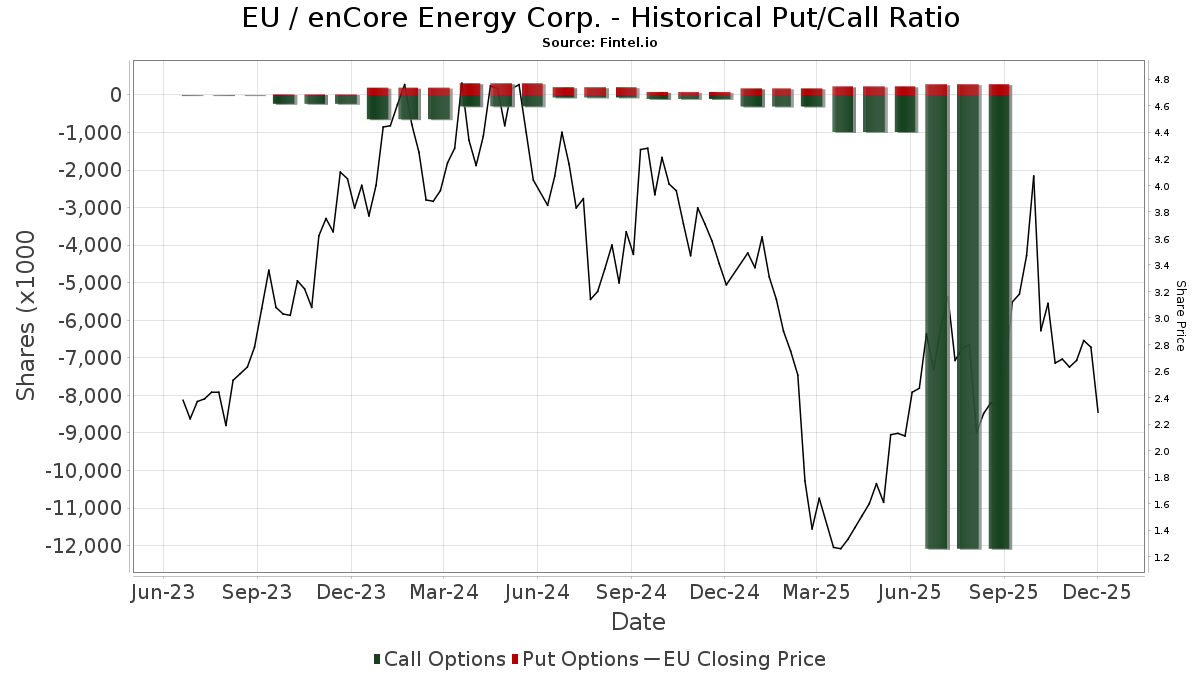
Institutionel Put/Call-forhold
Ud over at indberette standardaktie- og gældsudstedelser skal institutter med mere end 100 mill. aktiver under forvaltning også oplyse deres put- og call-optionsbeholdninger. Da salgsoptioner generelt indikerer negativ stemning, og købsoptioner indikerer positiv stemning, kan vi få en fornemmelse af den overordnede institutionelle stemning ved at plotte forholdet mellem put og kald. Diagrammet til højre viser det historiske put/call-forhold for dette instrument.
Brug af Put/Call Ratio som en indikator for investorernes stemning overvinder en af de vigtigste mangler ved at bruge totalt institutionelt ejerskab, som er, at en betydelig mængde af aktiver under forvaltning investeres passivt for at spore indekser. Passivt forvaltede fonde køber typisk ikke optioner, så indikatoren for put/call-forholdet følger mere nøje følelsen af aktivt forvaltede fonde.
13D/G-arkivering
Vi præsenterer 13D/G ansøgninger separat fra 13F ansøgninger på grund af den forskellige behandling af SEC. 13D/G-ansøgninger kan indgives af grupper af investorer (med én ledende), hvorimod 13F-ansøgninger ikke kan. Dette resulterer i situationer, hvor en investor kan indsende en 13D/G, der rapporterer én værdi for de samlede aktier (der repræsenterer alle de aktier, der ejes af investorgruppen), men derefter indsender en 13F, der rapporterer en anden værdi for de samlede aktier (der udelukkende repræsenterer deres egne) ejendomsret). Det betyder, at aktieejerskab af 13D/G-arkiver og 13F-arkiveringer ofte ikke er direkte sammenlignelige, så vi præsenterer dem separat.
Bemærk: Fra den 16. maj 2021 viser vi ikke længere ejere, der ikke har indsendt en 13D/G inden for det seneste år. Tidligere viste vi den fulde historie af 13D/G-arkiver. Generelt skal enheder, der er forpligtet til at indgive 13D/G-ansøgninger, indgive mindst årligt, før de indsender en afsluttende ansøgning. Dog forlader fonde nogle gange positioner uden at indsende en afsluttende ansøgning (dvs. de afvikler), så visning af den fulde historie resulterede nogle gange i forvirring om det nuværende ejerskab. For at undgå forvirring viser vi nu kun 'aktuelle' ejere - det vil sige - ejere, der har anmeldt inden for det seneste år.
Upgrade to unlock premium data.
| Fil dato | Form | Investor | Forrige Aktier |
Seneste Aktier |
Δ Aktier (Procent) |
Ejendomsret (Procent) |
Δ Ejerskab (Procent) |
|
|---|---|---|---|---|---|---|---|---|
| 2026-02-17 | MMCAP International Inc. SPC | 16,642,084 | 16,642,084 | 0.00 | 8.30 | 0.00 | ||
| 2026-02-13 | VAN ECK ASSOCIATES CORP | 18,731,457 | 11,758,539 | -37.23 | 6.28 | -37.26 | ||
| 2025-08-14 | Global X Management CO LLC | 12,487,181 | 10,110,010 | -19.04 | 5.42 | -19.82 |
13F og NPORT arkivering
Detaljer om 13F-arkivering er gratis. Detaljer om NP-ansøgninger kræver et premium-medlemskab. Grønne rækker angiver nye positioner. Røde rækker angiver lukkede positioner. Klik på linket ikon for at se den fulde transaktionshistorik.
Opgrader
for at låse premium-data op og eksportere til Excel ![]() .
.
| Fil dato | Kilde | Investor | Type | Gennemsnitlig pris (Øst) |
Aktier | Δ Aktier (%) |
Rapporteret Værdi ($1000) |
Δ Værdi (%) |
Port Alloc (%) |
|
|---|---|---|---|---|---|---|---|---|---|---|
| 2026-02-09 | 13F | Geode Capital Management, Llc | 2.353.967 | -1,30 | 5.838 | -23,75 | ||||
| 2026-04-06 | 13F | GAMMA Investing LLC | 1.919 | -44,94 | 3 | -62,50 | ||||
| 2026-02-17 | 13F | Nomura Holdings Inc | 1.322.941 | -7,47 | 3.281 | -28,52 | ||||
| 2025-11-04 | 13F | Shakespeare Wealth Management, Inc. | 0 | -100,00 | 0 | |||||
| 2026-02-13 | 13F | Barclays Plc | 352.127 | 6,79 | 873 | -34,46 | ||||
| 2026-02-13 | 13F | Charles Schwab Investment Management Inc | 455.723 | 0,00 | 1.130 | -22,71 | ||||
| 2026-01-15 | 13F | Nisa Investment Advisors, Llc | 4.395 | 0,00 | 11 | -28,57 | ||||
| 2026-02-17 | 13F | Russell Investments Group, Ltd. | 15.255 | 0,00 | 38 | -22,92 | ||||
| 2026-01-27 | 13F | TD Waterhouse Canada Inc. | 786 | 0,00 | 2 | -50,00 | ||||
| 2026-02-13 | 13F | Goehring & Rozencwajg Associates, LLC | 1.227.255 | 5,31 | 3.044 | -18,64 | ||||
| 2026-02-11 | 13F | Jpmorgan Chase & Co | 75.165 | -2,14 | 186 | -24,39 | ||||
| 2026-02-02 | 13F | Principal Financial Group Inc | 0 | -100,00 | 0 | |||||
| 2026-02-13 | 13F | Neuberger Berman Group LLC | 12.571 | 31 | ||||||
| 2025-11-13 | 13F | Hsbc Holdings Plc | 0 | -100,00 | 0 | -100,00 | ||||
| 2026-02-11 | 13F | Los Angeles Capital Management Llc | 127.020 | 102,39 | 412 | 104,48 | ||||
| 2025-11-06 | 13F | CIBC World Markets Inc. | 0 | -100,00 | 0 | |||||
| 2026-02-11 | 13F | Simplex Trading, Llc | 0 | -100,00 | 0 | |||||
| 2026-02-17 | 13F | Two Sigma Advisers, Lp | 443.000 | 65,30 | 1.099 | 27,67 | ||||
| 2026-02-18 | 13F | Caitlin John, LLC | 0 | -100,00 | 0 | -100,00 | ||||
| 2026-02-13 | 13F | Manufacturers Life Insurance Company, The | 0 | -100,00 | 0 | |||||
| 2026-02-17 | 13F | Price T Rowe Associates Inc /md/ | 110.029 | 13,04 | 0 | |||||
| 2026-03-09 | 13F | Flax Pond Capital, Llc | 152.292 | 378 | ||||||
| 2026-02-17 | 13F | Susquehanna International Group, Llp | Call | 445.300 | 1.473,50 | 1.104 | 1.126,67 | |||
| 2025-11-14 | 13F | Segra Capital Management, LLC | 0 | -100,00 | 0 | |||||
| 2026-02-12 | 13F | Voya Investment Management Llc | 35.144 | 0,00 | 87 | -22,32 | ||||
| 2026-02-13 | 13F | Van Eck Associates Corp | 11.751.553 | -26,42 | 29 | -43,14 | ||||
| 2026-02-10 | 13F | Bank of New York Mellon Corp | 528.003 | 0,33 | 1.309 | -22,50 | ||||
| 2026-02-13 | 13F | Wells Fargo & Company/mn | 206.505 | 46,23 | 512 | 13,02 | ||||
| 2026-02-17 | 13F | Susquehanna International Group, Llp | 1.666.924 | -35,27 | 4.134 | -49,99 | ||||
| 2026-02-17 | 13F | Susquehanna International Group, Llp | Put | 180.400 | 266,67 | 447 | 184,71 | |||
| 2026-02-18 | 13F | NFP Retirement, Inc. | 69.000 | 119,05 | 171 | 69,31 | ||||
| 2026-02-17 | 13F | Citadel Advisors Llc | Put | 242.300 | 13,28 | 601 | -12,54 | |||
| 2026-02-17 | 13F | Citadel Advisors Llc | Call | 327.800 | 362,34 | 813 | 257,71 | |||
| 2026-02-06 | 13F | Larson Financial Group LLC | 26.059 | 0,00 | 65 | -22,89 | ||||
| 2026-02-17 | 13F | Citadel Advisors Llc | 1.967.928 | -20,29 | 4.880 | -38,42 | ||||
| 2026-02-17 | 13F | Wellington Management Group Llp | 65.819 | 21,51 | 163 | -5,78 | ||||
| 2025-11-13 | 13F | Total Investment Management Inc | 0 | -100,00 | 0 | |||||
| 2026-02-17 | 13F | Alliancebernstein L.p. | 157.200 | 0,00 | 390 | -22,82 | ||||
| 2026-02-06 | 13F | Entrust Financial Llc | 1.050 | 3 | ||||||
| 2025-11-05 | 13F | Savant Capital, LLC | 0 | -100,00 | 0 | -100,00 | ||||
| 2025-11-14 | 13F | Colony Group, LLC | 0 | -100,00 | 0 | -100,00 | ||||
| 2026-02-17 | 13F | Old Mission Capital Llc | 26.557 | 66 | ||||||
| 2026-02-13 | 13F | State Street Corp | 3.377.192 | -0,55 | 8.375 | -23,17 | ||||
| 2026-02-17 | 13F | Numerai GP LLC | 15.040 | 37 | ||||||
| 2026-02-23 | 13F | Virtu Financial LLC | 61.830 | 25,95 | 0 | |||||
| 2026-01-28 | 13F | Chicago Partners Investment Group LLC | 406.794 | 1.338 | ||||||
| 2026-02-13 | 13F | Natixis | 3.191 | -9,76 | 8 | -36,36 | ||||
| 2026-02-12 | 13F | Dimensional Fund Advisors Lp | 225.887 | -1,41 | 560 | -23,81 | ||||
| 2026-02-13 | 13F | Squarepoint Ops LLC | 269.473 | 668 | ||||||
| 2026-02-17 | 13F | Schonfeld Strategic Advisors LLC | 13.033 | 32 | ||||||
| 2026-02-17 | 13F | Abel Hall, LLC | 21.138 | 52 | ||||||
| 2026-02-09 | 13F | MMCAP International Inc. SPC | 4.316.238 | -0,01 | 10.704 | -22,75 | ||||
| 2026-02-12 | 13F | Sprott Inc. | 145.047 | -44,31 | 360 | -57,06 | ||||
| 2026-02-11 | 13F | Picton Mahoney Asset Management | 914.857 | 3,41 | 2.183 | 109.000,00 | ||||
| 2026-02-17 | 13F | Tudor Investment Corp Et Al | Call | 99.900 | 248 | |||||
| 2026-02-13 | 13F | Sei Investments Co | 11.570 | 0,00 | 29 | -24,32 | ||||
| 2026-02-10 | 13F | Investment Partners, Ltd. | 0 | -100,00 | 0 | |||||
| 2025-11-14 | 13F | Wolverine Trading, Llc | 19.962 | -31,16 | 62 | -19,74 | ||||
| 2025-11-14 | 13F | Wolverine Trading, Llc | Call | 124.200 | 222,60 | 384 | 275,49 | |||
| 2025-11-14 | 13F | Wolverine Trading, Llc | Put | 13.800 | 43 | |||||
| 2026-01-22 | 13F | Accordant Advisory Group Inc | 295.798 | 2,55 | 734 | -20,76 | ||||
| 2026-02-12 | 13F | Nuveen, LLC | 412.478 | 0,00 | 1.023 | -22,81 | ||||
| 2026-02-17 | 13F | Creative Planning | 71.415 | 107,30 | 177 | 60,91 | ||||
| 2026-02-17 | 13F | XTX Topco Ltd | 88.545 | -61,39 | 220 | -70,24 | ||||
| 2026-02-24 | 13F/A | Pacer Advisors, Inc. | 959.401 | 2.379 | ||||||
| 2026-01-29 | 13F | Sanctuary Advisors, LLC | 17.530 | 74,78 | 43 | 34,38 | ||||
| 2026-02-09 | 13F | Themes Management Co LLC | 85.859 | 205 | ||||||
| 2026-01-26 | 13F | Abbington Investment Group | 235.755 | 585 | ||||||
| 2026-02-12 | 13F | New York State Common Retirement Fund | 49.478 | 0,00 | 123 | -22,78 | ||||
| 2025-10-15 | 13F | Vontobel Holding Ltd. | 0 | -100,00 | 0 | -100,00 | ||||
| 2026-04-02 | 13F | Marex Group plc | 126.952 | 174 | ||||||
| 2026-01-29 | 13F | IMC-Chicago, LLC | 154.701 | 101,51 | 384 | 55,69 | ||||
| 2026-02-13 | 13F | SRS Capital Advisors, Inc. | 11.545 | 898,70 | 0 | -100,00 | ||||
| 2026-02-17 | 13F | MIRAE ASSET GLOBAL ETFS HOLDINGS Ltd. | 12.093.720 | 11,99 | 28.858 | -17,18 | ||||
| 2026-02-13 | 13F | Prudential Financial Inc | 10.655 | -52,33 | 26 | -63,38 | ||||
| 2026-02-17 | 13F | Odyssean, LLC | 41.364 | 103 | ||||||
| 2026-02-13 | 13F | Y-Intercept (Hong Kong) Ltd | 166.639 | 413 | ||||||
| 2026-02-18 | 13F | Mackenzie Financial Corp | 11.510 | 0,00 | 27 | -25,00 | ||||
| 2026-01-27 | 13F | Zurcher Kantonalbank (Zurich Cantonalbank) | 0 | -100,00 | 0 | -100,00 | ||||
| 2026-02-17 | 13F | Aqr Capital Management Llc | 63.864 | 16,76 | 158 | -9,71 | ||||
| 2026-02-17 | 13F | Bank Of America Corp /de/ | Call | 0 | -100,00 | 0 | ||||
| 2026-02-24 | 13F | Bell Investment Advisors, Inc | 0 | -100,00 | 0 | |||||
| 2026-02-11 | 13F | Ameritas Investment Partners, Inc. | 15.568 | 39 | ||||||
| 2026-02-13 | 13F | Peak6 Llc | 249.976 | 17,16 | 620 | -9,50 | ||||
| 2026-01-29 | 13F | UBS Group AG | Call | 8.739.931 | 0,00 | 21.675 | -22,74 | |||
| 2026-02-13 | 13F | Peak6 Llc | Call | 2.090.600 | 88,82 | 5.185 | 45,86 | |||
| 2026-01-29 | 13F | UBS Group AG | 2.581.210 | 17,19 | 6.401 | -9,46 | ||||
| 2026-02-17 | 13F | Lloyd Harbor Capital Management, LLC | 0 | -100,00 | 0 | |||||
| 2026-02-17 | 13F | Quadrature Capital Ltd | 117.676 | 292 | ||||||
| 2026-02-17 | 13F | Mirabella Financial Services Llp | 600.000 | -29,41 | 1.488 | -45,45 | ||||
| 2026-02-13 | 13F | Sterling Capital Management LLC | 10.626 | -16,38 | 26 | -35,00 | ||||
| 2026-02-06 | 13F | EverSource Wealth Advisors, LLC | 174 | 0,00 | 0 | |||||
| 2026-02-12 | 13F | Cibc World Markets Corp | 12.184 | -46,31 | 30 | -53,12 | ||||
| 2026-02-17 | 13F | Caption Management, LLC | 7.500 | -70,00 | 19 | -77,50 | ||||
| 2026-02-17 | 13F | Advisor Group Holdings, Inc. | 8.056 | -21,21 | 20 | -20,83 | ||||
| 2026-02-11 | 13F | Deutsche Bank Ag\ | 747.641 | -1,77 | 1.854 | -24,11 | ||||
| 2026-02-12 | 13F | Xponance, Inc. | 14.359 | 0,00 | 36 | -23,91 | ||||
| 2026-02-13 | 13F | Gts Securities Llc | 49.221 | 7,62 | 122 | -16,44 | ||||
| 2026-02-12 | 13F | Hohimer Wealth Management, Llc | 0 | -100,00 | 0 | |||||
| 2026-01-08 | 13F | True Wealth Design, LLC | 109 | 0,00 | 0 | |||||
| 2026-02-03 | 13F | Ethic Inc. | 10.980 | 27 | ||||||
| 2026-02-12 | 13F | EntryPoint Capital, LLC | 84.883 | 211 | ||||||
| 2026-02-17 | 13F | Raymond James Financial Inc | 34.904 | 42,83 | 87 | 10,26 | ||||
| 2026-02-13 | 13F | National Bank Of Canada /fi/ | 242.748 | 1,18 | 574 | -23,36 | ||||
| 2026-02-17 | 13F | Northern Trust Corp | 917.339 | -13,65 | 2.275 | -33,28 | ||||
| 2026-02-04 | 13F | LRI Investments, LLC | 197 | 0 | ||||||
| 2026-02-11 | 13F | Group One Trading, L.p. | 83.189 | 206 | ||||||
| 2026-02-09 | 13F | GeoSphere Capital Management | 1.300.000 | 333,33 | 3.224 | 234,79 | ||||
| 2026-01-14 | 13F | ORG Partners LLC | 4.640 | 0,00 | 12 | -21,43 | ||||
| 2026-02-18 | 13F | GWM Advisors LLC | 478.655 | 32,72 | 1.187 | 2,59 | ||||
| 2026-02-09 | 13F | Legal & General Group Plc | 16.363 | 0,00 | 41 | -23,08 | ||||
| 2026-01-23 | 13F | Azarias Capital Management, L.P. | 4.132.851 | 2,48 | 10.249 | -20,83 | ||||
| 2026-02-03 | 13F | Ballentine Partners, LLC | 10.431 | -9,30 | 26 | -30,56 | ||||
| 2026-02-10 | 13F | Quantbot Technologies LP | 208.234 | 516 | ||||||
| 2025-11-14 | 13F | Centiva Capital, LP | 0 | -100,00 | 0 | -100,00 | ||||
| 2026-02-05 | 13F | Amalgamated Bank | 5.786 | -7,66 | 0 | |||||
| 2026-01-28 | 13F | Eagle Global Advisors Llc | 100.300 | 0,00 | 249 | -22,74 | ||||
| 2026-02-17 | 13F | Royal Bank Of Canada | 12.475 | -86,78 | 31 | -89,80 | ||||
| 2026-01-26 | 13F | Cwm, Llc | 4.514 | 105,56 | 0 | |||||
| 2026-02-17 | 13F | Massar Capital Management, LP | 92.631 | 230 | ||||||
| 2025-11-14 | 13F | OMERS ADMINISTRATION Corp | 0 | -100,00 | 0 | |||||
| 2026-02-12 | 13F | Jane Street Group, Llc | Put | 0 | -100,00 | 0 | -100,00 | |||
| 2026-01-29 | 13F | Vanguard Group Inc | 1.112.185 | 2,53 | 2.758 | -20,79 | ||||
| 2026-03-23 | 13F | J. Derek Lewis & Associates Inc. | 29.000 | 72 | ||||||
| 2026-02-10 | 13F | CIBC Asset Management Inc | 21.734 | 54 | ||||||
| 2025-11-04 | 13F | Winnow Wealth Llc | 0 | -100,00 | 0 | |||||
| 2026-02-13 | 13F | Rhumbline Advisers | 197.894 | -20,12 | 491 | -38,36 | ||||
| 2025-11-10 | 13F | Atomi Financial Group, Inc. | 0 | -100,00 | 0 | |||||
| 2026-02-13 | 13F | Marshall Wace, Llp | 0 | -100,00 | 0 | |||||
| 2026-02-12 | 13F | MetLife Investment Management, LLC | 107.029 | -2,91 | 265 | -24,93 | ||||
| 2026-02-13 | 13F | JustInvest LLC | 18.600 | 39,85 | 46 | 9,52 | ||||
| 2026-02-04 | 13F | UNIVEST FINANCIAL Corp | 15.204 | -0,01 | 38 | -22,92 | ||||
| 2026-02-17 | 13F | Two Sigma Investments, Lp | 1.695.250 | 43,05 | 4.204 | 10,52 | ||||
| 2026-02-17 | 13F | Jones Financial Companies Lllp | 11.714 | 592,73 | 29 | 480,00 | ||||
| 2026-02-13 | 13F | Nicholas Investment Partners, LP | 0 | -100,00 | 0 | |||||
| 2026-02-17 | 13F | Main Street Financial Solutions, LLC | 0 | -100,00 | 0 | |||||
| 2025-11-14 | 13F | Hrt Financial Lp | 0 | -100,00 | 0 | |||||
| 2026-02-10 | 13F | Lido Advisors, LLC | 15.908 | 0,00 | 51 | 0,00 | ||||
| 2026-02-17 | 13F | Fmr Llc | 37.380 | 73,89 | 93 | 33,33 | ||||
| 2026-01-30 | 13F | Bogart Wealth, LLC | 0 | -100,00 | 0 | |||||
| 2025-11-24 | 13F | CIBC Private Wealth Group, LLC | 0 | -100,00 | 0 | -100,00 | ||||
| 2026-02-11 | 13F | Zions Bancorporation, National Association /ut/ | 3.910 | 10 | ||||||
| 2025-10-21 | 13F | Signaturefd, Llc | 0 | -100,00 | 0 | |||||
| 2026-01-28 | 13F | City State Bank | 1.000 | 0,00 | 2 | -33,33 | ||||
| 2026-02-17 | 13F | Two Sigma Securities, Llc | 48.313 | 120 | ||||||
| 2026-02-17 | 13F | Scientech Research LLC | 11.893 | -81,14 | 29 | -85,64 | ||||
| 2026-02-17 | 13F | California State Teachers Retirement System | 11.334 | -1,70 | 28 | -24,32 | ||||
| 2026-02-17 | 13F | Millennium Management Llc | 540.948 | 58,53 | 1.342 | 22,13 | ||||
| 2025-11-13 | 13F | Rathbone Brothers plc | 0 | -100,00 | 0 | |||||
| 2026-01-23 | 13F | Farther Finance Advisors, LLC | 8.418 | 0,15 | 21 | -23,08 | ||||
| 2026-02-05 | 13F | Cambridge Investment Research Advisors, Inc. | 191.568 | 252,45 | 0 | |||||
| 2026-02-10 | 13F | Goldman Sachs Group Inc | 1.041.746 | 135,75 | 2.584 | 82,16 | ||||
| 2026-02-17 | 13F | Parallax Volatility Advisers, L.P. | Call | 470.300 | -15,26 | 1.166 | -34,53 | |||
| 2026-02-19 | 13F | Invesco Ltd. | 148.110 | 2,38 | 367 | -20,91 | ||||
| 2026-02-17 | 13F | Parallax Volatility Advisers, L.P. | 68.008 | -3,33 | 169 | -25,33 | ||||
| 2026-02-12 | 13F | Jane Street Group, Llc | 902.292 | 1.574,01 | 2.238 | 1.193,06 | ||||
| 2026-02-12 | 13F | Jane Street Group, Llc | Call | 43.500 | -87,42 | 108 | -90,36 | |||
| 2026-01-28 | 13F | U S Global Investors Inc | 50.000 | 0,00 | 119 | -26,09 | ||||
| 2026-02-11 | 13F | LPL Financial LLC | 50.374 | 38,01 | 125 | 5,98 | ||||
| 2026-02-12 | 13F | Bank Of Montreal /can/ | Call | 332.100 | 791 | |||||
| 2026-02-10 | 13F | Rothschild Investment Llc | 186 | 9,41 | 0 | |||||
| 2026-02-05 | 13F | Allworth Financial LP | 2.234 | 11,59 | 6 | -16,67 | ||||
| 2026-02-13 | 13F | Morgan Stanley | 3.887.389 | 83,10 | 9.641 | 41,45 | ||||
| 2025-11-21 | 13F/A | CIBC Bancorp USA Inc. | 19.633 | 63 | ||||||
| 2026-02-13 | 13F | Bridgewater Associates, LP | 0 | -100,00 | 0 | |||||
| 2026-01-21 | 13F | Stone House Investment Management, LLC | 0 | -100,00 | 0 | |||||
| 2026-02-17 | 13F/A | Laurion Capital Management LP | 11.546 | 29 | ||||||
| 2026-02-13 | 13F | American Century Companies Inc | 237.302 | 46,85 | 589 | 13,51 | ||||
| 2026-02-13 | 13F | Caitong International Asset Management Co., Ltd | 37.566 | 361,67 | 93 | 257,69 | ||||
| 2026-02-17 | 13F | Optiver Holding B.V. | 1.421 | -4,37 | 4 | -25,00 | ||||
| 2026-02-11 | 13F | Franklin Resources Inc | 17.308 | -19,72 | 43 | -39,13 | ||||
| 2026-02-18 | 13F | Vident Advisory, LLC | 2.943.795 | -10,63 | 7.023 | -33,94 | ||||
| 2026-01-09 | 13F | SG Americas Securities, LLC | 116.746 | 244,57 | 0 | |||||
| 2026-02-17 | 13F | D. E. Shaw & Co., Inc. | 329.944 | 96,66 | 818 | 52,04 | ||||
| 2026-02-17 | 13F | Balyasny Asset Management Llc | 0 | -100,00 | 0 | |||||
| 2026-02-12 | 13F | Bank Of Montreal /can/ | Put | 100 | 0,00 | 0 | ||||
| 2026-02-12 | 13F | Bank Of Montreal /can/ | 26.506 | 3,85 | 63 | -23,17 | ||||
| 2026-02-13 | 13F | Umb Bank N A/mo | 3.333 | 8 | ||||||
| 2026-02-17 | 13F | Graham Capital Management, L.P. | 119.236 | 296 | ||||||
| 2026-02-13 | 13F | Extract Advisors LLC | Call | 5.950.100 | 14.756 | |||||
| 2026-02-17 | 13F/A | Cantor Fitzgerald, L. P. | 0 | -100,00 | 0 | -100,00 | ||||
| 2026-02-17 | 13F | Tower Research Capital LLC (TRC) | 15.486 | -20,94 | 38 | -38,71 | ||||
| 2026-02-17 | 13F | Van Den Berg Management I, Inc | 10.000 | 0,00 | 25 | -25,00 | ||||
| 2026-02-06 | 13F | Pnc Financial Services Group, Inc. | 6.133 | -14,65 | 15 | -34,78 | ||||
| 2026-02-13 | 13F | Southport Management, L.l.c. | 225.000 | 0,00 | 558 | -22,71 | ||||
| 2026-02-12 | 13F | BlackRock, Inc. | 10.459.158 | 1,47 | 25.939 | -21,61 | ||||
| 2026-02-09 | 13F | Harbour Investments, Inc. | 132 | 0,00 | 0 | |||||
| 2026-02-17 | 13F | Bank Of America Corp /de/ | 533.908 | 54,50 | 1.324 | 19,39 | ||||
| 2025-11-12 | 13F | Steward Partners Investment Advisory, Llc | 0 | -100,00 | 0 | -100,00 | ||||
| 2026-02-10 | 13F | Intech Investment Management Llc | 68.650 | 6,55 | 170 | -17,48 | ||||
| 2026-02-13 | 13F | Citigroup Inc | 326.657 | 35,07 | 779 | -0,13 | ||||
| 2026-02-13 | 13F | Citigroup Inc | Call | 367.300 | 0,00 | 876 | -26,08 | |||
| 2026-02-12 | 13F | Federation des caisses Desjardins du Quebec | 154.724 | -76,28 | 367 | -82,11 | ||||
| 2026-02-09 | 13F | Keating Financial Advisory Services, Inc. | 237 | 1 | ||||||
| 2026-02-06 | 13F | ProShare Advisors LLC | 33.607 | 6,71 | 83 | -17,82 | ||||
| 2026-02-13 | 13F | Police & Firemen's Retirement System of New Jersey | 55.482 | 3,03 | 138 | -20,35 | ||||
| 2026-02-06 | 13F | Banque Cantonale Vaudoise | 201.104 | 221,75 | 480 | |||||
| 2026-02-12 | 13F | Quadrant Capital Group Llc | 1.115 | 73,14 | 3 | 0,00 |