Grundlæggende statistik
| Institutionelle aktier (lange) | 66.860.076 - 64,12% (ex 13D/G) - change of -6,98MM shares -9,46% MRQ |
| Institutionel værdi (lang) | $ 1.736.825 USD ($1000) |
Institutionelt ejerskab og aktionærer
Ero Copper Corp. (US:ERO) har 163 institutionelle ejere og aktionærer, der har indsendt 13D/G- eller 13F-formularer til Securities Exchange Commission (SEC). Disse institutioner har i alt 66,860,076 aktier. Største aktionærer omfatter Fmr Llc, FIL Ltd, Price T Rowe Associates Inc /md/, Gmt Capital Corp, MIRAE ASSET GLOBAL ETFS HOLDINGS Ltd., Invesco Ltd., Vanguard Group Inc, Jennison Associates Llc, Cape Ann Asset Management Ltd, and Hillsdale Investment Management Inc. .
Ero Copper Corp. (NYSE:ERO) institutionel ejerskabsstruktur viser aktuelle positioner i virksomheden efter institutioner og fonde, samt seneste ændringer i positionsstørrelse. Større aktionærer kan omfatte individuelle investorer, investeringsforeninger, hedgefonde eller institutioner. Skema 13D angiver, at investoren besidder (eller besidder) mere end 5 % af virksomheden og har til hensigt (eller har til hensigt at) aktivt at forfølge en ændring i forretningsstrategi. Skema 13G indikerer en passiv investering på over 5%.
The share price as of April 24, 2026 is 27,31 / share. Previously, on April 25, 2025, the share price was 12,62 / share. This represents an increase of 116,40% over that period.

Fondens stemningsscore
Fund Sentiment Score (fka Ownership Accumulation Score) finder de aktier, der bliver mest købt af fonde. Det er resultatet af en sofistikeret, multi-faktor kvantitativ model, der identificerer virksomheder med de højeste niveauer af institutionel akkumulering. Scoringsmodellen bruger en kombination af den samlede stigning i oplyste ejere, ændringerne i porteføljeallokeringer i disse ejere og andre målinger. Tallet går fra 0 til 100, hvor højere tal indikerer et højere niveau af akkumulering for sine jævnaldrende, og 50 er gennemsnittet.
Opdateringsfrekvens: Dagligt
Se Ownership Explorer, som giver en liste over højest rangerende virksomheder.
AI+ Ask Fintel’s AI assistant about Ero Copper Corp..
Select a question to share a public post with an AI-crafted answer.
Thinking of good questions…
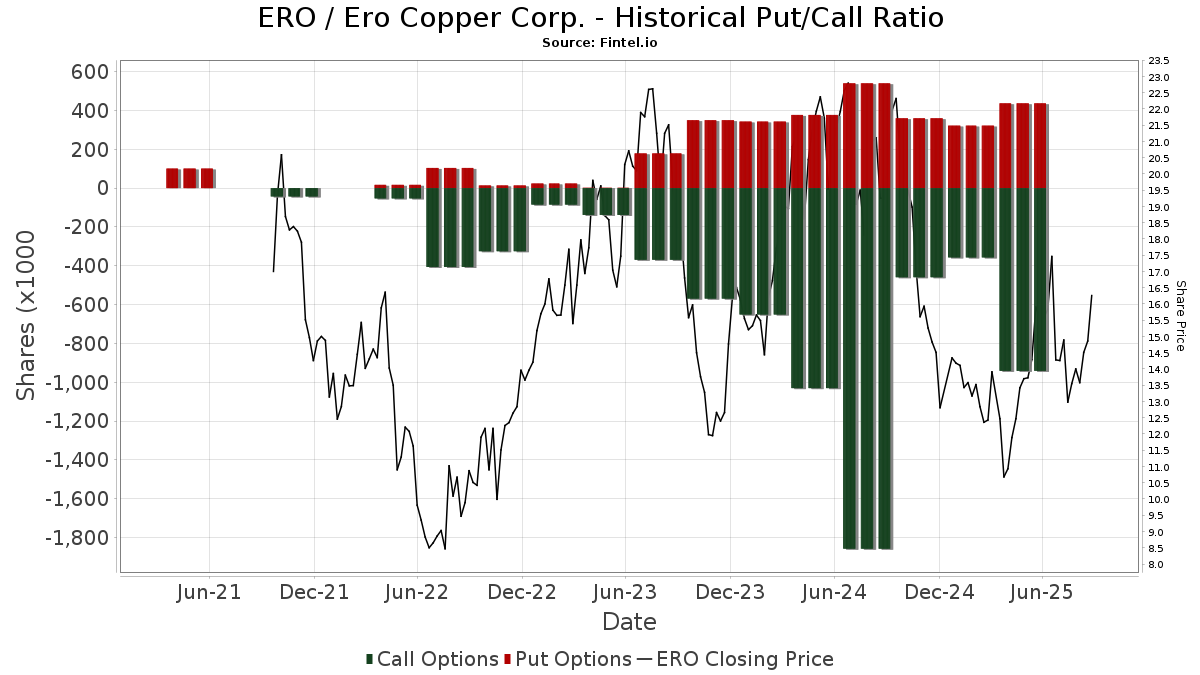
Institutionel Put/Call-forhold
Ud over at indberette standardaktie- og gældsudstedelser skal institutter med mere end 100 mill. aktiver under forvaltning også oplyse deres put- og call-optionsbeholdninger. Da salgsoptioner generelt indikerer negativ stemning, og købsoptioner indikerer positiv stemning, kan vi få en fornemmelse af den overordnede institutionelle stemning ved at plotte forholdet mellem put og kald. Diagrammet til højre viser det historiske put/call-forhold for dette instrument.
Brug af Put/Call Ratio som en indikator for investorernes stemning overvinder en af de vigtigste mangler ved at bruge totalt institutionelt ejerskab, som er, at en betydelig mængde af aktiver under forvaltning investeres passivt for at spore indekser. Passivt forvaltede fonde køber typisk ikke optioner, så indikatoren for put/call-forholdet følger mere nøje følelsen af aktivt forvaltede fonde.
13D/G-arkivering
Vi præsenterer 13D/G ansøgninger separat fra 13F ansøgninger på grund af den forskellige behandling af SEC. 13D/G-ansøgninger kan indgives af grupper af investorer (med én ledende), hvorimod 13F-ansøgninger ikke kan. Dette resulterer i situationer, hvor en investor kan indsende en 13D/G, der rapporterer én værdi for de samlede aktier (der repræsenterer alle de aktier, der ejes af investorgruppen), men derefter indsender en 13F, der rapporterer en anden værdi for de samlede aktier (der udelukkende repræsenterer deres egne) ejendomsret). Det betyder, at aktieejerskab af 13D/G-arkiver og 13F-arkiveringer ofte ikke er direkte sammenlignelige, så vi præsenterer dem separat.
Bemærk: Fra den 16. maj 2021 viser vi ikke længere ejere, der ikke har indsendt en 13D/G inden for det seneste år. Tidligere viste vi den fulde historie af 13D/G-arkiver. Generelt skal enheder, der er forpligtet til at indgive 13D/G-ansøgninger, indgive mindst årligt, før de indsender en afsluttende ansøgning. Dog forlader fonde nogle gange positioner uden at indsende en afsluttende ansøgning (dvs. de afvikler), så visning af den fulde historie resulterede nogle gange i forvirring om det nuværende ejerskab. For at undgå forvirring viser vi nu kun 'aktuelle' ejere - det vil sige - ejere, der har anmeldt inden for det seneste år.
Upgrade to unlock premium data.
| Fil dato | Form | Investor | Forrige Aktier |
Seneste Aktier |
Δ Aktier (Procent) |
Ejendomsret (Procent) |
Δ Ejerskab (Procent) |
|
|---|---|---|---|---|---|---|---|---|
| 2026-02-13 | GMT CAPITAL CORP | 6,509,454 | 4,472,154 | -31.30 | 4.30 | -31.53 | ||
| 2025-11-07 | FIL Ltd | 6,703,995 | 11,471,710 | 71.12 | 11.10 | 70.77 |
13F og NPORT arkivering
Detaljer om 13F-arkivering er gratis. Detaljer om NP-ansøgninger kræver et premium-medlemskab. Grønne rækker angiver nye positioner. Røde rækker angiver lukkede positioner. Klik på linket ikon for at se den fulde transaktionshistorik.
Opgrader
for at låse premium-data op og eksportere til Excel ![]() .
.
| Fil dato | Kilde | Investor | Type | Gennemsnitlig pris (Øst) |
Aktier | Δ Aktier (%) |
Rapporteret Værdi ($1000) |
Δ Værdi (%) |
Port Alloc (%) |
|
|---|---|---|---|---|---|---|---|---|---|---|
| 2026-02-13 | 13F | Global Strategic Management Inc | 18.608 | 1 | ||||||
| 2026-02-13 | 13F | Marshall Wace, Llp | 0 | -100,00 | 0 | |||||
| 2026-04-14 | 13F | Nbc Securities, Inc. | 7.249 | -25,71 | 193 | -30,07 | ||||
| 2026-02-12 | 13F | Northwest & Ethical Investments L.P. | 48.293 | -3,03 | 1.366 | 36,74 | ||||
| 2026-02-13 | 13F | Walleye Trading LLC | Call | 94.500 | 864,29 | 2.673 | 1.250,00 | |||
| 2026-02-13 | 13F | Walleye Trading LLC | Put | 33.600 | 11.100,00 | 951 | 15.733,33 | |||
| 2026-02-17 | 13F | Investment Management Corp of Ontario | 12.677 | 359 | ||||||
| 2026-02-17 | 13F | Ninepoint Partners LP | 25.000 | -66,67 | 707 | -53,39 | ||||
| 2026-01-13 | 13F | Synergy Financial Management, LLC | 10.783 | 305 | ||||||
| 2026-02-13 | 13F | Wells Fargo & Company/mn | 47.872 | 4.939,16 | 1.354 | 7.026,32 | ||||
| 2026-02-17 | 13F | Two Sigma Advisers, Lp | 106.100 | 3.002 | ||||||
| 2026-02-10 | 13F | Quantbot Technologies LP | 183.517 | 193,09 | 5.192 | 310,03 | ||||
| 2026-02-12 | 13F | Renaissance Technologies Llc | 48.476 | 1.371 | ||||||
| 2026-02-17 | 13F | Advisor Group Holdings, Inc. | 1.205 | -16,67 | 34 | 54,55 | ||||
| 2026-01-30 | 13F | North Star Investment Management Corp. | 0 | -100,00 | 0 | |||||
| 2026-02-17 | 13F | CastleKnight Management LP | 85.000 | 0,00 | 2.405 | 39,85 | ||||
| 2026-02-17 | 13F | Alliancebernstein L.p. | 11.843 | 0,00 | 335 | 40,17 | ||||
| 2026-02-13 | 13F | Toroso Investments, LLC | 79.184 | 80,97 | 2.243 | 153,05 | ||||
| 2026-02-13 | 13F | Boston Partners | 0 | -100,00 | 0 | |||||
| 2026-02-17 | 13F | Public Employees Retirement System Of Ohio | 32.833 | 3,49 | 933 | 45,17 | ||||
| 2026-02-13 | 13F | National Bank Of Canada /fi/ | 186.027 | 103,36 | 5.246 | 184,44 | ||||
| 2026-02-13 | 13F | Cape Ann Asset Management Ltd | 1.717.643 | 65,93 | 48.592 | 132,05 | ||||
| 2026-01-27 | 13F | TD Waterhouse Canada Inc. | 17.852 | 2,17 | 503 | 39,83 | ||||
| 2025-11-14 | 13F | Ubs Asset Management Americas Inc | 0 | -100,00 | 0 | |||||
| 2026-02-12 | 13F | Campbell & CO Investment Adviser LLC | 50.987 | 70,47 | 1.442 | 138,35 | ||||
| 2025-11-04 | 13F | Jones Financial Companies Lllp | 0 | -100,00 | 0 | -100,00 | ||||
| 2026-02-12 | 13F | Steward Partners Investment Advisory, Llc | 100 | 0,00 | 3 | 0,00 | ||||
| 2026-02-13 | 13F | OMERS ADMINISTRATION Corp | 0 | -100,00 | 0 | |||||
| 2026-04-20 | 13F | Concurrent Investment Advisors, LLC | 0 | -100,00 | 0 | -100,00 | ||||
| 2026-02-17 | 13F | Schonfeld Strategic Advisors LLC | 46.694 | 79,48 | 1.321 | 150,95 | ||||
| 2026-01-23 | 13F | Sumitomo Mitsui Trust Holdings, Inc. | 0 | -100,00 | 0 | |||||
| 2026-02-12 | 13F | Dimensional Fund Advisors Lp | 958.154 | 24,86 | 27.108 | 74,64 | ||||
| 2026-01-29 | 13F | Montrusco Bolton Investments Inc. | 509.963 | -33,42 | 14.446 | -6,90 | ||||
| 2026-02-13 | 13F | Van Eck Associates Corp | 101.503 | -81,03 | 3 | -80,00 | ||||
| 2026-04-15 | 13F | Financial Management Professionals, Inc. | 810 | 22 | ||||||
| 2026-02-10 | 13F | Goldman Sachs Group Inc | Call | 0 | -100,00 | 0 | -100,00 | |||
| 2026-04-22 | 13F | Patriot Financial Group Insurance Agency, LLC | 19.960 | 532 | ||||||
| 2026-02-17 | 13F | Caption Management, LLC | 0 | -100,00 | 0 | -100,00 | ||||
| 2026-01-28 | 13F | Kapitalo Investimentos Ltda | 1.076.696 | 0,00 | 30.460 | 39,84 | ||||
| 2026-02-11 | 13F | Picton Mahoney Asset Management | 78.658 | -87,36 | 2.228 | 18.466,67 | ||||
| 2026-02-12 | 13F | Sprott Inc. | 806.451 | 4,13 | 22.819 | 45,64 | ||||
| 2026-02-17 | 13F | Man Group plc | 53.162 | 71,70 | 1.505 | 140,42 | ||||
| 2026-04-24 | 13F | Root Financial Partners, LLC | 15 | 0 | ||||||
| 2026-02-12 | 13F | Polen Capital Management Llc | 45.544 | 1.288 | ||||||
| 2026-02-17 | 13F | Numerai GP LLC | 8.687 | 246 | ||||||
| 2026-02-17 | 13F | Shay Capital LLC | 0 | -100,00 | 0 | |||||
| 2026-02-13 | 13F | Charles Schwab Investment Management Inc | 195.774 | 43,84 | 5.546 | 101,12 | ||||
| 2026-02-17 | 13F | Point72 Asset Management, L.P. | Call | 27.800 | 786 | |||||
| 2026-02-17 | 13F | Point72 Asset Management, L.P. | 219.385 | 17,48 | 6.208 | 64,21 | ||||
| 2026-02-17 | 13F | Point72 Asset Management, L.P. | Put | 35.200 | 996 | |||||
| 2025-11-07 | 13F | Shell Asset Management Co | 1.469 | -72,54 | 0 | |||||
| 2025-11-14 | 13F | Maverick Capital Ltd | 0 | -100,00 | 0 | -100,00 | ||||
| 2026-02-11 | 13F | Simplex Trading, Llc | 7.792 | -90,41 | 220 | 21.900,00 | ||||
| 2026-04-16 | 13F | Sheets Smith Wealth Management | 20.828 | -0,13 | 554 | -6,10 | ||||
| 2026-04-14 | 13F | Thurston, Springer, Miller, Herd & Titak, Inc. | 0 | -100,00 | 0 | |||||
| 2026-02-10 | 13F | Meramec Financial Planners, LLC | 3 | 0 | ||||||
| 2026-02-17 | 13F | Amundi | 481.650 | -11,97 | 13.626 | 15,09 | ||||
| 2026-02-17 | 13F | SIG North Trading, ULC | Put | 9.800 | -42,01 | 277 | -18,77 | |||
| 2026-04-22 | 13F | Samalin Investment Counsel, LLC | 37.214 | -0,78 | 992 | -6,50 | ||||
| 2026-02-17 | 13F | SIG North Trading, ULC | Call | 36.600 | -3,43 | 1.035 | 35,12 | |||
| 2026-02-17 | 13F | SIG North Trading, ULC | 9.705 | 275 | ||||||
| 2026-02-17 | 13F | FIL Ltd | 11.670.422 | 74,08 | 330.161 | 143,13 | ||||
| 2026-02-17 | 13F | MIRAE ASSET GLOBAL ETFS HOLDINGS Ltd. | 3.072.531 | 22,55 | 87.037 | 71,35 | ||||
| 2026-02-13 | 13F/A | Alberta Investment Management Corp | 0 | -100,00 | 0 | |||||
| 2026-02-10 | 13F | Hillsdale Investment Management Inc. | 1.685.445 | 602,85 | 47.767 | 883,65 | ||||
| 2026-02-12 | 13F | Nuveen, LLC | 73.525 | 0,00 | 2.083 | 39,83 | ||||
| 2025-11-13 | 13F | Pinpoint Asset Management (Singapore) Pte. Ltd. | 0 | -100,00 | 0 | |||||
| 2025-11-14 | 13F | Nomura Holdings Inc | Call | 0 | -100,00 | 0 | ||||
| 2026-02-13 | 13F | Y-Intercept (Hong Kong) Ltd | 47.618 | 1.347 | ||||||
| 2026-02-17 | 13F | Toronto Dominion Bank | 396.362 | 11.213 | ||||||
| 2026-01-29 | 13F | UBS Group AG | 128.501 | -58,97 | 3.635 | -42,62 | ||||
| 2026-02-13 | 13F | Smartleaf Asset Management LLC | 24 | 1 | ||||||
| 2026-02-04 | 13F | Sentry Investment Management Llc | 0 | -100,00 | 0 | |||||
| 2026-02-17 | 13F | Prelude Capital Management, Llc | 0 | -100,00 | 0 | |||||
| 2026-02-17 | 13F | Jain Global LLC | 13.300 | 12,71 | 376 | 57,98 | ||||
| 2026-02-17 | 13F | Caption Management, LLC | Call | 125.000 | 3.536 | |||||
| 2026-02-12 | 13F | Alps Advisors Inc | 45.666 | 50,84 | 1.292 | 110,95 | ||||
| 2026-02-18 | 13F | Mackenzie Financial Corp | 103.787 | 73,63 | 2.973 | 145,62 | ||||
| 2026-02-13 | 13F | Macquarie Group Ltd | 1.921 | -92,73 | 54 | -89,89 | ||||
| 2026-02-11 | 13F | CenterBook Partners LP | 33.108 | 937 | ||||||
| 2025-11-14 | 13F | Verition Fund Management LLC | 0 | -100,00 | 0 | |||||
| 2026-02-17 | 13F | Trexquant Investment LP | 0 | -100,00 | 0 | |||||
| 2026-02-18 | 13F | State of Tennessee, Treasury Department | 7.808 | 262 | ||||||
| 2026-04-20 | 13F | Banque Cantonale Vaudoise | 9.000 | 20,00 | 239 | 12,74 | ||||
| 2026-02-17 | 13F | Royal Bank Of Canada | 158.537 | -46,15 | 4.485 | -24,70 | ||||
| 2026-02-17 | 13F | Raymond James Financial Inc | Call | 10.000 | 250 | |||||
| 2026-02-17 | 13F | Raymond James Financial Inc | 525.569 | 580,83 | 14.868 | 852,47 | ||||
| 2026-01-29 | 13F | IMC-Chicago, LLC | 0 | -100,00 | 0 | |||||
| 2026-02-17 | 13F | MAC Alpha Capital Management, LP | 351.237 | 9.966 | ||||||
| 2026-04-17 | 13F | AdvisorNet Financial, Inc | 0 | -100,00 | 0 | |||||
| 2026-02-12 | 13F | Scotia Capital Inc. | 178.818 | -41,60 | 5.017 | -18,44 | ||||
| 2026-02-11 | 13F | Group One Trading, L.p. | 0 | -100,00 | 0 | |||||
| 2026-02-13 | 13F | Impala Asset Management LLC | 950.000 | -44,36 | 26.949 | -14,81 | ||||
| 2026-03-12 | 13F/A | Peak6 Llc | Call | 508.000 | -53,79 | 14.371 | -35,38 | |||
| 2026-03-12 | 13F/A | Peak6 Llc | Put | 5.800 | 164 | |||||
| 2026-02-10 | 13F | CIBC World Markets Inc. | 30.830 | -39,07 | 872 | -14,84 | ||||
| 2026-02-17 | 13F | Leonteq Securities AG | 0 | -100,00 | 0 | |||||
| 2026-02-17 | 13F | CastleKnight Management LP | Call | 0 | -100,00 | 0 | ||||
| 2026-02-09 | 13F | Legal & General Group Plc | 111.936 | -8,27 | 3.171 | 28,24 | ||||
| 2026-02-17 | 13F | Lighthouse Investment Partners, LLC | 0 | -100,00 | 0 | -100,00 | ||||
| 2026-02-13 | 13F | Walleye Capital LLC | Put | 20.400 | 750,00 | 577 | 1.102,08 | |||
| 2026-02-13 | 13F | Walleye Capital LLC | 34.066 | 560,58 | 964 | 825,96 | ||||
| 2026-02-13 | 13F | Walleye Capital LLC | Call | 21.200 | 523,53 | 600 | 780,88 | |||
| 2025-11-14 | 13F | Millennium Management Llc | 0 | -100,00 | 0 | |||||
| 2026-02-10 | 13F | CIBC Asset Management Inc | 95.032 | 2,04 | 2.690 | 42,78 | ||||
| 2026-02-17 | 13F | Lazard Asset Management Llc | 68.362 | -55,04 | 1.934 | -37,14 | ||||
| 2026-02-12 | 13F | Jane Street Group, Llc | 194.300 | 269,19 | 5.497 | 416,54 | ||||
| 2026-02-17 | 13F | Credit Agricole S A | 49.578 | 1.403 | ||||||
| 2026-02-12 | 13F | Jane Street Group, Llc | Put | 40.400 | -36,58 | 1.143 | -11,34 | |||
| 2026-02-13 | 13F | BRITISH COLUMBIA INVESTMENT MANAGEMENT Corp | 55.037 | -8,84 | 1.557 | 27,41 | ||||
| 2026-02-12 | 13F | Jane Street Group, Llc | Call | 300.300 | 148,59 | 8.495 | 247,73 | |||
| 2026-02-13 | 13F | Great West Life Assurance Co /can/ | 87.933 | -30,41 | 2 | 0,00 | ||||
| 2026-02-13 | 13F | Quarry LP | 4 | -98,90 | 0 | -100,00 | ||||
| 2026-01-23 | 13F | Guidance Capital, Inc | 8.165 | 253 | ||||||
| 2026-02-12 | 13F | CoreCommodity Management, LLC | 47.150 | -17,49 | 1.339 | 15,74 | ||||
| 2026-02-17 | 13F | XTX Topco Ltd | 0 | -100,00 | 0 | |||||
| 2026-02-17 | 13F | Massar Capital Management, LP | 115.734 | 3.274 | ||||||
| 2026-02-18 | 13F | Beacon Pointe Advisors, LLC | 11.103 | 314 | ||||||
| 2026-02-11 | 13F | Deutsche Bank Ag\ | 12.890 | -18,72 | 365 | 13,75 | ||||
| 2026-02-12 | 13F | Swiss National Bank | 194.900 | 1,35 | 5.525 | 41,81 | ||||
| 2026-02-04 | 13F | Versor Investments LP | 0 | -100,00 | 0 | |||||
| 2026-02-17 | 13F | Fmr Llc | 11.914.834 | 0,65 | 337.076 | 40,58 | ||||
| 2026-02-13 | 13F | Eschler Asset Management LLP | 0 | -100,00 | 0 | |||||
| 2026-02-11 | 13F | Allianz Asset Management GmbH | 592.947 | -13,58 | 16.844 | 21,17 | ||||
| 2026-02-13 | 13F | Oakum Bay Capital LLC | 11.800 | 334 | ||||||
| 2026-02-17 | 13F | Two Sigma Investments, Lp | 228.900 | 6.476 | ||||||
| 2026-04-24 | 13F | UMA Financial Services, Inc. | 24 | 0,00 | 1 | |||||
| 2025-11-14 | 13F | Balyasny Asset Management Llc | 0 | -100,00 | 0 | -100,00 | ||||
| 2025-11-12 | 13F | Itau Unibanco Holding S.A. | 0 | -100,00 | 0 | |||||
| 2026-02-10 | 13F | Goldman Sachs Group Inc | 269.112 | -67,77 | 7.613 | -54,92 | ||||
| 2026-02-13 | 13F | JustInvest LLC | 11.299 | 6,17 | 320 | 48,37 | ||||
| 2026-02-19 | 13F | Invesco Ltd. | 2.827.385 | 10,71 | 79.987 | 54,82 | ||||
| 2026-02-14 | 13F | Rockefeller Capital Management L.P. | 23.778 | 673 | ||||||
| 2026-04-22 | 13F | Canoe Financial LP | 0 | -100,00 | 0 | |||||
| 2026-04-24 | 13F | Keybank National Association/oh | 21.981 | -13,74 | 586 | -18,61 | ||||
| 2026-02-11 | 13F | Franklin Resources Inc | 286.651 | -37,22 | 8.110 | -12,30 | ||||
| 2026-04-22 | 13F | Spire Wealth Management | 47.174 | -2,44 | 1.258 | -8,11 | ||||
| 2026-02-17 | 13F | Orion Resource Partners LP | 94.874 | -22,16 | 2.692 | 9,04 | ||||
| 2026-02-17 | 13F | Cetera Investment Advisers | 96.986 | 2.748 | ||||||
| 2026-03-26 | 13F/A | Peak6 Llc | 0 | -100,00 | 0 | -100,00 | ||||
| 2026-02-17 | 13F | 683 Capital Management, LLC | 0 | -100,00 | 0 | |||||
| 2026-02-12 | 13F | Bank Of Montreal /can/ | Call | 64.500 | -55,52 | 1.825 | -37,87 | |||
| 2026-02-12 | 13F | Bank Of Montreal /can/ | 508.893 | 9,38 | 14.397 | 52,80 | ||||
| 2026-04-09 | 13F | Wincap Financial Llc | 76.351 | 5,20 | 2.036 | -0,83 | ||||
| 2026-04-02 | 13F | Marex Group plc | 14.000 | 170 | ||||||
| 2026-01-27 | 13F | WealthCollab, LLC | 147 | 4 | ||||||
| 2026-02-11 | 13F | LPL Financial LLC | 278.267 | 119,39 | 7.872 | 206,90 | ||||
| 2026-02-17 | 13F | Susquehanna Advisors Group, Inc. | 55.286 | 1.564 | ||||||
| 2025-11-14 | 13F | Point72 Asia (Singapore) Pte. Ltd. | 5.306 | 107 | ||||||
| 2026-02-11 | 13F | Letko, Brosseau & Associates Inc | 14.700 | -18,33 | 416 | 14,29 | ||||
| 2026-02-10 | 13F | Acadian Asset Management Llc | 9.500 | 0 | ||||||
| 2026-01-27 | 13F | Zurcher Kantonalbank (Zurich Cantonalbank) | 36.226 | 8,49 | 1.026 | 51,78 | ||||
| 2026-02-17 | 13F | Temasek Holdings (Private) Ltd | 473.660 | 0,00 | 13.400 | 39,84 | ||||
| 2026-02-06 | 13F | Pnc Financial Services Group, Inc. | 15 | 400,00 | 0 | |||||
| 2026-02-06 | 13F | Gsa Capital Partners Llp | 0 | -100,00 | 0 | |||||
| 2026-02-17 | 13F | Old West Investment Management, LLC | 29.144 | 19,70 | 824 | 67,48 | ||||
| 2026-04-22 | 13F | Pictet Asset Management Holding SA | Call | 168.811 | 4.502 | |||||
| 2026-02-06 | 13F | HighTower Advisors, LLC | 36.058 | 26,74 | 1.020 | 77,39 | ||||
| 2026-04-22 | 13F | Pictet Asset Management Holding SA | 20.622 | 13,91 | 548 | 6,84 | ||||
| 2026-04-24 | 13F | James Investment Research Inc | 19.993 | 533 | ||||||
| 2026-02-13 | 13F | Bridgewater Associates, LP | 88.760 | -39,74 | 2.514 | -15,75 | ||||
| 2026-04-22 | 13F | Gemmer Asset Management LLC | 179.577 | 4.789 | ||||||
| 2026-02-17 | 13F | D. E. Shaw & Co., Inc. | 7.548 | -84,99 | 214 | -79,08 | ||||
| 2026-01-30 | 13F | Jennison Associates Llc | 1.824.213 | -15,85 | 51.607 | 17,68 | ||||
| 2026-01-30 | 13F | Pvg Asset Management Corp | 7.944 | 225 | ||||||
| 2026-02-10 | 13F | Connor, Clark & Lunn Investment Management Ltd. | 83.669 | -57,22 | 2.367 | -40,24 | ||||
| 2026-02-09 | 13F | Kingsview Wealth Management, LLC | 12.825 | 363 | ||||||
| 2025-11-12 | 13F | Nikko Asset Management Americas, Inc. | 21.045 | 0,00 | 426 | 19,72 | ||||
| 2026-02-10 | 13F | PCJ Investment Counsel Ltd. | 93.219 | 171,46 | 2.637 | 279,42 | ||||
| 2026-02-13 | 13F | Centiva Capital, LP | 0 | -100,00 | 0 | |||||
| 2026-02-17 | 13F | Optiver Holding B.V. | 0 | -100,00 | 0 | |||||
| 2026-02-13 | 13F | SRS Capital Advisors, Inc. | 721 | 44,20 | 20 | 100,00 | ||||
| 2026-04-16 | 13F | Brookstone Capital Management | 0 | -100,00 | 0 | |||||
| 2026-02-13 | 13F | Manufacturers Life Insurance Company, The | 0 | -100,00 | 0 | |||||
| 2026-02-13 | 13F | American Century Companies Inc | 678.619 | 511,24 | 19.198 | 754,00 | ||||
| 2026-02-12 | 13F | BlackRock, Inc. | 185.478 | 115,96 | 5.247 | 202,07 | ||||
| 2026-02-17 | 13F | Integrated Advisors Network LLC | 0 | -100,00 | 0 | |||||
| 2026-02-10 | 13F | Td Asset Management Inc | 346.119 | 5,05 | 9.805 | 46,88 | ||||
| 2025-11-14 | 13F | Wolverine Trading, Llc | 25.727 | 514 | ||||||
| 2026-02-13 | 13F | 1832 Asset Management L.P. | 144.500 | 4.088 | ||||||
| 2025-11-14 | 13F | Wolverine Trading, Llc | Call | 93.200 | 167,82 | 1.861 | 219,21 | |||
| 2026-02-17 | 13F | Janus Henderson Group Plc | 0 | -100,00 | 0 | |||||
| 2025-11-14 | 13F | Wolverine Trading, Llc | Put | 18.400 | 367 | |||||
| 2026-03-03 | 13F/A | Caitong International Asset Management Co., Ltd | 1.328 | 38 | ||||||
| 2026-02-17 | 13F | Tower Research Capital LLC (TRC) | 37 | -82,71 | 1 | -75,00 | ||||
| 2025-11-14 | 13F | Decade Renewable Partners Lp | 0 | -100,00 | 0 | |||||
| 2026-01-15 | 13F | J. Safra Sarasin Holding AG | 66.336 | 80,69 | 1.879 | 152,89 | ||||
| 2026-02-13 | 13F | Citigroup Inc | 98.435 | 10,94 | 2.788 | 55,15 | ||||
| 2026-02-10 | 13F | Envestnet Asset Management Inc | 13.627 | -83,73 | 386 | -77,27 | ||||
| 2026-02-17 | 13F | Polar Asset Management Partners Inc. | 0 | -100,00 | 0 | |||||
| 2026-02-10 | 13F | Bnp Paribas Arbitrage, Sa | 153.225 | 5.403,77 | 4.335 | 7.639,29 | ||||
| 2026-02-13 | 13F | Morgan Stanley | 1.275.535 | 56,40 | 36.085 | 118,72 | ||||
| 2026-02-13 | 13F | Kestra Advisory Services, LLC | 1.972 | 56 | ||||||
| 2025-11-14 | 13F | Royal Bank Of Canada | Call | 0 | -100,00 | 0 | -100,00 | |||
| 2026-02-10 | 13F/A | Northwestern Mutual Wealth Management Co | 19 | 1 | ||||||
| 2026-02-17 | 13F | PenderFund Capital Management Ltd. | 102.590 | -14,22 | 2.826 | 19,64 | ||||
| 2026-02-17 | 13F | Bank Of America Corp /de/ | 957.866 | -19,80 | 27.098 | 12,15 | ||||
| 2026-02-06 | 13F/A | Rathbone Brothers plc | 13.333 | 0,00 | 378 | 39,63 | ||||
| 2026-04-14 | 13F | Wealthcare Advisory Partners LLC | 16.475 | 439 | ||||||
| 2026-02-17 | 13F | Van Den Berg Management I, Inc | 33.593 | -22,79 | 950 | 7,95 | ||||
| 2026-02-11 | 13F | Renaissance Group Llc | 42.621 | -47,53 | 1.206 | -26,66 | ||||
| 2026-04-09 | 13F | Veracity Capital LLC | 15.356 | 410 | ||||||
| 2026-04-13 | 13F | Artemis Investment Management LLP | 580.639 | 14,37 | 15.476 | 7,75 | ||||
| 2026-02-17 | 13F | Keebeck Alpha, LP | 0 | -100,00 | 0 | |||||
| 2026-01-29 | 13F | Vanguard Group Inc | 2.546.856 | 77,55 | 72.051 | 147,98 | ||||
| 2026-02-17 | 13F | Susquehanna International Group, Llp | Put | 118.700 | 411,64 | 3.358 | 615,99 | |||
| 2026-02-09 | 13F | Geode Capital Management, Llc | 68.394 | 17,94 | 1.979 | 67,71 | ||||
| 2026-02-17 | 13F | Susquehanna International Group, Llp | Call | 1.609.400 | 710,78 | 45.530 | 1.033,97 | |||
| 2026-02-19 | 13F | CI Private Wealth, LLC | 8.698 | 246 | ||||||
| 2026-02-13 | 13F | Barclays Plc | 7.508 | 1.243,11 | 212 | 1.827,27 | ||||
| 2026-02-17 | 13F | Citadel Advisors Llc | Call | 443.700 | 52,68 | 12.552 | 113,54 | |||
| 2026-04-20 | 13F | Moody Aldrich Partners Llc | 98.951 | 2.639 | ||||||
| 2026-02-11 | 13F | Jpmorgan Chase & Co | 294.843 | 5.127,71 | 8.341 | 6.572,80 | ||||
| 2026-02-13 | 13F | Mariner, LLC | 10.714 | 303 | ||||||
| 2026-02-17 | 13F | Citadel Advisors Llc | 127.308 | 20,35 | 3.602 | 68,35 | ||||
| 2026-02-17 | 13F | Citadel Advisors Llc | Put | 153.900 | -10,73 | 4.354 | 24,84 | |||
| 2026-02-13 | 13F | Police & Firemen's Retirement System of New Jersey | 37.514 | 7,72 | 1.063 | 50,64 | ||||
| 2026-02-13 | 13F | Colony Group, LLC | 0 | -100,00 | 0 | -100,00 | ||||
| 2026-04-16 | 13F | Toth Financial Advisory Corp | 40 | 0,00 | 1 | 0,00 | ||||
| 2026-02-03 | 13F | SBI Securities Co., Ltd. | 570 | -65,07 | 16 | -51,52 | ||||
| 2026-04-15 | 13F | FNY Investment Advisers, LLC | 0 | -100,00 | 0 | |||||
| 2026-02-13 | 13F | Aigen Investment Management, Lp | 0 | -100,00 | 0 | |||||
| 2026-02-13 | 13F | Gmt Capital Corp | 4.472.154 | -31,30 | 127.044 | -3,67 | ||||
| 2026-02-17 | 13F | Russell Investments Group, Ltd. | 16.109 | -89,13 | 456 | -84,79 | ||||
| 2026-04-16 | 13F | SG Americas Securities, LLC | 599.878 | 14.631,78 | 16 | |||||
| 2026-02-17 | 13F | Susquehanna International Group, Llp | 21.814 | -88,38 | 617 | -83,75 | ||||
| 2025-11-14 | 13F | ExodusPoint Capital Management, LP | 0 | -100,00 | 0 | |||||
| 2026-02-13 | 13F | Arrowstreet Capital, Limited Partnership | 19.445 | 550 | ||||||
| 2026-02-17 | 13F | Price T Rowe Associates Inc /md/ | 4.596.050 | -35,12 | 130 | -9,09 | ||||
| 2026-02-17 | 13F | Frontier Capital Management Co Llc | 858.095 | 4,71 | 24.276 | 46,43 | ||||
| 2026-04-13 | 13F | IFP Advisors, Inc | 202 | 10.000,00 | 5 | |||||
| 2026-02-12 | 13F | Federation des caisses Desjardins du Quebec | 54.504 | 112,57 | 1.541 | 196,92 |