Grundlæggende statistik
| Institutionelle ejere | 122 total, 122 long only, 0 short only, 0 long/short - change of 3,36% MRQ |
| Gennemsnitlig porteføljeallokering | 0.1326 % - change of -3,11% MRQ |
| Institutionelle aktier (lange) | 5.288.266 (ex 13D/G) - change of -0,07MM shares -1,40% MRQ |
| Institutionel værdi (lang) | $ 326.665 USD ($1000) |
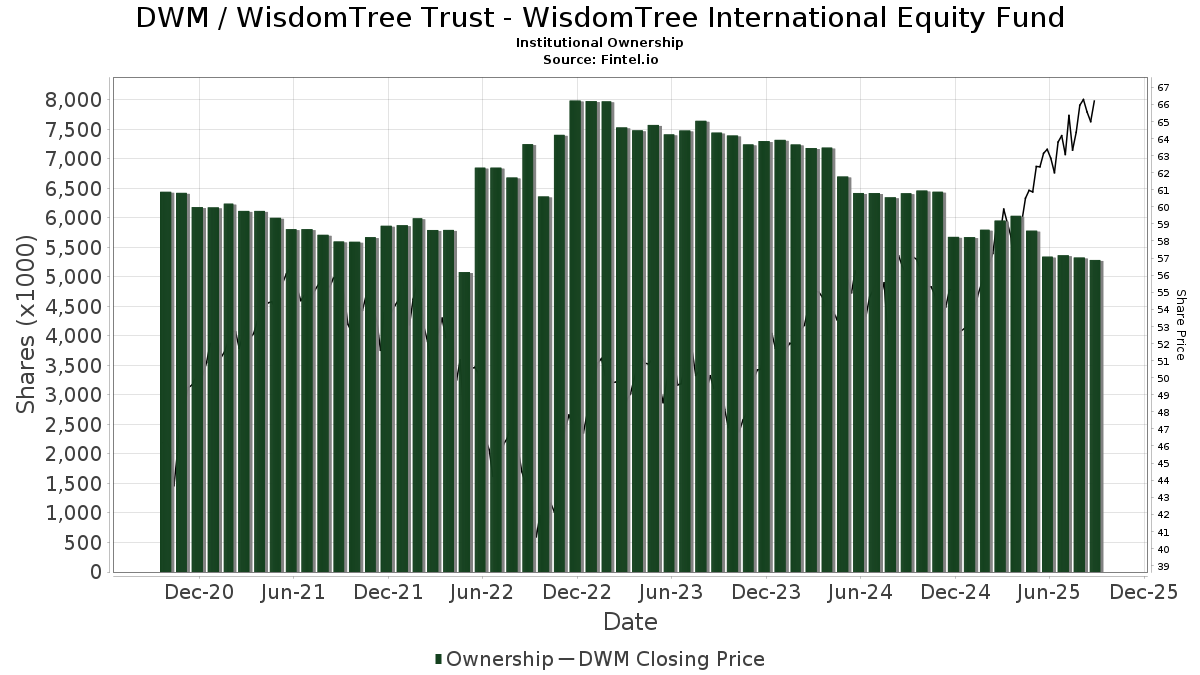
Institutionelt ejerskab og aktionærer
WisdomTree Trust - WisdomTree International Equity Fund (US:DWM) har 122 institutionelle ejere og aktionærer, der har indsendt 13D/G- eller 13F-formularer til Securities Exchange Commission (SEC). Disse institutioner har i alt 5,288,266 aktier. Største aktionærer omfatter Morgan Stanley, LPL Financial LLC, LRI Investments, LLC, Bank Of America Corp /de/, Wells Fargo & Company/mn, Wealth Enhancement Advisory Services, Llc, Valmark Advisers, Inc., UBS Group AG, Kestra Advisory Services, LLC, and Moller Financial Services .
WisdomTree Trust - WisdomTree International Equity Fund (ARCA:DWM) institutionel ejerskabsstruktur viser aktuelle positioner i virksomheden efter institutioner og fonde, samt seneste ændringer i positionsstørrelse. Større aktionærer kan omfatte individuelle investorer, investeringsforeninger, hedgefonde eller institutioner. Skema 13D angiver, at investoren besidder (eller besidder) mere end 5 % af virksomheden og har til hensigt (eller har til hensigt at) aktivt at forfølge en ændring i forretningsstrategi. Skema 13G indikerer en passiv investering på over 5%.
The share price as of September 11, 2025 is 66,90 / share. Previously, on September 12, 2024, the share price was 56,50 / share. This represents an increase of 18,41% over that period.
Fondens stemningsscore
Fund Sentiment Score (fka Ownership Accumulation Score) finder de aktier, der bliver mest købt af fonde. Det er resultatet af en sofistikeret, multi-faktor kvantitativ model, der identificerer virksomheder med de højeste niveauer af institutionel akkumulering. Scoringsmodellen bruger en kombination af den samlede stigning i oplyste ejere, ændringerne i porteføljeallokeringer i disse ejere og andre målinger. Tallet går fra 0 til 100, hvor højere tal indikerer et højere niveau af akkumulering for sine jævnaldrende, og 50 er gennemsnittet.
Opdateringsfrekvens: Dagligt
Se Ownership Explorer, som giver en liste over højest rangerende virksomheder.
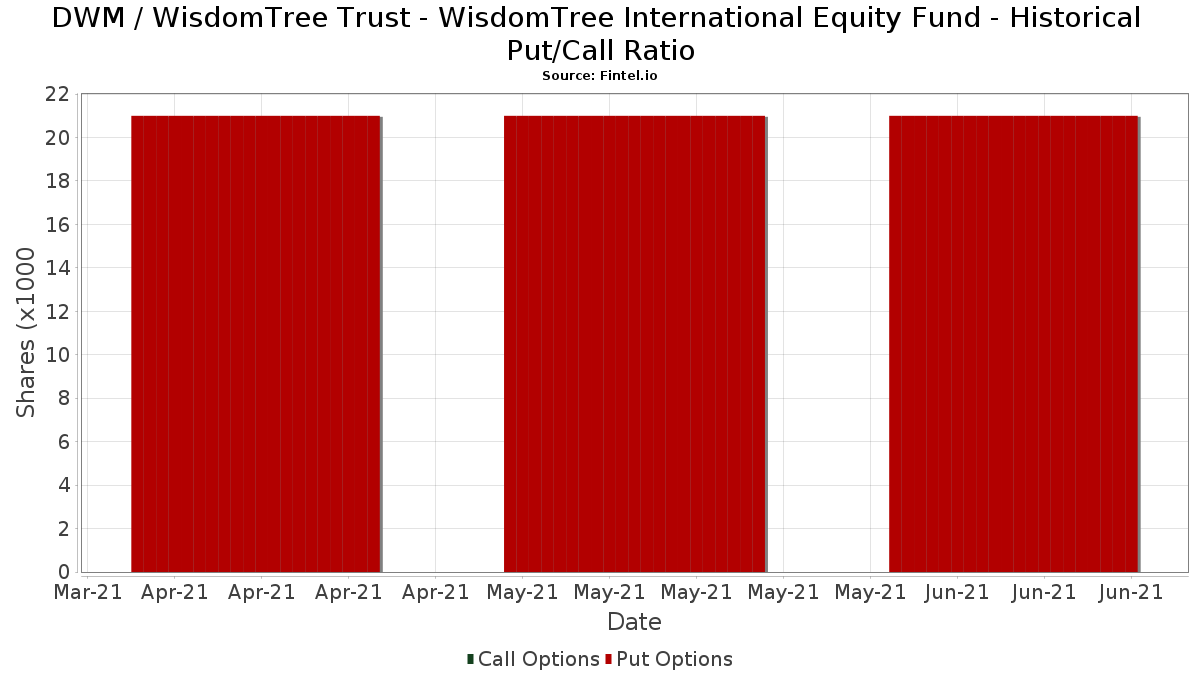
Institutionel Put/Call-forhold
Ud over at indberette standardaktie- og gældsudstedelser skal institutter med mere end 100 mill. aktiver under forvaltning også oplyse deres put- og call-optionsbeholdninger. Da salgsoptioner generelt indikerer negativ stemning, og købsoptioner indikerer positiv stemning, kan vi få en fornemmelse af den overordnede institutionelle stemning ved at plotte forholdet mellem put og kald. Diagrammet til højre viser det historiske put/call-forhold for dette instrument.
Brug af Put/Call Ratio som en indikator for investorernes stemning overvinder en af de vigtigste mangler ved at bruge totalt institutionelt ejerskab, som er, at en betydelig mængde af aktiver under forvaltning investeres passivt for at spore indekser. Passivt forvaltede fonde køber typisk ikke optioner, så indikatoren for put/call-forholdet følger mere nøje følelsen af aktivt forvaltede fonde.
13F og NPORT arkivering
Detaljer om 13F-arkivering er gratis. Detaljer om NP-ansøgninger kræver et premium-medlemskab. Grønne rækker angiver nye positioner. Røde rækker angiver lukkede positioner. Klik på linket ikon for at se den fulde transaktionshistorik.
Opgrader
for at låse premium-data op og eksportere til Excel ![]() .
.
| Fil dato | Kilde | Investor | Type | Gennemsnitlig pris (Øst) |
Aktier | Δ Aktier (%) |
Rapporteret Værdi ($1000) |
Δ Værdi (%) |
Port Alloc (%) |
|
|---|---|---|---|---|---|---|---|---|---|---|
| 2025-07-25 | 13F | McNamara Financial Services, Inc. | 4.843 | -1,38 | 308 | 7,72 | ||||
| 2025-08-14 | 13F | UBS Group AG | 170.719 | -33,49 | 10.851 | -27,31 | ||||
| 2025-08-11 | 13F | Lowe Brockenbrough & Co Inc | 1 | 0 | ||||||
| 2025-08-04 | 13F | 4wealth Advisors, Inc. | 3.444 | 219 | ||||||
| 2025-08-14 | 13F | CIBC World Markets Inc. | 48.563 | 2,85 | 3.087 | 12,38 | ||||
| 2025-07-10 | 13F | Wealth Enhancement Advisory Services, Llc | 314.751 | -8,02 | 20.073 | 0,87 | ||||
| 2025-07-24 | 13F | Robertson Stephens Wealth Management, LLC | 16.260 | -28,67 | 1.034 | -22,04 | ||||
| 2025-07-28 | 13F | Courier Capital Llc | 26.652 | 1,51 | 1.694 | 11,01 | ||||
| 2025-08-19 | 13F | National Asset Management, Inc. | 17.593 | -9,76 | 1.118 | 8,86 | ||||
| 2025-07-23 | 13F | Viewpoint Capital Management LLC | 4.100 | 0,00 | 261 | 9,24 | ||||
| 2025-08-08 | 13F | ProVise Management Group, LLC | 14.768 | -4,48 | 939 | 4,34 | ||||
| 2025-08-12 | 13F | Steward Partners Investment Advisory, Llc | 9.305 | 0,00 | 591 | 9,24 | ||||
| 2025-08-13 | 13F | Flow Traders U.s. Llc | 53.345 | 219,14 | 3 | |||||
| 2025-07-21 | 13F | Ameritas Advisory Services, LLC | 90 | 6 | ||||||
| 2025-07-17 | 13F | New Perspectives, Inc | 4.175 | 0,00 | 265 | 9,50 | ||||
| 2025-08-12 | 13F/A | Brightwater Advisory LLC | 12.032 | -6,82 | 765 | 1,87 | ||||
| 2025-08-06 | 13F | Wedbush Securities Inc | 4.015 | -5,93 | 0 | |||||
| 2025-08-14 | 13F | Susquehanna International Group, Llp | 0 | -100,00 | 0 | |||||
| 2025-07-08 | 13F | Lowe Wealth Advisors, LLC | 320 | 0,00 | 20 | 11,11 | ||||
| 2025-07-29 | 13F | Kondo Wealth Advisors, Inc. | 17.304 | -4,77 | 1.100 | 4,17 | ||||
| 2025-07-28 | 13F | Arlington Financial Advisors, LLC | 4.887 | 0,00 | 311 | 9,15 | ||||
| 2025-07-08 | 13F | Nbc Securities, Inc. | 2.811 | -12,38 | 0 | |||||
| 2025-07-17 | 13F | Janney Montgomery Scott LLC | 30.354 | 0,85 | 2 | 0,00 | ||||
| 2025-08-08 | 13F | Financial Gravity Companies, Inc. | 246 | 0,00 | 16 | 25,00 | ||||
| 2025-07-22 | 13F | Merit Financial Group, LLC | 46.918 | 38,23 | 2.982 | 51,14 | ||||
| 2025-07-28 | 13F | Harbour Investments, Inc. | 0 | -100,00 | 0 | |||||
| 2025-08-14 | 13F | Colony Group, LLC | 4.874 | 0,00 | 310 | 9,19 | ||||
| 2025-08-08 | 13F | Creative Planning | 27.284 | 0,00 | 1.734 | 9,33 | ||||
| 2025-08-12 | 13F | MAI Capital Management | 1.571 | 0,00 | 100 | 8,79 | ||||
| 2025-08-11 | 13F | Pinnacle Financial Group, LLC / IL | 5.965 | 0,15 | 379 | 9,54 | ||||
| 2025-08-08 | 13F | Thrive Capital Management, LLC | 17.313 | 1.100 | ||||||
| 2025-08-08 | 13F | Cetera Investment Advisers | 63.652 | 30,32 | 4.046 | 42,43 | ||||
| 2025-07-22 | 13F | Plimoth Trust Co Llc | 23.622 | -3,04 | 1.501 | 6,00 | ||||
| 2025-04-29 | 13F | Bank of New York Mellon Corp | 0 | -100,00 | 0 | |||||
| 2025-07-25 | 13F | LRI Investments, LLC | 386.546 | -0,77 | 24.569 | 8,45 | ||||
| 2025-08-15 | 13F | Morgan Stanley | 1.025.785 | -1,90 | 65.199 | 7,22 | ||||
| 2025-07-17 | 13F | Independence Bank of Kentucky | 2.415 | 0,00 | 153 | 9,29 | ||||
| 2025-08-18 | 13F | Geneos Wealth Management Inc. | 26.598 | 0,01 | 1.691 | 9,31 | ||||
| 2025-08-11 | 13F | Pinnacle Wealth Planning Services, Inc. | 22.441 | 1,90 | 1.426 | 11,41 | ||||
| 2025-08-11 | 13F | Culbertson A N & Co Inc | 3.695 | 0,00 | 235 | 9,35 | ||||
| 2025-08-12 | 13F | Shakespeare Wealth Management, Inc. | 29.570 | -29,61 | 1.879 | -23,05 | ||||
| 2025-07-28 | 13F | Essex LLC | 4.300 | 0,00 | 273 | 9,20 | ||||
| 2025-07-24 | 13F | Blair William & Co/il | 2.063 | 1,38 | 131 | 11,02 | ||||
| 2025-08-06 | 13F | Commonwealth Equity Services, Llc | 14.916 | -1,60 | 1 | |||||
| 2025-07-21 | 13F | Cape Ann Savings Bank | 6.794 | 0,00 | 432 | 9,11 | ||||
| 2025-07-29 | 13F | Stratos Wealth Advisors, LLC | 21.312 | 4,78 | 1.355 | 14,55 | ||||
| 2025-08-01 | 13F | Oarsman Capital, Inc. | 13.157 | -12,49 | 836 | -4,35 | ||||
| 2025-08-14 | 13F | GWM Advisors LLC | 66 | 0,00 | 4 | 33,33 | ||||
| 2025-07-22 | 13F | DAVENPORT & Co LLC | 14.414 | -5,36 | 916 | 3,50 | ||||
| 2025-07-25 | 13F | Cwm, Llc | 4.406 | 0,80 | 0 | |||||
| 2025-07-10 | 13F | Kmg Fiduciary Partners, Llc | 12.567 | 10,45 | 799 | 20,73 | ||||
| 2025-08-29 | NP | DNL - WisdomTree Global ex-U.S. Quality Dividend Growth Fund N/A | 652 | -76,55 | 41 | -74,53 | ||||
| 2025-08-11 | 13F | CBIZ Investment Advisory Services, LLC | 0 | -100,00 | 0 | |||||
| 2025-08-14 | 13F | Harwood Advisory Group, LLC | 0 | -100,00 | 0 | -100,00 | ||||
| 2025-08-11 | 13F | WPG Advisers, LLC | 1.101 | -0,99 | 70 | 7,81 | ||||
| 2025-07-21 | 13F | Creative Capital Management Investments LLC | 539 | 0,00 | 34 | 9,68 | ||||
| 2025-08-15 | 13F | Kestra Advisory Services, LLC | 117.768 | 12,08 | 7.485 | 22,50 | ||||
| 2025-07-16 | 13F | Falcon Wealth Planning | 11.642 | 1,00 | 740 | 10,30 | ||||
| 2025-07-09 | 13F | Inspirion Wealth Advisors, Llc | 6.166 | 1,73 | 392 | 11,08 | ||||
| 2025-07-28 | 13F | Frazier Financial Advisors, LLC | 16.383 | 0,22 | 1.041 | 9,58 | ||||
| 2025-08-12 | 13F | Global Retirement Partners, LLC | 66 | 0,00 | 4 | 33,33 | ||||
| 2025-07-22 | 13F | Valley National Advisers Inc | 4.014 | 0,00 | 0 | |||||
| 2025-07-30 | 13F | Bogart Wealth, LLC | 133 | 0,00 | 8 | 14,29 | ||||
| 2025-05-15 | 13F | Citadel Advisors Llc | 0 | -100,00 | 0 | |||||
| 2025-08-11 | 13F | Principal Securities, Inc. | 115 | 0,00 | 7 | 16,67 | ||||
| 2025-08-07 | 13F | Allworth Financial LP | 793 | 50 | ||||||
| 2025-08-14 | 13F | Jane Street Group, Llc | 0 | -100,00 | 0 | |||||
| 2025-08-08 | 13F | Kingsview Wealth Management, LLC | 9.228 | -0,18 | 587 | 9,12 | ||||
| 2025-08-14 | 13F | Royal Bank Of Canada | 19.672 | -0,16 | 1.250 | 9,08 | ||||
| 2025-04-24 | 13F | Philip James Wealth Mangement, LLC | 0 | -100,00 | 0 | |||||
| 2025-07-24 | 13F | Jfs Wealth Advisors, Llc | 74.136 | -1,66 | 4.712 | 7,48 | ||||
| 2025-08-12 | 13F | Pathstone Holdings, LLC | 3.225 | 205 | ||||||
| 2025-08-11 | 13F | Howard Wealth Management, Llc | 5.615 | 0,00 | 357 | 9,20 | ||||
| 2025-07-10 | 13F | Moller Financial Services | 106.914 | -5,17 | 6.795 | 3,65 | ||||
| 2025-08-14 | 13F | Fmr Llc | 2.323 | -4,09 | 148 | 5,00 | ||||
| 2025-08-12 | 13F | Allen Capital Group, LLC | 6.868 | 0,00 | 437 | 9,27 | ||||
| 2025-04-30 | 13F | Sofos Investments, Inc. | 246 | -5,38 | 14 | 7,69 | ||||
| 2025-08-12 | 13F | Proequities, Inc. | 0 | 0 | ||||||
| 2025-08-05 | 13F | NewSquare Capital LLC | 66.324 | 4,53 | 4.216 | 14,26 | ||||
| 2025-08-15 | 13F | Tower Research Capital LLC (TRC) | 1 | 0,00 | 0 | |||||
| 2025-07-17 | 13F | Beacon Capital Management, LLC | 395 | 1,80 | 25 | 13,64 | ||||
| 2025-07-23 | 13F | Litman Gregory Asset Management LLC | 7.000 | 0,00 | 445 | 9,09 | ||||
| 2025-08-08 | 13F | Intrua Financial, LLC | 11.891 | 0,00 | 756 | 9,26 | ||||
| 2025-07-09 | 13F | Beacon Financial Group | 9.732 | -10,34 | 619 | -2,06 | ||||
| 2025-08-14 | 13F | Ameriprise Financial Inc | 3.742 | 238 | ||||||
| 2025-08-04 | 13F | Spire Wealth Management | 0 | -100,00 | 0 | |||||
| 2025-08-11 | 13F | Rothschild Investment Llc | 235 | 0,00 | 15 | 7,69 | ||||
| 2025-08-13 | 13F | Financial Freedom, LLC | 378 | 0,00 | 24 | 14,29 | ||||
| 2025-08-06 | 13F | AE Wealth Management LLC | 428 | 140,45 | 27 | 170,00 | ||||
| 2025-08-14 | 13F | Sei Investments Co | 43.286 | -3,53 | 2.751 | 5,44 | ||||
| 2025-08-12 | 13F | Jpmorgan Chase & Co | 14.142 | -5,80 | 899 | 2,86 | ||||
| 2025-08-14 | 13F | Bank Of America Corp /de/ | 367.152 | 0,51 | 23.336 | 9,86 | ||||
| 2025-08-11 | 13F | Aptus Capital Advisors, LLC | 1.650 | 0,00 | 105 | 9,47 | ||||
| 2025-07-29 | 13F | JTC Employer Solutions Trusteee Ltd | 4.226 | 0,00 | 0 | |||||
| 2025-08-14 | 13F | Ancora Advisors, LLC | 1.000 | 0,00 | 64 | 8,62 | ||||
| 2025-07-23 | 13F | Valmark Advisers, Inc. | 301.119 | -0,17 | 19.139 | 9,10 | ||||
| 2025-08-01 | 13F | Envestnet Asset Management Inc | 44.779 | -8,21 | 2.846 | 0,32 | ||||
| 2025-08-11 | 13F | HighTower Advisors, LLC | 12.139 | 3,14 | 772 | 12,72 | ||||
| 2025-07-16 | 13F | Signaturefd, Llc | 0 | -100,00 | 0 | |||||
| 2025-07-24 | 13F | IFP Advisors, Inc | 508 | 32 | ||||||
| 2025-08-13 | 13F | Twin Peaks Wealth Advisors, LLC | 2.180 | 143 | ||||||
| 2025-07-31 | 13F | Cambridge Investment Research Advisors, Inc. | 18.746 | 5,49 | 1 | 0,00 | ||||
| 2025-08-13 | 13F | Jones Financial Companies Lllp | 6.594 | 0,00 | 418 | 8,57 | ||||
| 2025-08-04 | 13F | HBK Sorce Advisory LLC | 54.765 | -6,94 | 3.481 | 1,69 | ||||
| 2025-08-14 | 13F | Stifel Financial Corp | 15.250 | -2,50 | 969 | 6,60 | ||||
| 2025-08-13 | 13F | EverSource Wealth Advisors, LLC | 325 | 0,00 | 21 | 11,11 | ||||
| 2025-08-06 | 13F | Modera Wealth Management, LLC | 11.879 | 0,00 | 755 | 9,42 | ||||
| 2025-08-12 | 13F | OneAscent Financial Services LLC | 7.531 | 1,21 | 0 | |||||
| 2025-08-12 | 13F | O'shaughnessy Asset Management, Llc | 822 | 0,00 | 52 | 10,64 | ||||
| 2025-08-05 | 13F | Mission Wealth Management, Lp | 58.867 | -3,78 | 3.742 | 5,17 | ||||
| 2025-08-14 | 13F | Raymond James Financial Inc | 84.593 | 1,28 | 5.377 | 10,69 | ||||
| 2025-07-11 | 13F | Trust Co Of Virginia /va | 5.783 | 0,00 | 368 | 9,23 | ||||
| 2025-08-11 | 13F | Tidemark, LLC | 783 | 0,00 | 50 | 8,89 | ||||
| 2025-08-06 | 13F | Regimen Wealth, Llc | 4.470 | 1,75 | 284 | 11,37 | ||||
| 2025-07-10 | 13F | Envision Financial LLC | 53.044 | 1,09 | 3.371 | 10,49 | ||||
| 2025-07-22 | 13F/A | Duncan Williams Asset Management, LLC | 3.274 | 208 | ||||||
| 2025-09-04 | 13F/A | Advisor Group Holdings, Inc. | 32.187 | -1,28 | 2.046 | 7,91 | ||||
| 2025-07-16 | 13F | Octavia Wealth Advisors, LLC | 14.994 | -8,02 | 953 | 0,53 | ||||
| 2025-08-05 | 13F | Huntington National Bank | 168 | 10,60 | ||||||
| 2025-08-14 | 13F | Wells Fargo & Company/mn | 326.088 | 1,11 | 20.726 | 10,51 | ||||
| 2025-08-14 | 13F | Wiley Bros.-aintree Capital, Llc | 24.342 | 0,05 | 1.547 | 8,94 | ||||
| 2025-08-12 | 13F | LPL Financial LLC | 526.732 | 4,16 | 33.479 | 13,85 | ||||
| 2025-08-13 | 13F | Northwestern Mutual Wealth Management Co | 2.041 | -32,82 | 130 | -26,70 | ||||
| 2025-08-14 | 13F | Comerica Bank | 22.381 | -3,15 | 1.423 | 5,88 | ||||
| 2025-08-07 | 13F | Kestra Private Wealth Services, Llc | 4.250 | 270 | ||||||
| 2025-08-05 | 13F | Westside Investment Management, Inc. | 816 | 0,00 | 52 | 8,51 | ||||
| 2025-08-13 | 13F | Tobias Financial Advisors, Inc. | 57.475 | -5,92 | 3.653 | 2,84 | ||||
| 2025-08-05 | 13F | Key FInancial Inc | 53.606 | -1,28 | 3.407 | 7,92 | ||||
| 2025-08-12 | 13F | Howe & Rusling Inc | 0 | -100,00 | 0 | |||||
| 2025-08-11 | 13F | Rockbridge Investment Management, LCC | 5.213 | -1,70 | 331 | 7,47 | ||||
| 2025-08-08 | 13F | Pnc Financial Services Group, Inc. | 6.450 | 0,00 | 410 | 9,07 | ||||
| 2025-07-29 | 13F | Private Trust Co Na | 383 | 0,00 | 24 | 9,09 | ||||
| 2025-08-12 | 13F | New World Advisors LLC | 5.654 | 14,20 | 359 | 25,09 | ||||
| 2025-03-28 | 13F/A | Berkeley, Inc | 0 | -100,00 | 0 | -100,00 | ||||
| 2025-05-14 | 13F | Legacy Financial Advisors, Inc. | 0 | -100,00 | 0 | |||||
| 2025-07-28 | 13F | Kiker Wealth Management, LLC | 63 | 0,00 | 4 | 33,33 | ||||
| 2025-04-25 | 13F | Smallwood Wealth Investment Management, LLC | 56.137 | 4,63 | 3.265 | 15,46 |