Grundlæggende statistik
| Institutionelle ejere | 95 total, 95 long only, 0 short only, 0 long/short - change of -3,06% MRQ |
| Gennemsnitlig porteføljeallokering | 0.1319 % - change of -24,06% MRQ |
| Institutionelle aktier (lange) | 8.702.234 (ex 13D/G) - change of -0,25MM shares -2,85% MRQ |
| Institutionel værdi (lang) | $ 347.739 USD ($1000) |
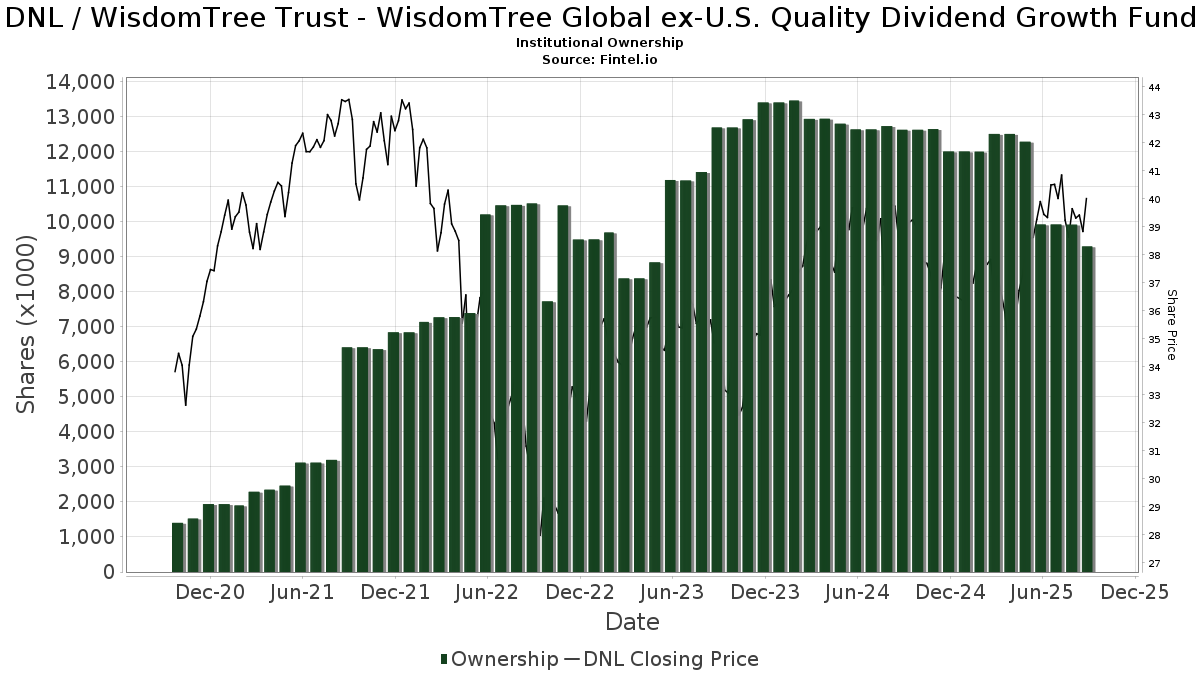
Institutionelt ejerskab og aktionærer
WisdomTree Trust - WisdomTree Global ex-U.S. Quality Growth Fund (US:DNL) har 95 institutionelle ejere og aktionærer, der har indsendt 13D/G- eller 13F-formularer til Securities Exchange Commission (SEC). Disse institutioner har i alt 8,702,234 aktier. Største aktionærer omfatter Morgan Stanley, UBS Group AG, Ameriprise Financial Inc, LPL Financial LLC, Private Advisor Group, LLC, Royal Bank Of Canada, Key FInancial Inc, Bank Of America Corp /de/, Commonwealth Equity Services, Llc, and Wells Fargo & Company/mn .
WisdomTree Trust - WisdomTree Global ex-U.S. Quality Growth Fund (ARCA:DNL) institutionel ejerskabsstruktur viser aktuelle positioner i virksomheden efter institutioner og fonde, samt seneste ændringer i positionsstørrelse. Større aktionærer kan omfatte individuelle investorer, investeringsforeninger, hedgefonde eller institutioner. Skema 13D angiver, at investoren besidder (eller besidder) mere end 5 % af virksomheden og har til hensigt (eller har til hensigt at) aktivt at forfølge en ændring i forretningsstrategi. Skema 13G indikerer en passiv investering på over 5%.
The share price as of April 17, 2026 is 44,50 / share. Previously, on April 21, 2025, the share price was 34,85 / share. This represents an increase of 27,68% over that period.
Fondens stemningsscore
Fund Sentiment Score (fka Ownership Accumulation Score) finder de aktier, der bliver mest købt af fonde. Det er resultatet af en sofistikeret, multi-faktor kvantitativ model, der identificerer virksomheder med de højeste niveauer af institutionel akkumulering. Scoringsmodellen bruger en kombination af den samlede stigning i oplyste ejere, ændringerne i porteføljeallokeringer i disse ejere og andre målinger. Tallet går fra 0 til 100, hvor højere tal indikerer et højere niveau af akkumulering for sine jævnaldrende, og 50 er gennemsnittet.
Opdateringsfrekvens: Dagligt
Se Ownership Explorer, som giver en liste over højest rangerende virksomheder.
AI+ Ask Fintel’s AI assistant about WisdomTree Trust - WisdomTree Global ex-U.S. Quality Growth Fund.
Select a question to share a public post with an AI-crafted answer.
Thinking of good questions…
Institutionel Put/Call-forhold
Ud over at indberette standardaktie- og gældsudstedelser skal institutter med mere end 100 mill. aktiver under forvaltning også oplyse deres put- og call-optionsbeholdninger. Da salgsoptioner generelt indikerer negativ stemning, og købsoptioner indikerer positiv stemning, kan vi få en fornemmelse af den overordnede institutionelle stemning ved at plotte forholdet mellem put og kald. Diagrammet til højre viser det historiske put/call-forhold for dette instrument.
Brug af Put/Call Ratio som en indikator for investorernes stemning overvinder en af de vigtigste mangler ved at bruge totalt institutionelt ejerskab, som er, at en betydelig mængde af aktiver under forvaltning investeres passivt for at spore indekser. Passivt forvaltede fonde køber typisk ikke optioner, så indikatoren for put/call-forholdet følger mere nøje følelsen af aktivt forvaltede fonde.
13F og NPORT arkivering
Detaljer om 13F-arkivering er gratis. Detaljer om NP-ansøgninger kræver et premium-medlemskab. Grønne rækker angiver nye positioner. Røde rækker angiver lukkede positioner. Klik på linket ikon for at se den fulde transaktionshistorik.
Opgrader
for at låse premium-data op og eksportere til Excel ![]() .
.
| Fil dato | Kilde | Investor | Type | Gennemsnitlig pris (Øst) |
Aktier | Δ Aktier (%) |
Rapporteret Værdi ($1000) |
Δ Værdi (%) |
Port Alloc (%) |
|
|---|---|---|---|---|---|---|---|---|---|---|
| 2026-02-17 | 13F | Equitable Holdings, Inc. | 0 | -100,00 | 0 | |||||
| 2026-02-17 | 13F | Fmr Llc | 8.222 | 9,82 | 339 | 11,55 | ||||
| 2026-02-17 | 13F | Creative Planning | 12.133 | -3,61 | 500 | -1,77 | ||||
| 2026-04-07 | 13F | CoreCap Advisors, LLC | 304 | 0,00 | 12 | 0,00 | ||||
| 2026-01-29 | 13F | Howard Wealth Management, Llc | 13.874 | -28,35 | 572 | -27,17 | ||||
| 2026-02-13 | 13F | Morgan Stanley | 1.236.952 | 49,60 | 50.987 | 52,30 | ||||
| 2026-02-11 | 13F | J.w. Cole Advisors, Inc. | 5.276 | 217 | ||||||
| 2026-01-21 | 13F | Capital Investment Advisory Services, LLC | 21 | 0,00 | 1 | |||||
| 2026-02-10 | 13F | Argent Trust Co | 16.560 | 0,00 | 683 | 1,79 | ||||
| 2026-01-26 | 13F | Cwm, Llc | 48.270 | -1,20 | 2 | 0,00 | ||||
| 2026-02-17 | 13F | Advisory Services Network, LLC | 0 | -100,00 | 0 | -100,00 | ||||
| 2026-01-28 | 13F | Geneos Wealth Management Inc. | 6.299 | 1,94 | 260 | 3,60 | ||||
| 2026-02-11 | 13F | LPL Financial LLC | 528.207 | -17,02 | 21.773 | -15,53 | ||||
| 2026-02-13 | 13F | Integrity Financial Corp /WA | 14.614 | -20,26 | 602 | -18,87 | ||||
| 2026-02-17 | 13F | Susquehanna International Group, Llp | 42.191 | 53,33 | 1.739 | 56,10 | ||||
| 2026-02-11 | 13F | O'shaughnessy Asset Management, Llc | 426 | 0,00 | 18 | 0,00 | ||||
| 2026-02-11 | 13F | Jpmorgan Chase & Co | 192.874 | 2,64 | 7.950 | 4,50 | ||||
| 2026-02-06 | 13F | HighTower Advisors, LLC | 46.331 | -2,05 | 1.910 | -0,31 | ||||
| 2026-01-20 | 13F | Raab & Moskowitz Asset Management LLC | 10.650 | 0,00 | 439 | 1,62 | ||||
| 2026-02-09 | 13F | Integrity Alliance, Llc. | 10.364 | 427 | ||||||
| 2025-11-10 | 13F | Lion Street Advisors, LLC | 12.642 | 20,68 | 532 | 26,13 | ||||
| 2026-02-03 | 13F | NewEdge Wealth, LLC | 49.957 | -21,16 | 2.059 | -20,22 | ||||
| 2026-02-17 | 13F | National Asset Management, Inc. | 11.256 | 18,20 | 464 | 20,26 | ||||
| 2026-01-20 | 13F | Stratos Wealth Partners, LTD. | 31.150 | 7,18 | 1.284 | 9,18 | ||||
| 2026-04-17 | 13F | United Advisor Group, LLC | 11.432 | 0,42 | 462 | -1,71 | ||||
| 2026-02-17 | 13F | Royal Bank Of Canada | 468.511 | -5,39 | 19.312 | -3,69 | ||||
| 2026-04-16 | 13F | First Community Trust Na | 1.500 | 0,00 | 61 | -1,64 | ||||
| 2026-02-03 | 13F | Harel Insurance Investments & Financial Services Ltd. | 290 | 0,00 | 0 | |||||
| 2026-02-03 | 13F | Manske Wealth Management | 14.761 | -0,67 | 608 | 1,16 | ||||
| 2026-04-14 | 13F | Drive Wealth Management, Llc | 20.148 | 13,97 | 813 | 11,68 | ||||
| 2026-02-17 | 13F | Private Advisor Group, LLC | 495.780 | -0,05 | 20.436 | 1,75 | ||||
| 2026-02-17 | 13F | Raymond James Financial Inc | 65.948 | -8,71 | 2.718 | -7,08 | ||||
| 2026-04-13 | 13F | Creative Financial Designs Inc /adv | 112 | 0,00 | 5 | 0,00 | ||||
| 2026-02-12 | 13F | Colonial Trust Co / SC | 4.900 | 0,00 | 202 | 2,54 | ||||
| 2026-01-13 | 13F | Cherrydale Wealth Management, Llc | 10.376 | 0,57 | 428 | 2,40 | ||||
| 2026-01-29 | 13F | UBS Group AG | 770.788 | 35,46 | 31.772 | 37,90 | ||||
| 2026-02-18 | 13F | GWM Advisors LLC | 607 | 0,66 | 25 | 4,17 | ||||
| 2026-02-09 | 13F | Harbour Investments, Inc. | 59 | 0,00 | 2 | 0,00 | ||||
| 2026-04-07 | 13F | Signaturefd, Llc | 215 | 0,00 | 9 | 0,00 | ||||
| 2026-04-06 | 13F | GAMMA Investing LLC | 125 | 0,00 | 5 | 0,00 | ||||
| 2026-02-11 | 13F | OneAscent Financial Services LLC | 0 | -100,00 | 0 | -100,00 | ||||
| 2026-02-12 | 13F | Principal Securities, Inc. | 6.248 | 5,54 | 258 | 7,53 | ||||
| 2026-02-17 | 13F | Bank Of America Corp /de/ | 443.189 | -27,87 | 18.268 | -26,57 | ||||
| 2026-02-17 | 13F | Jones Financial Companies Lllp | 5.625 | 5,18 | 232 | 8,45 | ||||
| 2026-01-29 | 13F | Comerica Bank | 5.286 | -0,23 | 218 | 1,40 | ||||
| 2026-02-09 | 13F | Collaborative Wealth Managment Inc. | 58.107 | 11,43 | 2.395 | 13,45 | ||||
| 2026-02-13 | 13F | Kestra Advisory Services, LLC | 0 | -100,00 | 0 | |||||
| 2026-02-13 | 13F | Integrated Wealth Concepts LLC | 0 | -100,00 | 0 | |||||
| 2026-02-17 | 13F | Wealth Watch Advisors, INC | 71.071 | -1,39 | 2.930 | 0,38 | ||||
| 2026-02-13 | 13F | Wells Fargo & Company/mn | 340.616 | -25,89 | 14.040 | -24,56 | ||||
| 2026-02-12 | 13F | Commonwealth Equity Services, Llc | 406.331 | -7,89 | 16.749 | 98.417,65 | ||||
| 2026-01-09 | 13F | Inspirion Wealth Advisors, Llc | 0 | -100,00 | 0 | |||||
| 2026-02-12 | 13F | Front Row Advisors LLC | 440 | 0,00 | 18 | 5,88 | ||||
| 2026-02-05 | 13F | Cambridge Investment Research Advisors, Inc. | 55.897 | -0,11 | 2 | 0,00 | ||||
| 2026-02-05 | 13F | WealthPlan Investment Management, LLC | 23.689 | -35,85 | 976 | -34,72 | ||||
| 2026-02-05 | 13F | Allworth Financial LP | 3.630 | -8,91 | 150 | -7,45 | ||||
| 2026-02-12 | 13F | Steward Partners Investment Advisory, Llc | 3.475 | 0,00 | 143 | 2,14 | ||||
| 2026-02-18 | 13F | Onyx Bridge Wealth Group LLC | 13.212 | -26,14 | 545 | -24,86 | ||||
| 2026-02-17 | 13F | Ameriprise Financial Inc | 730.008 | -13,77 | 30.091 | -12,17 | ||||
| 2026-01-26 | 13F | Private Trust Co Na | 2.905 | 0,00 | 120 | 1,71 | ||||
| 2026-02-06 | 13F | Larson Financial Group LLC | 730 | 30 | ||||||
| 2026-04-06 | 13F | CX Institutional | 669 | -50,66 | 0 | |||||
| 2026-01-29 | 13F | RMR Wealth Builders | 0 | -100,00 | 0 | |||||
| 2026-02-17 | 13F | VestGen Advisors, LLC | 5.858 | 241 | ||||||
| 2026-02-10 | 13F/A | Northwestern Mutual Wealth Management Co | 17.435 | 0,59 | 719 | 2,43 | ||||
| 2025-11-04 | 13F | Financial Strategies Group, Inc. | 0 | -100,00 | 0 | |||||
| 2026-02-14 | 13F | Rockefeller Capital Management L.P. | 238.035 | 435,93 | 9.828 | 446,61 | ||||
| 2026-02-12 | 13F | Jane Street Group, Llc | 103.138 | -16,99 | 4.251 | -15,50 | ||||
| 2026-02-17 | 13F | Advisor Group Holdings, Inc. | 10.328 | -42,27 | 426 | -39,89 | ||||
| 2026-02-17 | 13F | Captrust Financial Advisors | 220.339 | 2,56 | 9.082 | 4,41 | ||||
| 2026-04-14 | 13F | Well Done, LLC | 45.089 | 0,10 | 1.820 | -1,94 | ||||
| 2026-01-21 | 13F | BIP Wealth, LLC | 254.372 | 4,55 | 10.485 | 6,44 | ||||
| 2026-02-13 | 13F | Baird Financial Group, Inc. | 71.056 | -1,73 | 2.929 | 0,03 | ||||
| 2026-02-26 | 13F | TD Capital Management LLC | 8.857 | 7,46 | 365 | 9,61 | ||||
| 2026-04-13 | 13F | 5T Wealth, LLC | 24.722 | 2,53 | 998 | 0,50 | ||||
| 2026-01-26 | 13F | AE Wealth Management LLC | 788 | 0,00 | 32 | 3,23 | ||||
| 2025-11-14 | 13F | Ruggaard & Associates LLC | 0 | -100,00 | 0 | -100,00 | ||||
| 2026-04-17 | 13F | Tectonic Advisors Llc | 0 | -100,00 | 0 | |||||
| 2026-02-17 | 13F | Cetera Investment Advisers | 81.016 | -27,85 | 3.339 | -26,55 | ||||
| 2025-11-14 | 13F | Northern Trust Corp | 0 | -100,00 | 0 | |||||
| 2026-02-19 | 13F | Michels Family Financial, LLC | 0 | -100,00 | 0 | |||||
| 2026-02-18 | 13F | Garton & Associates Financial Advisors LLC | 305 | 13 | ||||||
| 2026-02-05 | 13F | Tucker Asset Management Llc | 1.395 | 58 | ||||||
| 2026-01-30 | 13F | Us Bancorp \de\ | 12.020 | 5,25 | 495 | 7,14 | ||||
| 2026-02-03 | 13F | International Assets Investment Management, Llc | 300 | 12 | ||||||
| 2026-02-13 | 13F | Element Wealth, LLC | 27.768 | 9,27 | 1.145 | 11,28 | ||||
| 2026-02-17 | 13F | Aqr Capital Management Llc | 10.080 | 0,00 | 415 | 1,72 | ||||
| 2026-02-06 | 13F | Global Retirement Partners, LLC | 579 | 24 | ||||||
| 2026-01-09 | 13F | Breakwater Capital Group | 45.760 | -0,86 | 1.886 | 0,96 | ||||
| 2026-01-26 | 13F | Whittier Trust Co Of Nevada Inc | 1.149 | 0,00 | 49 | 4,26 | ||||
| 2026-02-05 | 13F | AlphaCore Capital LLC | 720 | 0,00 | 30 | 0,00 | ||||
| 2026-02-13 | 13F | Stifel Financial Corp | 17.213 | 6,10 | 709 | 8,08 | ||||
| 2026-02-10 | 13F | ShoreHaven Wealth Partners, LLC | 166.377 | 2,39 | 6.858 | 4,24 | ||||
| 2025-11-07 | 13F | Pnc Financial Services Group, Inc. | 0 | -100,00 | 0 | |||||
| 2026-02-10 | 13F | Envestnet Asset Management Inc | 217.693 | 18,24 | 8.973 | 20,38 | ||||
| 2025-11-05 | 13F | Plante Moran Financial Advisors, LLC | 0 | -100,00 | 0 | |||||
| 2026-04-15 | 13F | Sowa Financial Group, Inc. | 17.608 | 4,15 | 1 | |||||
| 2026-02-09 | 13F | Key FInancial Inc | 452.211 | -0,12 | 18.640 | 0,35 | ||||
| 2026-02-13 | 13F | Flow Traders U.s. Llc | 132.865 | -29,07 | 5 | -28,57 | ||||
| 2026-02-13 | 13F | Level Four Advisory Services, Llc | 6.229 | 5,13 | 257 | 7,11 | ||||
| 2026-02-04 | 13F | Ameritas Advisory Services, LLC | 0 | -100,00 | 0 | |||||
| 2026-04-13 | 13F | IFP Advisors, Inc | 0 | -100,00 | 0 | |||||
| 2026-02-17 | 13F | SageView Advisory Group, LLC | 5.985 | 0,00 | 247 | 1,65 | ||||
| 2026-02-10 | 13F | Verus Capital Partners, Llc | 5.315 | 1,68 | 219 | 3,79 | ||||
| 2026-02-23 | 13F | Virtu Financial LLC | 7.617 | -85,88 | 0 | -100,00 | ||||
| 2026-02-02 | 13F | Cerro Pacific Wealth Advisors LLC | 0 | -100,00 | 0 | |||||
| 2026-02-13 | 13F | SRS Capital Advisors, Inc. | 17.235 | 710 | ||||||
| 2026-02-17 | 13F | Citadel Advisors Llc | 31.572 | 1.301 | ||||||
| 2026-04-17 | 13F | AdvisorNet Financial, Inc | 1.590 | 0,00 | 64 | -1,54 | ||||
| 2026-02-13 | 13F | Ieq Capital, Llc | 76.836 | 0,00 | 3.167 | 1,80 | ||||
| 2026-04-16 | 13F | Sentinel Pension Advisors Inc | 29.378 | 9,64 | 1.186 | 7,34 | ||||
| 2025-10-21 | 13F | Optimum Investment Advisors | 148 | 0,00 | 6 | 0,00 |