Grundlæggende statistik
| Institutionelle ejere | 197 total, 197 long only, 0 short only, 0 long/short - change of 2,59% MRQ |
| Gennemsnitlig porteføljeallokering | 0.1575 % - change of 1,34% MRQ |
| Institutionelle aktier (lange) | 4.803.841 (ex 13D/G) - change of -0,18MM shares -3,60% MRQ |
| Institutionel værdi (lang) | $ 348.805 USD ($1000) |
Institutionelt ejerskab og aktionærer
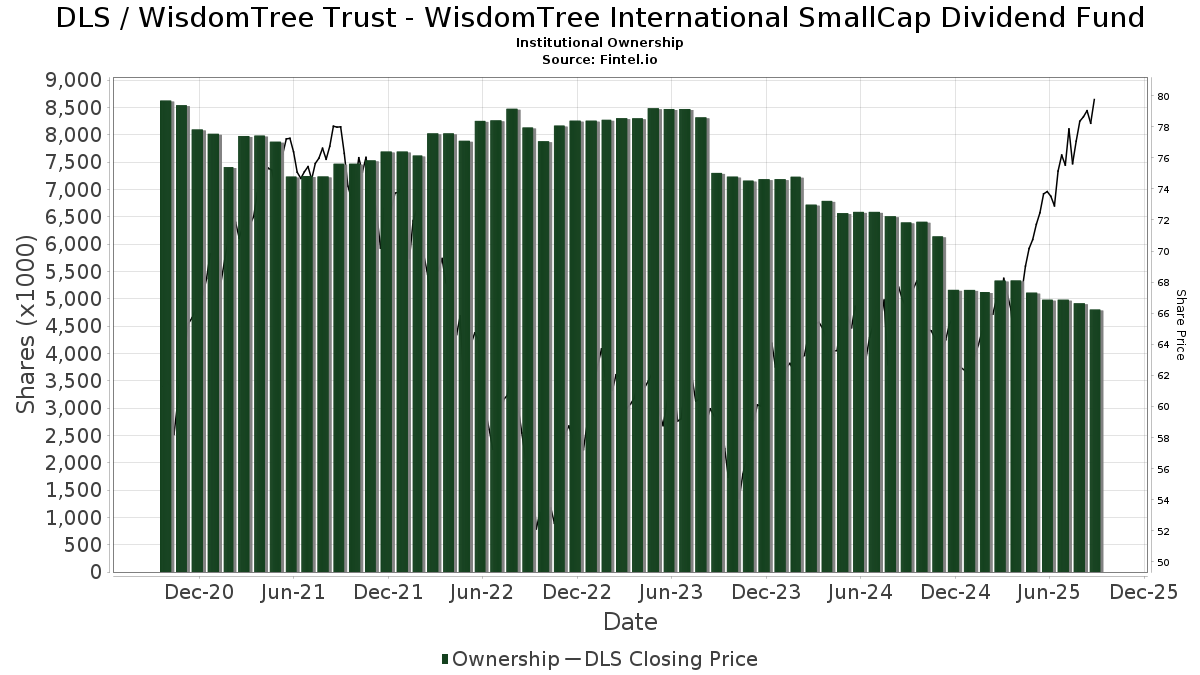
WisdomTree Trust - WisdomTree International SmallCap Dividend Fund (US:DLS) har 197 institutionelle ejere og aktionærer, der har indsendt 13D/G- eller 13F-formularer til Securities Exchange Commission (SEC). Disse institutioner har i alt 4,803,841 aktier. Største aktionærer omfatter Savant Capital, LLC, BIP Wealth, LLC, LRI Investments, LLC, Bank Of America Corp /de/, Morgan Stanley, HighTower Advisors, LLC, MAI Capital Management, Congress Wealth Management LLC / DE /, Raymond James Financial Inc, and UBS Group AG .
WisdomTree Trust - WisdomTree International SmallCap Dividend Fund (ARCA:DLS) institutionel ejerskabsstruktur viser aktuelle positioner i virksomheden efter institutioner og fonde, samt seneste ændringer i positionsstørrelse. Større aktionærer kan omfatte individuelle investorer, investeringsforeninger, hedgefonde eller institutioner. Skema 13D angiver, at investoren besidder (eller besidder) mere end 5 % af virksomheden og har til hensigt (eller har til hensigt at) aktivt at forfølge en ændring i forretningsstrategi. Skema 13G indikerer en passiv investering på over 5%.
The share price as of September 11, 2025 is 80,68 / share. Previously, on September 11, 2024, the share price was 66,41 / share. This represents an increase of 21,49% over that period.
Fondens stemningsscore
Fund Sentiment Score (fka Ownership Accumulation Score) finder de aktier, der bliver mest købt af fonde. Det er resultatet af en sofistikeret, multi-faktor kvantitativ model, der identificerer virksomheder med de højeste niveauer af institutionel akkumulering. Scoringsmodellen bruger en kombination af den samlede stigning i oplyste ejere, ændringerne i porteføljeallokeringer i disse ejere og andre målinger. Tallet går fra 0 til 100, hvor højere tal indikerer et højere niveau af akkumulering for sine jævnaldrende, og 50 er gennemsnittet.
Opdateringsfrekvens: Dagligt
Se Ownership Explorer, som giver en liste over højest rangerende virksomheder.
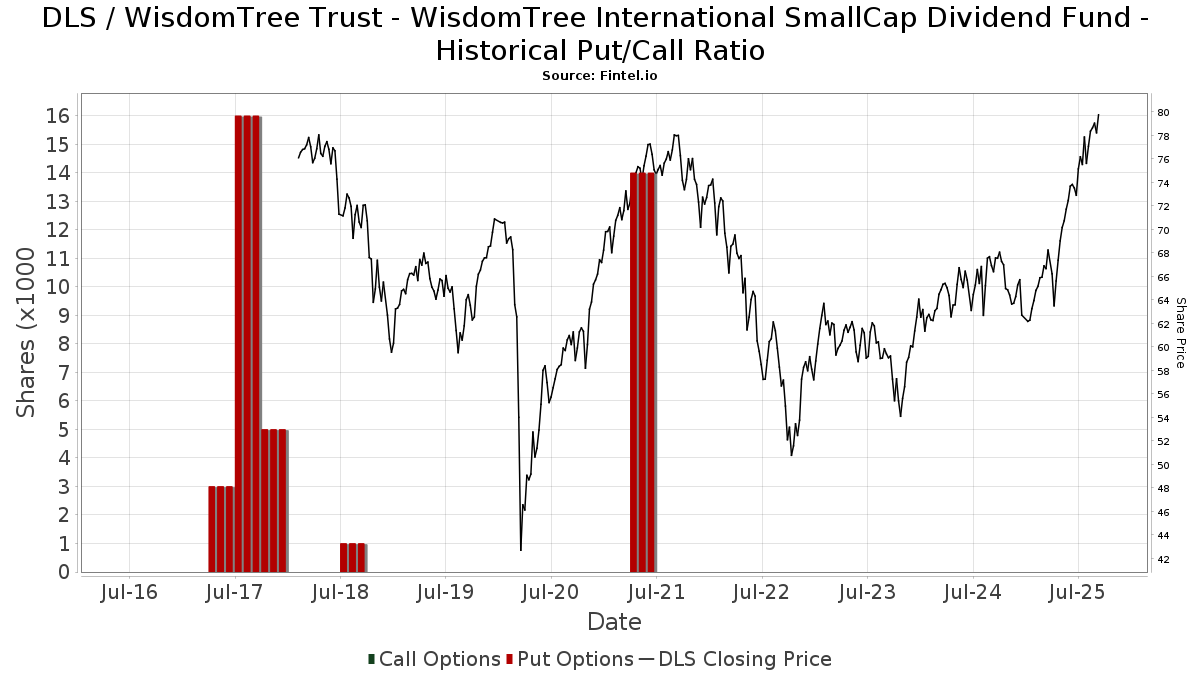
Institutionel Put/Call-forhold
Ud over at indberette standardaktie- og gældsudstedelser skal institutter med mere end 100 mill. aktiver under forvaltning også oplyse deres put- og call-optionsbeholdninger. Da salgsoptioner generelt indikerer negativ stemning, og købsoptioner indikerer positiv stemning, kan vi få en fornemmelse af den overordnede institutionelle stemning ved at plotte forholdet mellem put og kald. Diagrammet til højre viser det historiske put/call-forhold for dette instrument.
Brug af Put/Call Ratio som en indikator for investorernes stemning overvinder en af de vigtigste mangler ved at bruge totalt institutionelt ejerskab, som er, at en betydelig mængde af aktiver under forvaltning investeres passivt for at spore indekser. Passivt forvaltede fonde køber typisk ikke optioner, så indikatoren for put/call-forholdet følger mere nøje følelsen af aktivt forvaltede fonde.
13F og NPORT arkivering
Detaljer om 13F-arkivering er gratis. Detaljer om NP-ansøgninger kræver et premium-medlemskab. Grønne rækker angiver nye positioner. Røde rækker angiver lukkede positioner. Klik på linket ikon for at se den fulde transaktionshistorik.
Opgrader
for at låse premium-data op og eksportere til Excel ![]() .
.
| Fil dato | Kilde | Investor | Type | Gennemsnitlig pris (Øst) |
Aktier | Δ Aktier (%) |
Rapporteret Værdi ($1000) |
Δ Værdi (%) |
Port Alloc (%) |
|
|---|---|---|---|---|---|---|---|---|---|---|
| 2025-08-19 | 13F | Newbridge Financial Services Group, Inc. | 100 | 0,00 | 8 | 16,67 | ||||
| 2025-08-12 | 13F | Global Retirement Partners, LLC | 2.850 | 119,23 | 214 | 164,20 | ||||
| 2025-04-30 | 13F | Dogwood Wealth Management LLC | 0 | -100,00 | 0 | |||||
| 2025-07-22 | 13F | Berger Financial Group, Inc | 2.782 | -21,90 | 209 | -11,49 | ||||
| 2025-07-29 | 13F | Signature Estate & Investment Advisors Llc | 8.360 | 1,42 | 628 | 15,26 | ||||
| 2025-07-23 | 13F | REAP Financial Group, LLC | 51 | 0,00 | 4 | 0,00 | ||||
| 2025-07-15 | 13F | FLP Wealth Management, LLC | 0 | -100,00 | 0 | |||||
| 2025-07-16 | 13F | Cove Private Wealth, LLC | 18.325 | 83,25 | 1.376 | 108,48 | ||||
| 2025-08-14 | 13F | Mariner, LLC | 0 | -100,00 | 0 | |||||
| 2025-07-30 | 13F | Princeton Global Asset Management LLC | 653 | -5,77 | 49 | 8,89 | ||||
| 2025-07-21 | 13F | Empirical Financial Services, LLC d.b.a. Empirical Wealth Management | 56.768 | -1,27 | 4.264 | 12,36 | ||||
| 2025-04-28 | 13F | Great Point Wealth Advisors, LLC | 78.914 | -1,18 | 5.209 | 3,60 | ||||
| 2025-07-21 | 13F | Ameritas Advisory Services, LLC | 59 | 4 | ||||||
| 2025-08-13 | 13F | Smith, Moore & Co. | 28.219 | 0,00 | 2.120 | 13,80 | ||||
| 2025-08-14 | 13F | Smartleaf Asset Management LLC | 6 | 0,00 | 0 | |||||
| 2025-08-15 | 13F | Equitable Holdings, Inc. | 12.260 | 2,19 | 921 | 16,31 | ||||
| 2025-08-14 | 13F | Atomi Financial Group, Inc. | 86.162 | -0,90 | 6.472 | 12,77 | ||||
| 2025-07-17 | 13F | Camelot Portfolios, LLC | 7.661 | -8,73 | 575 | 3,79 | ||||
| 2025-08-08 | 13F | Cetera Investment Advisers | 5.364 | -7,36 | 403 | 5,24 | ||||
| 2025-08-13 | 13F | Transce3nd, LLC | 668 | 0,00 | 50 | 13,64 | ||||
| 2025-07-17 | 13F | Sound Income Strategies, LLC | 98 | 0,00 | 7 | 16,67 | ||||
| 2025-05-01 | 13F | Bleakley Financial Group, LLC | 0 | -100,00 | 0 | -100,00 | ||||
| 2025-08-14 | 13F | Colony Group, LLC | 3.091 | -19,59 | 232 | -8,30 | ||||
| 2025-08-12 | 13F | MAI Capital Management | 113.605 | -1,82 | 8.533 | 11,72 | ||||
| 2025-08-14 | 13F | Qube Research & Technologies Ltd | 122 | 0,00 | 9 | 12,50 | ||||
| 2025-08-12 | 13F | SRS Capital Advisors, Inc. | 147 | 11 | ||||||
| 2025-07-24 | 13F | Us Bancorp \de\ | 300 | -76,92 | 23 | -74,12 | ||||
| 2025-08-12 | 13F | Shakespeare Wealth Management, Inc. | 11.376 | -8,79 | 854 | 3,77 | ||||
| 2025-08-12 | 13F | BlackRock, Inc. | 4.099 | 5.593,06 | 308 | 7.575,00 | ||||
| 2025-07-31 | 13F | Buckingham Strategic Partners | 48.366 | -7,88 | 3.633 | 4,82 | ||||
| 2025-08-11 | 13F | Strategic Wealth Partners, Ltd. | 0 | 0 | ||||||
| 2025-08-15 | 13F | Morgan Stanley | 162.461 | -1,74 | 12.202 | 11,82 | ||||
| 2025-07-15 | 13F | Mather Group, Llc. | 7.445 | 0,00 | 559 | 13,85 | ||||
| 2025-08-07 | 13F | WESCAP Management Group, Inc. | 61.499 | -8,25 | 4.619 | 4,41 | ||||
| 2025-07-24 | 13F | Blair William & Co/il | 3.245 | 0,09 | 244 | 13,55 | ||||
| 2025-07-28 | 13F | Ritholtz Wealth Management | 20.818 | -1,23 | 1.564 | 12,37 | ||||
| 2025-08-04 | 13F | Waterfront Wealth Inc. | 54.175 | 1,65 | 4.069 | 15,70 | ||||
| 2025-07-15 | 13F | Bannerman Wealth Management Group, Llc | 3.994 | -4,70 | 300 | 8,33 | ||||
| 2025-07-16 | 13F | Highline Wealth Partners Llc | 171 | 1,79 | 13 | 9,09 | ||||
| 2025-08-06 | 13F | Longview Financial Advisors LLC | 9.992 | -0,37 | 750 | 13,46 | ||||
| 2025-07-15 | 13F | McAdam, LLC | 3.459 | -6,56 | 260 | 6,15 | ||||
| 2025-07-25 | 13F | Cwm, Llc | 617 | 0 | ||||||
| 2025-07-22 | 13F | Windward Private Wealth Management Inc. | 10.425 | -10,04 | 783 | 2,49 | ||||
| 2025-08-11 | 13F | Private Advisor Group, LLC | 4.810 | 13,74 | 361 | 29,39 | ||||
| 2025-08-14 | 13F | AllSquare Wealth Management LLC | 7.280 | 0,00 | 547 | 13,75 | ||||
| 2025-08-11 | 13F | Wealthspire Advisors, LLC | 4.021 | 0,42 | 302 | 14,02 | ||||
| 2025-07-17 | 13F | Alpine Bank Wealth Management | 207 | 16 | ||||||
| 2025-08-15 | 13F | CI Private Wealth, LLC | 57.886 | 100,15 | 4.335 | 127,15 | ||||
| 2025-08-11 | 13F | Principal Securities, Inc. | 562 | -16,99 | 42 | 0,00 | ||||
| 2025-07-14 | 13F | Financial Harvest, LLC | 2.771 | 208 | ||||||
| 2025-08-13 | 13F | IAG Wealth Partners, LLC | 3.596 | -20,76 | 270 | -9,70 | ||||
| 2025-07-24 | 13F | Jfs Wealth Advisors, Llc | 4.378 | 0,53 | 329 | 14,29 | ||||
| 2025-08-13 | 13F | Capital Analysts, Inc. | 11.919 | 21,39 | 1 | |||||
| 2025-08-12 | 13F | Proequities, Inc. | 0 | 0 | ||||||
| 2025-07-23 | 13F | Sachetta, LLC | 0 | -100,00 | 0 | |||||
| 2025-04-17 | 13F | Nbt Bank N A /ny | 0 | -100,00 | 0 | |||||
| 2025-08-14 | 13F | Betterment LLC | 16.028 | 6,63 | 1 | |||||
| 2025-08-18 | 13F/A | National Bank Of Canada /fi/ | 415 | 137,14 | 31 | 181,82 | ||||
| 2025-07-07 | 13F | Discipline Wealth Solutions, LLC | 4.722 | 355 | ||||||
| 2025-08-18 | 13F | Front Row Advisors LLC | 1.664 | 125 | ||||||
| 2025-07-15 | 13F | Fifth Third Bancorp | 3.589 | 0,00 | 270 | 13,98 | ||||
| 2025-08-05 | 13F | Cherry Tree Wealth Management, LLC | 3.189 | -0,72 | 240 | 13,27 | ||||
| 2025-08-14 | 13F | IHT Wealth Management, LLC | 6.078 | -10,72 | 457 | 1,56 | ||||
| 2025-07-09 | 13F | Beacon Financial Group | 2.929 | 220 | ||||||
| 2025-07-24 | 13F | Costello Asset Management, INC | 0 | -100,00 | 0 | |||||
| 2025-08-12 | 13F | Jpmorgan Chase & Co | 3.725 | -46,60 | 280 | -39,35 | ||||
| 2025-08-14 | 13F | Bank Of America Corp /de/ | 181.465 | -7,75 | 13.630 | 4,98 | ||||
| 2025-07-21 | 13F | DHJJ Financial Advisors, Ltd. | 470 | 35 | ||||||
| 2025-08-05 | 13F | GHP Investment Advisors, Inc. | 25.080 | -5,71 | 1.884 | 7,29 | ||||
| 2025-08-14 | 13F | CoreCap Advisors, LLC | 13.640 | -0,48 | 1.025 | 13,27 | ||||
| 2025-08-07 | 13F | Cahill Financial Advisors Inc | 8.131 | 0,84 | 611 | 14,66 | ||||
| 2025-05-28 | 13F/A | Modern Wealth Management, LLC | 3.223 | 206 | ||||||
| 2025-07-15 | 13F | Family Wealth Partners, Llc | 38.685 | -0,21 | 2.906 | 13,57 | ||||
| 2025-07-24 | 13F | True Link Financial Advisors, LLC | 0 | -100,00 | 0 | |||||
| 2025-07-21 | 13F | Crews Bank & Trust | 1.220 | 0,00 | 92 | 13,75 | ||||
| 2025-08-14 | 13F | Fmr Llc | 2.975 | 16,85 | 223 | 32,74 | ||||
| 2025-08-08 | 13F | Creative Planning | 41.691 | -9,17 | 3.131 | 3,37 | ||||
| 2025-08-13 | 13F | Jones Financial Companies Lllp | 19.838 | 2,54 | 1.483 | 14,71 | ||||
| 2025-04-09 | 13F | St Germain D J Co Inc | 0 | 0 | ||||||
| 2025-04-30 | 13F | M&t Bank Corp | 0 | -100,00 | 0 | |||||
| 2025-07-17 | 13F | Montis Financial, LLC | 3.062 | -1,70 | 230 | 11,71 | ||||
| 2025-07-22 | 13F | Checchi Capital Advisers, LLC | 92.096 | -26,87 | 6.917 | -16,77 | ||||
| 2025-08-11 | 13F | Independent Advisor Alliance | 3.000 | 225 | ||||||
| 2025-08-06 | 13F | Modera Wealth Management, LLC | 3.531 | -2,05 | 265 | 11,81 | ||||
| 2025-08-07 | 13F | Howard Bailey Securities, Llc | 38.595 | -3,16 | 2.899 | 10,19 | ||||
| 2025-08-08 | 13F | Larson Financial Group LLC | 21.331 | -15,91 | 1.602 | -4,30 | ||||
| 2025-04-16 | 13F | Smithbridge Asset Management Inc/de | 0 | -100,00 | 0 | |||||
| 2025-07-11 | 13F | Pinnacle Bancorp, Inc. | 170 | 0,00 | 13 | 9,09 | ||||
| 2025-08-04 | 13F | Bristlecone Advisors, LLC | 21.877 | 3,33 | 1.643 | 17,61 | ||||
| 2025-07-15 | 13F | Evanson Asset Management, LLC | 84.915 | 0,33 | 6.378 | 14,16 | ||||
| 2025-09-04 | 13F/A | Advisor Group Holdings, Inc. | 38.283 | 1,15 | 2.877 | 15,13 | ||||
| 2025-08-05 | 13F | Bank Of Montreal /can/ | 64.917 | -3,06 | 4.876 | 10,32 | ||||
| 2025-08-12 | 13F | LPL Financial LLC | 50.013 | -2,52 | 3.756 | 10,93 | ||||
| 2025-05-08 | 13F | Geneos Wealth Management Inc. | 0 | -100,00 | 0 | |||||
| 2025-05-01 | 13F | Quest 10 Wealth Builders, Inc. | 46 | -19,30 | 3 | 0,00 | ||||
| 2025-07-31 | 13F | Glass Jacobson Investment Advisors llc | 0 | -100,00 | 0 | |||||
| 2025-08-12 | 13F | Bokf, Na | 0 | -100,00 | 0 | |||||
| 2025-08-18 | 13F | Hollencrest Capital Management | 1.449 | 0,00 | 109 | 13,68 | ||||
| 2025-08-27 | NP | FFOX - FundX Future Fund Opportunities ETF | 700 | 53 | ||||||
| 2025-08-14 | 13F | Comerica Bank | 4.608 | -5,81 | 346 | 7,45 | ||||
| 2025-08-13 | 13F | Invesco Ltd. | 4.035 | -7,71 | 303 | 5,21 | ||||
| 2025-08-11 | 13F | Bellwether Advisors, LLC | 1.225 | 0,00 | 92 | 15,00 | ||||
| 2025-08-13 | 13F | Congress Wealth Management LLC / DE / | 110.966 | 0,38 | 8.335 | 14,23 | ||||
| 2025-07-25 | 13F | LRI Investments, LLC | 200.354 | -0,99 | 15.049 | 12,68 | ||||
| 2025-08-13 | 13F | Flow Traders U.s. Llc | 0 | -100,00 | 0 | |||||
| 2025-08-05 | 13F | Key FInancial Inc | 400 | 0,00 | 30 | 15,38 | ||||
| 2025-08-06 | 13F | Savant Capital, LLC | 762.754 | -2,80 | 57.290 | 10,62 | ||||
| 2025-08-12 | 13F | Tradition Wealth Management, LLC | 4.447 | 0,00 | 334 | 13,99 | ||||
| 2025-07-08 | 13F | Parallel Advisors, LLC | 500 | 0,00 | 38 | 12,12 | ||||
| 2025-04-09 | 13F | Compass Investment Advisers LLC | 3.342 | 210 | ||||||
| 2025-07-28 | 13F | Harbour Investments, Inc. | 27.898 | 1,77 | 2.095 | 15,81 | ||||
| 2025-08-07 | 13F | Addison Advisors LLC | 17.551 | -9,11 | 1.318 | 3,45 | ||||
| 2025-07-21 | 13F | Ameriflex Group, Inc. | 17 | 0,00 | 1 | 0,00 | ||||
| 2025-04-28 | 13F | Redmont Wealth Advisors Llc | 42 | 3 | ||||||
| 2025-05-13 | 13F | EPG Wealth Management LLC | 0 | -100,00 | 0 | |||||
| 2025-08-06 | 13F | AE Wealth Management LLC | 1.432 | -9,99 | 108 | 2,88 | ||||
| 2025-07-24 | 13F | Morton Brown Family Wealth, LLC | 1.820 | 0,00 | 137 | 13,33 | ||||
| 2025-08-01 | 13F | Liberty Wealth Management Llc | 0 | -100,00 | 0 | |||||
| 2025-08-05 | 13F | Dunhill Financial, LLC | 609 | 46 | ||||||
| 2025-07-17 | 13F | Elwood & Goetz Wealth Advisory Group, LLC | 57.593 | 0,87 | 4.326 | 14,78 | ||||
| 2025-07-25 | 13F | Sequoia Financial Advisors, LLC | 8.635 | -8,85 | 649 | 3,68 | ||||
| 2025-08-14 | 13F | Beaird Harris Wealth Management, LLC | 16.805 | -0,47 | 1.262 | 13,29 | ||||
| 2025-08-14 | 13F | Operose Advisors LLC | 81 | 0,00 | 6 | 20,00 | ||||
| 2025-07-10 | 13F | Wealth Enhancement Advisory Services, Llc | 11.595 | 102,07 | 875 | 131,48 | ||||
| 2025-08-14 | 13F | UBS Group AG | 105.467 | -0,45 | 7.922 | 13,29 | ||||
| 2025-04-21 | 13F | PSI Advisors, LLC | 0 | -100,00 | 0 | |||||
| 2025-08-12 | 13F | Steward Partners Investment Advisory, Llc | 133 | -17,90 | 10 | -10,00 | ||||
| 2025-07-28 | 13F | Fairman Group, LLC | 1.784 | 1,88 | 134 | 22,94 | ||||
| 2025-08-04 | 13F | Creative Financial Designs Inc /adv | 221 | -19,34 | 17 | -11,11 | ||||
| 2025-08-11 | 13F | Synergy Investment Management, LLC | 0 | -100,00 | 0 | |||||
| 2025-07-07 | 13F | Investors Research Corp | 4.756 | -78,71 | 357 | -75,78 | ||||
| 2025-05-08 | 13F | Armis Advisers, LLC | 0 | -100,00 | 0 | |||||
| 2025-08-08 | 13F | Tortoise Investment Management, LLC | 14.319 | 0,00 | 1.076 | 13,76 | ||||
| 2025-08-12 | 13F | Howe & Rusling Inc | 14 | 0,00 | 1 | |||||
| 2025-07-16 | 13F | TCI Wealth Advisors, Inc. | 4.014 | -8,50 | 301 | 4,15 | ||||
| 2025-05-14 | 13F | Wescott Financial Advisory Group, LLC | 0 | -100,00 | 0 | |||||
| 2025-08-12 | 13F | CIBC Private Wealth Group, LLC | 2.398 | -5,29 | 180 | 19,21 | ||||
| 2025-07-08 | 13F | Nbc Securities, Inc. | 206 | 0,00 | 0 | |||||
| 2025-07-17 | 13F | Janney Montgomery Scott LLC | 27.616 | -3,66 | 2 | 100,00 | ||||
| 2025-07-14 | 13F | AdvisorNet Financial, Inc | 59 | 0,00 | 4 | 33,33 | ||||
| 2025-07-03 | 13F | McLean Asset Management Corp | 21.746 | -3,14 | 1.634 | 21,49 | ||||
| 2025-08-06 | 13F | Prospera Financial Services Inc | 18.035 | 1,31 | 1.355 | 15,33 | ||||
| 2025-07-29 | 13F | Marathon Strategic Advisors, LLC | 23.953 | 1,93 | 1.799 | 16,06 | ||||
| 2025-08-29 | 13F | Evolution Wealth Management Inc. | 2.341 | 176 | ||||||
| 2025-08-12 | 13F | O'shaughnessy Asset Management, Llc | 1.511 | -34,53 | 113 | -25,66 | ||||
| 2025-07-25 | 13F | NorthRock Partners, LLC | 0 | -100,00 | 0 | |||||
| 2025-07-24 | 13F | Capital Advisors, Ltd. LLC | 552 | 0,00 | 0 | |||||
| 2025-08-13 | 13F | Russell Investments Group, Ltd. | 106 | 51,43 | 8 | 75,00 | ||||
| 2025-08-11 | 13F | Citigroup Inc | 15.984 | 0,08 | 1.201 | 13,85 | ||||
| 2025-05-15 | 13F | Hrt Financial Lp | 0 | -100,00 | 0 | |||||
| 2025-08-14 | 13F | Citadel Advisors Llc | 31.106 | 376,06 | 2.336 | 442,00 | ||||
| 2025-08-06 | 13F | Commonwealth Equity Services, Llc | 20.568 | -6,70 | 2 | 0,00 | ||||
| 2025-08-08 | 13F | Pinney & Scofield, Inc. | 86 | 0,00 | 6 | 20,00 | ||||
| 2025-07-30 | 13F | Insight Advisors, LLC/ PA | 4.130 | -35,55 | 310 | -26,54 | ||||
| 2025-07-15 | 13F | Total Wealth Planning, Llc | 3.276 | -10,71 | 246 | 1,65 | ||||
| 2025-08-06 | 13F | Csenge Advisory Group | 94.789 | -2,28 | 6.891 | 7,22 | ||||
| 2025-07-17 | 13F | Neumann Capital Management, LLC | 69.221 | -1,76 | 5.199 | 11,81 | ||||
| 2025-07-28 | 13F | Frazier Financial Advisors, LLC | 2.505 | 0,40 | 188 | 14,63 | ||||
| 2025-08-14 | 13F | Susquehanna International Group, Llp | 7.186 | -30,88 | 540 | -21,43 | ||||
| 2025-07-09 | 13F | Hardin Capital Partners, LLC | 5.114 | 31,13 | 383 | 48,64 | ||||
| 2025-07-23 | 13F | Joel Isaacson & Co., LLC | 5.286 | 0,00 | 397 | 14,08 | ||||
| 2025-08-15 | 13F | Kestra Advisory Services, LLC | 44.162 | 9,69 | 3.317 | 24,84 | ||||
| 2025-08-15 | 13F | Captrust Financial Advisors | 2.713 | 204 | ||||||
| 2025-08-05 | 13F | Telos Capital Management, Inc. | 82.581 | 0,58 | 6.203 | 14,45 | ||||
| 2025-08-07 | 13F | Allworth Financial LP | 28.965 | -1,11 | 2.176 | 8,97 | ||||
| 2025-08-19 | 13F | Asset Dedication, LLC | 93 | -28,46 | 7 | -25,00 | ||||
| 2025-07-11 | 13F | Farther Finance Advisors, LLC | 9.984 | -2,91 | 750 | 10,31 | ||||
| 2025-08-13 | 13F | Colonial Trust Co / SC | 568 | -6,73 | 42 | 5,00 | ||||
| 2025-08-12 | 13F | Coldstream Capital Management Inc | 2.773 | 0,00 | 208 | 13,66 | ||||
| 2025-08-14 | 13F | Royal Bank Of Canada | 39.862 | -7,18 | 2.994 | 5,61 | ||||
| 2025-04-24 | 13F | Decker Retirement Planning Inc. | 0 | -100,00 | 0 | |||||
| 2025-07-30 | 13F | Cullen/frost Bankers, Inc. | 1.373 | 0,00 | 103 | 14,44 | ||||
| 2025-08-04 | 13F | Atria Investments Llc | 24.832 | 1,98 | 1.865 | 16,05 | ||||
| 2025-08-08 | 13F | Avantax Advisory Services, Inc. | 9.402 | -5,50 | 706 | 7,62 | ||||
| 2025-08-08 | 13F | Pnc Financial Services Group, Inc. | 0 | -100,00 | 0 | |||||
| 2025-07-25 | 13F | Wealth Architects, LLC | 34.933 | -1,04 | 2.624 | 12,62 | ||||
| 2025-08-13 | 13F | Grove Street Fiduciary, LLC | 51.553 | -6,20 | 3.872 | 6,75 | ||||
| 2025-07-18 | 13F | Impact Capital Partners LLC | 20.738 | 0,84 | 1.558 | 14,74 | ||||
| 2025-08-14 | 13F | Ameriprise Financial Inc | 4.938 | -23,89 | 371 | -13,55 | ||||
| 2025-07-16 | 13F | Vestia Personal Wealth Advisors | 3.321 | 1,31 | 249 | 15,28 | ||||
| 2025-08-13 | 13F | Baird Financial Group, Inc. | 2.954 | 222 | ||||||
| 2025-08-06 | 13F | Quadrant Private Wealth Management, LLC | 5.167 | 0,25 | 388 | 14,12 | ||||
| 2025-08-11 | 13F | Aptus Capital Advisors, LLC | 547 | 0,00 | 41 | 13,89 | ||||
| 2025-08-12 | 13F | Founders Financial Alliance, LLC | 73 | 8,96 | 5 | 25,00 | ||||
| 2025-07-31 | 13F | Kathleen S. Wright Associates Inc. | 29.189 | -0,06 | 2.192 | 13,75 | ||||
| 2025-08-11 | 13F | HighTower Advisors, LLC | 116.177 | -0,13 | 8.726 | 13,65 | ||||
| 2025-08-01 | 13F | Envestnet Asset Management Inc | 14.135 | -6,55 | 1.062 | 6,31 | ||||
| 2025-08-05 | 13F | Integrity Financial Corp /WA | 0 | -100,00 | 0 | |||||
| 2025-07-09 | 13F | Bruce G. Allen Investments, LLC | 14.221 | 0,30 | 1.068 | 14,22 | ||||
| 2025-07-24 | 13F | IFP Advisors, Inc | 1.747 | 0,00 | 131 | 13,91 | ||||
| 2025-07-24 | 13F | Ronald Blue Trust, Inc. | 2.061 | 0,00 | 155 | 13,24 | ||||
| 2025-07-24 | 13F | Williams & Novak, LLC | 5.483 | -0,63 | 412 | 12,91 | ||||
| 2025-08-07 | 13F | Tillman Hartley LLC | 6.492 | 0,03 | 488 | 13,79 | ||||
| 2025-08-08 | 13F | Emerald Investment Partners, Llc | 1.089 | -2,51 | 82 | 10,96 | ||||
| 2025-08-14 | 13F | Stifel Financial Corp | 6.105 | 1,16 | 459 | 15,08 | ||||
| 2025-07-15 | 13F | SJS Investment Consulting Inc. | 39 | 3 | ||||||
| 2025-07-30 | 13F | Crewe Advisors LLC | 245 | 0,00 | 18 | 12,50 | ||||
| 2025-08-08 | 13F | Capital Investment Advisory Services, LLC | 106 | 8 | ||||||
| 2025-08-14 | 13F | Raymond James Financial Inc | 107.315 | 0,62 | 8.060 | 14,50 | ||||
| 2025-08-14 | 13F | Wells Fargo & Company/mn | 72.135 | 14,83 | 5.418 | 30,68 | ||||
| 2025-07-11 | 13F | SILVER OAK SECURITIES, Inc | 12.181 | -5,10 | 915 | 6,65 | ||||
| 2025-07-24 | 13F | Lester Murray Antman dba SimplyRich | 7.896 | 0,00 | 1 | |||||
| 2025-08-04 | 13F | Spire Wealth Management | 12.134 | 0,92 | 911 | 14,88 | ||||
| 2025-08-07 | 13F | Tacita Capital Inc | 1.105 | -11,95 | 83 | 0,00 | ||||
| 2025-08-13 | 13F | Cerity Partners LLC | 6.087 | 10,25 | 457 | 25,55 | ||||
| 2025-07-14 | 13F | Sound Stewardship, LLC | 8.645 | 0,00 | 649 | 13,86 | ||||
| 2025-07-15 | 13F | Alpha Omega Wealth Management LLC | 53.848 | 1,43 | 4.045 | 15,44 | ||||
| 2025-08-13 | 13F | Northwestern Mutual Wealth Management Co | 13.110 | 4,58 | 985 | 18,98 | ||||
| 2025-08-14 | 13F | Warren Averett Asset Management, LLC | 21.668 | -0,39 | 1.627 | 13,38 | ||||
| 2025-08-08 | 13F | Hartland & Co., LLC | 3.828 | 2,41 | 288 | 16,67 | ||||
| 2025-07-25 | 13F | PrairieView Partners, LLC | 59.532 | 13,25 | 4 | 33,33 | ||||
| 2025-08-11 | 13F | One Capital Management, LLC | 5.437 | -11,55 | 408 | 0,74 | ||||
| 2025-08-11 | 13F | Rockbridge Investment Management, LCC | 3.398 | -0,38 | 255 | 13,33 | ||||
| 2025-08-27 | 13F | Stonebridge Wealth Management, LLC | 10.853 | 815 | ||||||
| 2025-08-05 | 13F | Bank of New York Mellon Corp | 2.795 | 210 | ||||||
| 2025-07-14 | 13F | GAMMA Investing LLC | 460 | -46,39 | 35 | -39,29 | ||||
| 2025-07-31 | 13F | Sharper & Granite LLC | 23.910 | -8,91 | 1.797 | 3,70 | ||||
| 2025-08-14 | 13F | Jane Street Group, Llc | 24.373 | -48,17 | 1.831 | -41,02 | ||||
| 2025-07-22 | 13F | Tandem Investment Partners LLC | 28.295 | 2,56 | 2.125 | 16,76 | ||||
| 2025-08-12 | 13F | AlphaCore Capital LLC | 185 | -75,50 | 14 | -73,47 | ||||
| 2025-08-12 | 13F | Heartland Advisors Inc | 0 | -100,00 | 0 | |||||
| 2025-07-23 | 13F | Viewpoint Capital Management LLC | 6.441 | -0,46 | 484 | 13,11 | ||||
| 2025-07-31 | 13F | BIP Wealth, LLC | 274.694 | -2,92 | 20.632 | 10,49 | ||||
| 2025-07-10 | 13F | Envision Financial LLC | 9.127 | 1,18 | 686 | 15,13 | ||||
| 2025-05-08 | 13F | FSA Advisors, Inc. | 0 | -100,00 | 0 | -100,00 | ||||
| 2025-07-08 | 13F | Apella Capital, LLC | 5.706 | 0,00 | 426 | 17,68 | ||||
| 2025-08-19 | 13F | Advisory Services Network, LLC | 5.992 | -2,87 | 452 | 10,81 |