Grundlæggende statistik
| Institutionelle ejere | 133 total, 133 long only, 0 short only, 0 long/short - change of 7,14% MRQ |
| Gennemsnitlig porteføljeallokering | 0.3654 % - change of 14,95% MRQ |
| Institutionelle aktier (lange) | 11.012.031 (ex 13D/G) - change of 0,53MM shares 5,10% MRQ |
| Institutionel værdi (lang) | $ 411.280 USD ($1000) |
Institutionelt ejerskab og aktionærer
iPath Bloomberg Commodity Index Total Return ETN (US:DJP) har 133 institutionelle ejere og aktionærer, der har indsendt 13D/G- eller 13F-formularer til Securities Exchange Commission (SEC). Disse institutioner har i alt 11,012,031 aktier. Største aktionærer omfatter BLB&B Advisors, LLC, Cassaday & Co Wealth Management LLC, Osborne Partners Capital Management, Llc, Dimension Capital Management Llc, Badgley Phelps Wealth Managers, LLC, Wealth Enhancement Advisory Services, Llc, Bnp Paribas Arbitrage, Sa, Sax Wealth Advisors, Llc, Ameriprise Financial Inc, and Legend Financial Advisors, Inc. .
iPath Bloomberg Commodity Index Total Return ETN (ARCA:DJP) institutionel ejerskabsstruktur viser aktuelle positioner i virksomheden efter institutioner og fonde, samt seneste ændringer i positionsstørrelse. Større aktionærer kan omfatte individuelle investorer, investeringsforeninger, hedgefonde eller institutioner. Skema 13D angiver, at investoren besidder (eller besidder) mere end 5 % af virksomheden og har til hensigt (eller har til hensigt at) aktivt at forfølge en ændring i forretningsstrategi. Skema 13G indikerer en passiv investering på over 5%.
The share price as of April 7, 2026 is 48,88 / share. Previously, on April 8, 2025, the share price was 31,75 / share. This represents an increase of 53,95% over that period.

Fondens stemningsscore
Fund Sentiment Score (fka Ownership Accumulation Score) finder de aktier, der bliver mest købt af fonde. Det er resultatet af en sofistikeret, multi-faktor kvantitativ model, der identificerer virksomheder med de højeste niveauer af institutionel akkumulering. Scoringsmodellen bruger en kombination af den samlede stigning i oplyste ejere, ændringerne i porteføljeallokeringer i disse ejere og andre målinger. Tallet går fra 0 til 100, hvor højere tal indikerer et højere niveau af akkumulering for sine jævnaldrende, og 50 er gennemsnittet.
Opdateringsfrekvens: Dagligt
Se Ownership Explorer, som giver en liste over højest rangerende virksomheder.
AI+ Ask Fintel’s AI assistant about iPath Bloomberg Commodity Index Total Return ETN.
Select a question to share a public post with an AI-crafted answer.
Thinking of good questions…
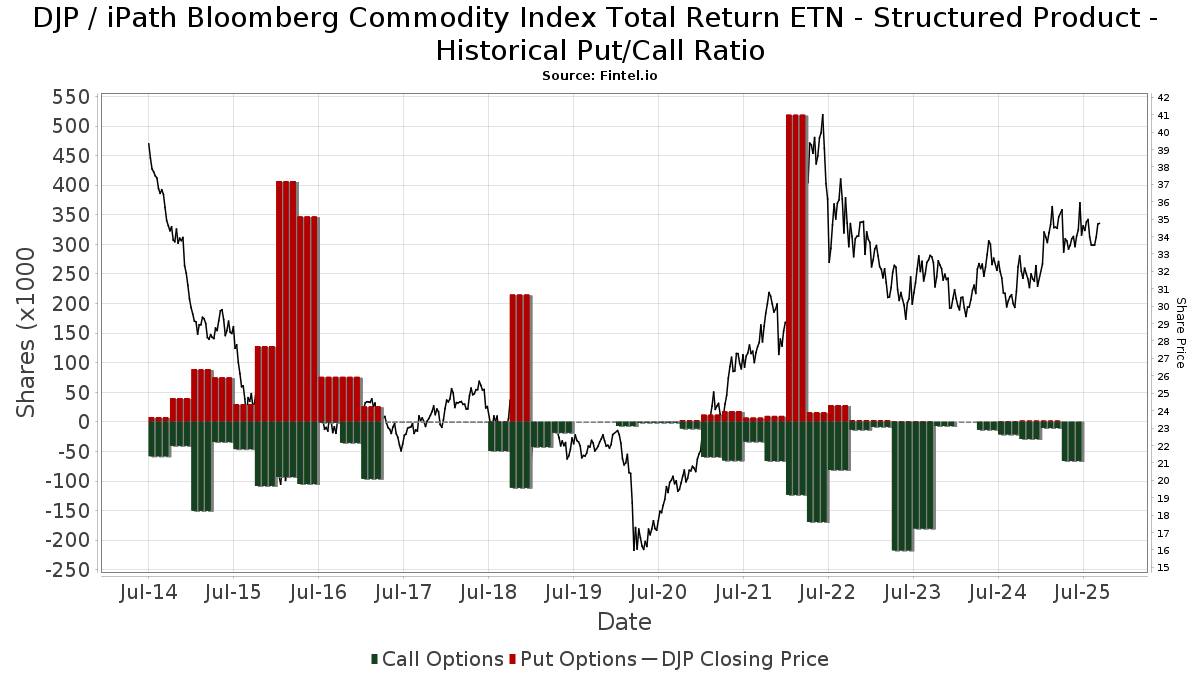
Institutionel Put/Call-forhold
Ud over at indberette standardaktie- og gældsudstedelser skal institutter med mere end 100 mill. aktiver under forvaltning også oplyse deres put- og call-optionsbeholdninger. Da salgsoptioner generelt indikerer negativ stemning, og købsoptioner indikerer positiv stemning, kan vi få en fornemmelse af den overordnede institutionelle stemning ved at plotte forholdet mellem put og kald. Diagrammet til højre viser det historiske put/call-forhold for dette instrument.
Brug af Put/Call Ratio som en indikator for investorernes stemning overvinder en af de vigtigste mangler ved at bruge totalt institutionelt ejerskab, som er, at en betydelig mængde af aktiver under forvaltning investeres passivt for at spore indekser. Passivt forvaltede fonde køber typisk ikke optioner, så indikatoren for put/call-forholdet følger mere nøje følelsen af aktivt forvaltede fonde.
13F og NPORT arkivering
Detaljer om 13F-arkivering er gratis. Detaljer om NP-ansøgninger kræver et premium-medlemskab. Grønne rækker angiver nye positioner. Røde rækker angiver lukkede positioner. Klik på linket ikon for at se den fulde transaktionshistorik.
Opgrader
for at låse premium-data op og eksportere til Excel ![]() .
.
| Fil dato | Kilde | Investor | Type | Gennemsnitlig pris (Øst) |
Aktier | Δ Aktier (%) |
Rapporteret Værdi ($1000) |
Δ Værdi (%) |
Port Alloc (%) |
|
|---|---|---|---|---|---|---|---|---|---|---|
| 2026-01-26 | 13F | Decker Retirement Planning Inc. | 286 | 11 | ||||||
| 2026-01-29 | 13F | Concord Wealth Partners | 14 | 0,00 | 1 | |||||
| 2026-02-10 | 13F | Measured Wealth Private Client Group, LLC | 8.601 | 2,62 | 323 | 8,75 | ||||
| 2025-11-12 | 13F | Lansing Street Advisors | 0 | -100,00 | 0 | |||||
| 2026-01-27 | 13F | Sharper & Granite LLC | 38.118 | 0,38 | 1.434 | 6,54 | ||||
| 2026-01-20 | 13F | Ethos Financial Group, LLC | 59.936 | 2.254 | ||||||
| 2026-02-10 | 13F | JTC Employer Solutions Trusteee Ltd | 16.090 | 0,00 | 1 | |||||
| 2026-01-29 | 13F | UBS Group AG | 2.562 | 42,10 | 96 | 52,38 | ||||
| 2026-01-30 | 13F | Us Bancorp \de\ | 4.164 | -43,31 | 157 | -40,00 | ||||
| 2026-01-22 | 13F | Bear Mountain Capital, Inc. | 2 | 0,00 | 0 | |||||
| 2026-02-17 | 13F | Advisory Services Network, LLC | 6.202 | -71,49 | 233 | -69,78 | ||||
| 2026-02-13 | 13F | Transamerica Financial Advisors, Inc. | 22 | 1 | ||||||
| 2026-02-17 | 13F | Warren Averett Asset Management, LLC | 117.144 | 4.406 | ||||||
| 2026-01-30 | 13F | Richardson Capital Management LLC | 871 | 0,00 | 33 | 6,67 | ||||
| 2026-01-28 | 13F | Badgley Phelps Wealth Managers, LLC | 443.874 | -5,80 | 16.694 | -0,03 | ||||
| 2025-11-13 | 13F | RMB Capital Management, LLC | 0 | -100,00 | 0 | |||||
| 2026-01-27 | 13F | Brighton Jones Llc | 0 | -100,00 | 0 | |||||
| 2026-02-12 | 13F | Mount Yale Investment Advisors, LLC | 6.500 | 0,00 | 244 | 6,09 | ||||
| 2026-02-12 | 13F | Rossby Financial, LCC | 49 | 0,00 | 2 | 0,00 | ||||
| 2026-02-19 | 13F | Atomi Financial Group, Inc. | 113.029 | 2.877 | ||||||
| 2025-11-14 | 13F | Raymond James Financial Inc | 0 | -100,00 | 0 | |||||
| 2026-01-22 | 13F | Financial Consulate, Inc | 118 | 4 | ||||||
| 2025-10-27 | 13F | First Horizon Corp | 0 | -100,00 | 0 | |||||
| 2026-02-11 | 13F | Liberty Square Wealth Partners Llc | 6.780 | -33,39 | 255 | -29,44 | ||||
| 2026-02-17 | 13F | Cetera Investment Advisers | 14.738 | -3,26 | 554 | 2,78 | ||||
| 2026-02-09 | 13F | Huntington National Bank | 0 | |||||||
| 2026-01-29 | 13F | Sanctuary Advisors, LLC | 8.810 | 331 | ||||||
| 2026-02-13 | 13F | Wells Fargo & Company/mn | 1 | -99,97 | 0 | -100,00 | ||||
| 2026-02-05 | 13F | Idaho Trust Bank | 89.829 | 22,54 | 3.378 | 30,07 | ||||
| 2026-02-12 | 13F | CIBC Private Wealth Group, LLC | 3.044 | 19,42 | 114 | 26,67 | ||||
| 2026-02-05 | 13F | Allworth Financial LP | 260 | 0,00 | 10 | 0,00 | ||||
| 2026-02-27 | 13F | Strategic Investment Solutions, Inc. /IL | 330 | 0,00 | 12 | 9,09 | ||||
| 2026-02-12 | 13F | Steward Partners Investment Advisory, Llc | 429 | 0,00 | 16 | 6,67 | ||||
| 2026-04-01 | 13F | Bangor Savings Bank | 8.250 | -14,06 | 397 | 9,97 | ||||
| 2026-02-17 | 13F | Snowden Capital Advisors LLC | 19.510 | 0,00 | 734 | 6,08 | ||||
| 2026-04-07 | 13F | Farther Finance Advisors, LLC | 5.948 | 590,02 | 283 | 784,38 | ||||
| 2026-02-11 | 13F | Simplex Trading, Llc | 156 | 6 | ||||||
| 2025-11-14 | 13F | Beacon Pointe Advisors, LLC | 0 | -100,00 | 0 | |||||
| 2025-10-21 | 13F | SOA Wealth Advisors, LLC. | 0 | -100,00 | 0 | |||||
| 2026-02-03 | 13F | Cassaday & Co Wealth Management LLC | 1.359.891 | 0,60 | 51.146 | 6,76 | ||||
| 2025-10-31 | 13F | Whittier Trust Co | 0 | -100,00 | 0 | |||||
| 2026-02-11 | 13F | Jpmorgan Chase & Co | 39.997 | 135,64 | 1.504 | 150,25 | ||||
| 2026-01-20 | 13F | Nvwm, Llc | 25.095 | 0,14 | 944 | 6,19 | ||||
| 2026-02-17 | 13F | Blue Line Capital, LLC / IL | 12.758 | 480 | ||||||
| 2026-02-11 | 13F | LPL Financial LLC | 29.130 | -8,23 | 1.096 | -2,58 | ||||
| 2026-02-13 | 13F | Stifel Financial Corp | 26.126 | 27,28 | 983 | 35,08 | ||||
| 2026-02-05 | 13F | Bessemer Group Inc | 870 | 0,00 | 0 | |||||
| 2026-02-13 | 13F | Kestra Advisory Services, LLC | 704 | 26 | ||||||
| 2025-11-14 | 13F | CI Private Wealth, LLC | 0 | -100,00 | 0 | |||||
| 2026-02-04 | 13F | Washington Trust Bank | 55.105 | -1,16 | 2.072 | 4,91 | ||||
| 2026-01-30 | 13F | Camden Capital, LLC | 204.390 | 0,00 | 7.687 | 6,13 | ||||
| 2026-01-30 | 13F | Financial Services Advisory Inc | 35.272 | 1.327 | ||||||
| 2026-02-13 | 13F | Vontobel Holding Ltd. | 28.818 | 13,82 | 1.084 | 20,74 | ||||
| 2026-01-23 | 13F | Patten Group, Inc. | 41.659 | 88,28 | 1.567 | 99,74 | ||||
| 2026-01-26 | 13F | Slow Capital, Inc. | 18.516 | 2,24 | 696 | 8,58 | ||||
| 2026-02-17 | 13F | Captrust Financial Advisors | 26.449 | -2,30 | 995 | 3,65 | ||||
| 2026-02-03 | 13F | Apeiron RIA LLC | 9.785 | 13,83 | 391 | 27,36 | ||||
| 2026-02-09 | 13F | Clear Investment Research, Llc | 0 | -100,00 | 0 | |||||
| 2026-02-13 | 13F | Pitcairn Wealth Advisors LLC | 10.413 | 392 | ||||||
| 2026-02-13 | 13F | MAI Capital Management | 4.844 | 1,68 | 182 | 8,33 | ||||
| 2026-02-17 | 13F | Dimension Capital Management Llc | 489.402 | 0,38 | 18.406 | 6,52 | ||||
| 2026-01-22 | 13F | Colony Family Offices, LLC | 6.494 | 0,00 | 244 | 6,09 | ||||
| 2026-02-10 | 13F | Bnp Paribas Arbitrage, Sa | 301.221 | -8,55 | 11.329 | -2,96 | ||||
| 2026-02-17 | 13F | Alliancebernstein L.p. | 6.704 | -6,64 | 252 | -0,79 | ||||
| 2025-11-05 | 13F | Plante Moran Financial Advisors, LLC | 0 | -100,00 | 0 | |||||
| 2026-02-03 | 13F | Heartland Bank & Trust Co | 181.363 | 0,37 | 6.821 | 6,53 | ||||
| 2026-02-13 | 13F | Umb Bank N A/mo | 3.435 | 0,00 | 129 | 6,61 | ||||
| 2025-11-14 | 13F | Jane Street Group, Llc | 0 | -100,00 | 0 | |||||
| 2026-01-23 | 13F | Peak Financial Management, Inc. | 45.831 | -0,53 | 1.724 | 5,58 | ||||
| 2026-02-10 | 13F | Envestnet Asset Management Inc | 20.815 | 44,61 | 783 | 53,33 | ||||
| 2025-11-12 | 13F | Harbour Investments, Inc. | 0 | -100,00 | 0 | |||||
| 2025-11-12 | 13F | RiverGlades Family Offices LLC | 78.270 | 1,91 | 2.774 | 6,29 | ||||
| 2026-02-05 | 13F | Atria Investments Llc | 23.897 | -0,33 | 899 | 5,77 | ||||
| 2026-02-17 | 13F | Susquehanna International Group, Llp | Call | 0 | -100,00 | 0 | ||||
| 2026-02-17 | 13F | Susquehanna International Group, Llp | 0 | -100,00 | 0 | |||||
| 2026-02-13 | 13F | Marino Management, LLC | 33.691 | 1.291 | ||||||
| 2026-02-17 | 13F | Ameriprise Financial Inc | 216.974 | 3,45 | 8.160 | 9,80 | ||||
| 2026-02-11 | 13F | Parallel Advisors, LLC | 9.015 | 2.551,47 | 339 | 2.725,00 | ||||
| 2026-02-18 | 13F | GWM Advisors LLC | 0 | -100,00 | 0 | |||||
| 2026-01-12 | 13F | AllSquare Wealth Management LLC | 34.305 | 0,53 | 1.216 | 4,83 | ||||
| 2026-02-02 | 13F | Ironwood Wealth Management, LLC. | 99.023 | -0,77 | 3.724 | 5,32 | ||||
| 2026-01-28 | 13F | Chicago Partners Investment Group LLC | 73.962 | -3,87 | 3.079 | 11,36 | ||||
| 2026-02-13 | 13F | Croban | 121.568 | 102,96 | 4.572 | 115,41 | ||||
| 2026-02-02 | 13F | Truist Financial Corp | 20.341 | 677 | ||||||
| 2026-01-06 | 13F | Unique Wealth, Llc | 198.800 | 0,66 | 7.477 | 6,82 | ||||
| 2026-02-17 | 13F | Main Street Financial Solutions, LLC | 18.437 | 10,22 | 693 | 17,06 | ||||
| 2026-01-28 | 13F | HB Wealth Management, LLC | 10.000 | 376 | ||||||
| 2026-02-05 | 13F | Mesirow Financial Investment Management, Inc. | 8.050 | 0,00 | 303 | 5,96 | ||||
| 2026-02-04 | 13F | Bailard, Inc. | 22.000 | 0,00 | 827 | 6,16 | ||||
| 2026-02-13 | 13F | LM Advisors LLC | 301 | -96,24 | 8 | |||||
| 2026-01-27 | 13F | Osborne Partners Capital Management, Llc | 736.022 | -2,26 | 27.682 | 3,72 | ||||
| 2026-01-26 | 13F | Cwm, Llc | 2.095 | 0,00 | 0 | |||||
| 2026-01-23 | 13F | Assetmark, Inc | 60 | 2 | ||||||
| 2026-02-11 | 13F | Janney Montgomery Scott LLC | 26.381 | 0,73 | 1 | |||||
| 2026-02-17 | 13F | Royal Bank Of Canada | 12.342 | -2,02 | 464 | 3,80 | ||||
| 2025-11-12 | 13F | Pitcairn Co | 0 | -100,00 | 0 | |||||
| 2026-02-10 | 13F | Lido Advisors, LLC | 34.261 | 0,00 | 1.283 | 5,60 | ||||
| 2026-01-13 | 13F | Matrix Trust Co | 909 | -76,87 | 0 | |||||
| 2026-02-10 | 13F | Bruce G. Allen Investments, LLC | 103.349 | 0,91 | 3.887 | 7,08 | ||||
| 2026-01-12 | 13F | Sax Wealth Advisors, Llc | 229.962 | 8.649 | ||||||
| 2026-02-04 | 13F | First Foundation Advisors | 131.370 | 16,36 | 4.941 | 23,47 | ||||
| 2026-02-09 | 13F | Coldstream Capital Management Inc | 14.089 | 4,53 | 530 | 10,90 | ||||
| 2026-01-26 | 13F | PDS Planning, Inc | 8.067 | 0,00 | 303 | 6,32 | ||||
| 2026-02-12 | 13F | Front Row Advisors LLC | 0 | -100,00 | 0 | -100,00 | ||||
| 2026-01-26 | 13F | BLB&B Advisors, LLC | 2.358.218 | 4,10 | 88.693 | 10,48 | ||||
| 2026-02-24 | 13F | WLTH Capital Management, LLC | 70.511 | 2.871 | ||||||
| 2026-02-06 | 13F | Envestnet Portfolio Solutions, Inc. | 28.127 | -4,93 | 1.058 | 0,86 | ||||
| 2026-02-12 | 13F | Commonwealth Equity Services, Llc | 125.979 | 1,95 | 4.738 | 118.350,00 | ||||
| 2026-01-23 | 13F | Patriot Investment Management Inc. | 17.570 | 0,00 | 661 | 6,11 | ||||
| 2026-02-10 | 13F | Avestar Capital, LLC | 31.000 | 0,00 | 1.041 | 0,00 | ||||
| 2026-02-05 | 13F | Cambridge Investment Research Advisors, Inc. | 165.504 | 12,75 | 6 | 20,00 | ||||
| 2025-11-13 | 13F | Deutsche Bank Ag\ | 0 | -100,00 | 0 | |||||
| 2025-10-15 | 13F | Sagace Wealth Management LLC | 0 | -100,00 | 0 | |||||
| 2026-01-08 | 13F | Wealth Enhancement Advisory Services, Llc | 424.510 | -2,18 | 16.492 | 5,37 | ||||
| 2026-02-13 | 13F | Pinnacle Wealth Planning Services, Inc. | 619 | 23 | ||||||
| 2026-02-12 | 13F | Proficio Capital Partners LLC | 0 | -100,00 | 0 | |||||
| 2026-01-21 | 13F | McElhenny Sheffield Capital Management, LLC | 13.271 | -27,18 | 499 | -22,64 | ||||
| 2026-02-13 | 13F | Barclays Plc | 0 | -100,00 | 0 | |||||
| 2025-11-14 | 13F | Citadel Advisors Llc | 0 | -100,00 | 0 | |||||
| 2026-02-18 | 13F | EP Wealth Advisors, Inc. | 18.304 | -30,04 | 688 | -22,61 | ||||
| 2026-02-09 | 13F | MRP Capital Investments, LLC | 200 | 0,00 | 8 | 16,67 | ||||
| 2026-02-11 | 13F | Sunrise Financial Services, LLC | 48 | 2 | ||||||
| 2026-02-06 | 13F | Forefront Wealth Partners, LLC | 0 | -100,00 | 0 | |||||
| 2026-01-14 | 13F | Camelot Technology Advisors, Inc. | 5.557 | 209 | ||||||
| 2026-01-12 | 13F | Rialto Wealth Management, LLC | 157 | 0,00 | 6 | 0,00 | ||||
| 2026-02-12 | 13F | BRYN MAWR TRUST Co | 678 | -3,14 | 26 | 4,17 | ||||
| 2025-11-06 | 13F | Lyell Wealth Management, Lp | 0 | -100,00 | 0 | |||||
| 2026-02-10 | 13F | Goldman Sachs Group Inc | 63.533 | -28,52 | 2.389 | -24,16 | ||||
| 2026-04-07 | 13F | CoreCap Advisors, LLC | 190.938 | 3,41 | 9.192 | 32,36 | ||||
| 2026-02-17 | 13F | National Asset Management, Inc. | 69.373 | 1,79 | 2.609 | 8,03 | ||||
| 2026-02-03 | 13F | D.B. Root & Company, LLC | 7.200 | 0,00 | 271 | 5,88 | ||||
| 2026-02-11 | 13F | Ackerman Capital Advisors, LLC | 116.932 | 0,69 | 4.398 | 6,85 | ||||
| 2026-02-12 | 13F | Empower Advisory Group, LLC | 17.002 | 31,35 | 639 | 39,52 | ||||
| 2026-02-11 | 13F | Cerity Partners LLC | 0 | -100,00 | 0 | |||||
| 2026-02-04 | 13F | MONECO Advisors, LLC | 35.983 | 17,60 | 1.353 | 24,82 | ||||
| 2026-02-13 | 13F | Parkside Financial Bank & Trust | 10.868 | 5,07 | 409 | 11,48 | ||||
| 2026-02-17 | 13F | Advisor Group Holdings, Inc. | 1.841 | -6,31 | 69 | 1,47 | ||||
| 2026-01-27 | 13F | Wealth Enhancement Trust Services, Inc. | 620 | 23 | ||||||
| 2026-02-17 | 13F | Jones Financial Companies Lllp | 80 | 3 | ||||||
| 2025-11-14 | 13F | Northwestern Mutual Wealth Management Co | 0 | -100,00 | 0 | |||||
| 2026-04-06 | 13F | Acima Private Wealth, Llc | 174.272 | -0,01 | 8.389 | 27,98 | ||||
| 2026-02-17 | 13F | WFA of San Diego, LLC | 0 | -100,00 | 0 | |||||
| 2026-02-13 | 13F | Global Endowment Management, LP | 151.240 | 8,55 | 5.688 | 15,21 | ||||
| 2026-02-17 | 13F | Cardiff Park Advisors, Llc | 7.072 | 0,00 | 266 | 6,00 | ||||
| 2026-01-27 | 13F | MontVue Capital Management, Inc. | 17.164 | 1,48 | 646 | 7,68 | ||||
| 2026-02-17 | 13F | Tcw Group Inc | 9.821 | 369 | ||||||
| 2026-02-17 | 13F | Blueprint Investment Partners LLC | 24.949 | 7,80 | 938 | 14,39 | ||||
| 2026-02-17 | 13F | Bank Of America Corp /de/ | 1 | |||||||
| 2026-02-18 | 13F | Caitlin John, LLC | 2.233 | 0,00 | 84 | 5,06 | ||||
| 2026-02-09 | 13F | Topel & Distasi Wealth Management, LLC | 18.455 | -7,90 | 694 | -2,25 | ||||
| 2026-04-07 | 13F | Cultivar Capital, Inc. | 180.735 | 1,87 | 8.701 | 30,40 | ||||
| 2026-02-06 | 13F | HighTower Advisors, LLC | 11.015 | -3,07 | 414 | 2,99 | ||||
| 2026-02-06 | 13F | Associated Banc-corp | 12.231 | -8,18 | 460 | -2,54 | ||||
| 2026-02-13 | 13F | Morgan Stanley | 50.184 | -4,37 | 1.887 | 1,51 | ||||
| 2026-01-07 | 13F | Boston Standard Wealth Management, LLC | 8.716 | 0,00 | 328 | 5,83 | ||||
| 2026-02-06 | 13F | IFP Advisors, Inc | 15.048 | 93.950,00 | 566 | |||||
| 2026-02-06 | 13F | Pnc Financial Services Group, Inc. | 2.399 | 0,00 | 90 | 5,88 | ||||
| 2026-02-10 | 13F | Baker Avenue Asset Management, LP | 19.160 | 2,42 | 721 | 8,60 | ||||
| 2026-02-17 | 13F | Hancock Whitney Corp | 87.782 | 0,05 | 3.301 | 6,18 | ||||
| 2026-02-06 | 13F | Nano Cap New Millennium Growth Fund L P | 4.000 | 150 | ||||||
| 2026-01-09 | 13F | Capstone Wealth Management Group LLC | 6.835 | 0,00 | 257 | 6,20 | ||||
| 2026-01-23 | 13F | Legend Financial Advisors, Inc. | 205.704 | 1,57 | 7.737 | 7,79 | ||||
| 2026-01-14 | 13F | Tradewinds Capital Management, LLC | 98 | 0,00 | 4 | 0,00 | ||||
| 2026-02-12 | 13F | Bank of Jackson Hole Trust | 0 | -100,00 | 0 |