Grundlæggende statistik
| Institutionelle ejere | 80 total, 80 long only, 0 short only, 0 long/short - change of 3,85% MRQ |
| Gennemsnitlig porteføljeallokering | 0.1369 % - change of -10,96% MRQ |
| Institutionelle aktier (lange) | 5.190.975 (ex 13D/G) - change of 0,30MM shares 6,21% MRQ |
| Institutionel værdi (lang) | $ 90.613 USD ($1000) |
Institutionelt ejerskab og aktionærer
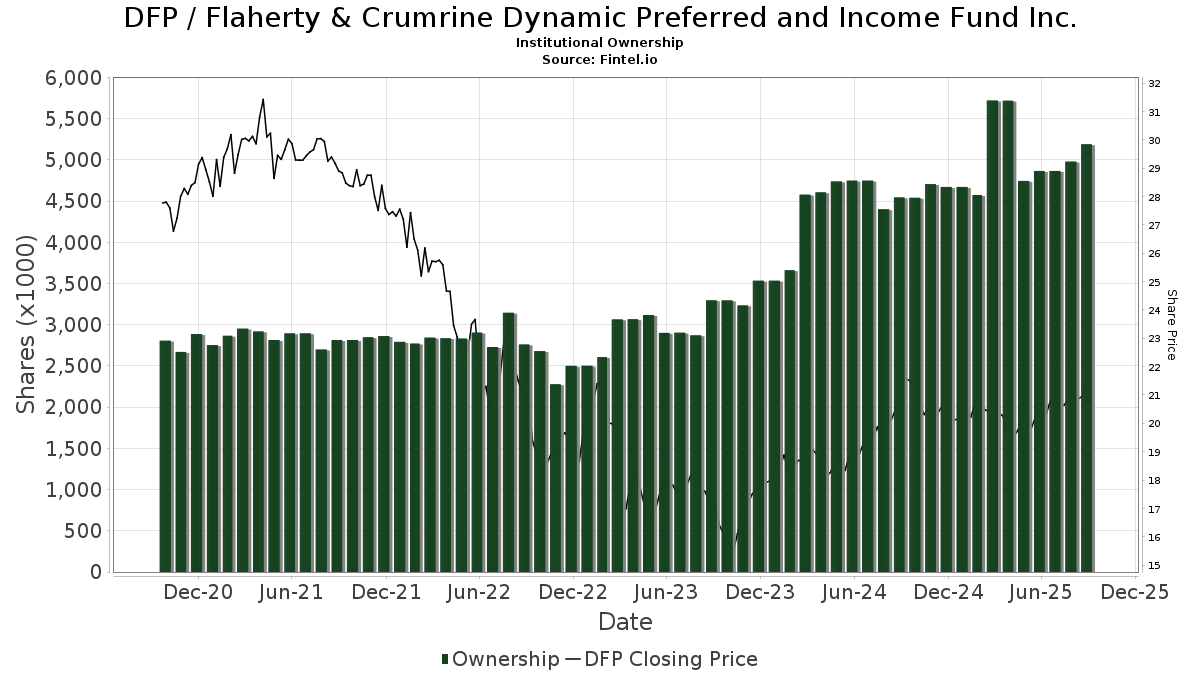
Flaherty & Crumrine Dynamic Preferred and Income Fund Inc. (US:DFP) har 80 institutionelle ejere og aktionærer, der har indsendt 13D/G- eller 13F-formularer til Securities Exchange Commission (SEC). Disse institutioner har i alt 5,190,975 aktier. Største aktionærer omfatter Raymond James Financial Inc, Cohen & Steers, Inc., Guggenheim Capital Llc, Invesco Ltd., PCEF - Invesco CEF Income Composite ETF, LPL Financial LLC, Pathstone Holdings, LLC, Wells Fargo & Company/mn, Kovitz Investment Group Partners, LLC, and Morgan Stanley .
Flaherty & Crumrine Dynamic Preferred and Income Fund Inc. (NYSE:DFP) institutionel ejerskabsstruktur viser aktuelle positioner i virksomheden efter institutioner og fonde, samt seneste ændringer i positionsstørrelse. Større aktionærer kan omfatte individuelle investorer, investeringsforeninger, hedgefonde eller institutioner. Skema 13D angiver, at investoren besidder (eller besidder) mere end 5 % af virksomheden og har til hensigt (eller har til hensigt at) aktivt at forfølge en ændring i forretningsstrategi. Skema 13G indikerer en passiv investering på over 5%.
The share price as of September 8, 2025 is 21,25 / share. Previously, on September 9, 2024, the share price was 20,76 / share. This represents an increase of 2,36% over that period.
Fondens stemningsscore
Fund Sentiment Score (fka Ownership Accumulation Score) finder de aktier, der bliver mest købt af fonde. Det er resultatet af en sofistikeret, multi-faktor kvantitativ model, der identificerer virksomheder med de højeste niveauer af institutionel akkumulering. Scoringsmodellen bruger en kombination af den samlede stigning i oplyste ejere, ændringerne i porteføljeallokeringer i disse ejere og andre målinger. Tallet går fra 0 til 100, hvor højere tal indikerer et højere niveau af akkumulering for sine jævnaldrende, og 50 er gennemsnittet.
Opdateringsfrekvens: Dagligt
Se Ownership Explorer, som giver en liste over højest rangerende virksomheder.
Institutionel Put/Call-forhold
Ud over at indberette standardaktie- og gældsudstedelser skal institutter med mere end 100 mill. aktiver under forvaltning også oplyse deres put- og call-optionsbeholdninger. Da salgsoptioner generelt indikerer negativ stemning, og købsoptioner indikerer positiv stemning, kan vi få en fornemmelse af den overordnede institutionelle stemning ved at plotte forholdet mellem put og kald. Diagrammet til højre viser det historiske put/call-forhold for dette instrument.
Brug af Put/Call Ratio som en indikator for investorernes stemning overvinder en af de vigtigste mangler ved at bruge totalt institutionelt ejerskab, som er, at en betydelig mængde af aktiver under forvaltning investeres passivt for at spore indekser. Passivt forvaltede fonde køber typisk ikke optioner, så indikatoren for put/call-forholdet følger mere nøje følelsen af aktivt forvaltede fonde.
13F og NPORT arkivering
Detaljer om 13F-arkivering er gratis. Detaljer om NP-ansøgninger kræver et premium-medlemskab. Grønne rækker angiver nye positioner. Røde rækker angiver lukkede positioner. Klik på linket ikon for at se den fulde transaktionshistorik.
Opgrader
for at låse premium-data op og eksportere til Excel ![]() .
.
| Fil dato | Kilde | Investor | Type | Gennemsnitlig pris (Øst) |
Aktier | Δ Aktier (%) |
Rapporteret Værdi ($1000) |
Δ Værdi (%) |
Port Alloc (%) |
|
|---|---|---|---|---|---|---|---|---|---|---|
| 2025-08-15 | 13F | Provenance Wealth Advisors, LLC | 0 | -100,00 | 0 | -100,00 | ||||
| 2025-08-07 | 13F | Hennion & Walsh Asset Management, Inc. | 98.723 | 66,23 | 2.027 | 68,55 | ||||
| 2025-07-15 | 13F | MCF Advisors LLC | 1.188 | 1,80 | 24 | 4,35 | ||||
| 2025-08-13 | 13F | Walleye Capital LLC | 17.503 | -13,08 | 359 | -11,79 | ||||
| 2025-08-13 | 13F | Northwestern Mutual Wealth Management Co | 1.266 | -78,04 | 26 | -78,45 | ||||
| 2025-05-16 | 13F | Coppell Advisory Solutions LLC | 0 | -100,00 | 0 | |||||
| 2025-07-25 | 13F | Concurrent Investment Advisors, LLC | 27.062 | 2,05 | 556 | 3,54 | ||||
| 2025-08-01 | 13F | Envestnet Asset Management Inc | 68.780 | 1,60 | 1.412 | 3,07 | ||||
| 2025-08-07 | 13F | Samalin Investment Counsel, LLC | 45.071 | 3,66 | 925 | 5,11 | ||||
| 2025-07-17 | 13F | Sound Income Strategies, LLC | 236 | 0,00 | 5 | 0,00 | ||||
| 2025-05-15 | 13F | Millennium Management Llc | 0 | -100,00 | 0 | -100,00 | ||||
| 2025-08-27 | NP | RYMSX - Guggenheim Multi-Hedge Strategies Fund Class P | 23 | -25,81 | 0 | |||||
| 2025-08-13 | 13F | Baird Financial Group, Inc. | 19.489 | 40,62 | 400 | 42,86 | ||||
| 2025-08-14 | 13F | Robinson Capital Management, Llc | 0 | -100,00 | 0 | |||||
| 2025-08-12 | 13F | Steward Partners Investment Advisory, Llc | 2.800 | 0,00 | 57 | 1,79 | ||||
| 2025-07-23 | 13F | Seamount Financial Group Inc | 47.703 | -6,58 | 979 | -5,23 | ||||
| 2025-08-07 | 13F | Readystate Asset Management Lp | 23.784 | 32,68 | 488 | 34,81 | ||||
| 2025-05-16 | 13F | Stance Capital Llc | 0 | -100,00 | 0 | |||||
| 2025-08-14 | 13F | Comerica Bank | 2.200 | -12,00 | 45 | -10,00 | ||||
| 2025-07-28 | 13F | Harbour Investments, Inc. | 881 | 1,73 | 18 | 5,88 | ||||
| 2025-08-12 | 13F | Virtu Financial LLC | 12.168 | 0 | ||||||
| 2025-08-11 | 13F | HighTower Advisors, LLC | 22.428 | 8,97 | 460 | 10,58 | ||||
| 2025-08-07 | 13F | Allworth Financial LP | 1.480 | 89,74 | 30 | 100,00 | ||||
| 2025-08-13 | 13F | Capital Analysts, Inc. | 32.213 | -4,09 | 1 | |||||
| 2025-08-12 | 13F | South Plains Financial, Inc. | 4.022 | 0,00 | 83 | 1,23 | ||||
| 2025-08-14 | 13F | Ameriprise Financial Inc | 154.856 | -12,70 | 3.179 | -11,45 | ||||
| 2025-08-05 | 13F | Palogic Value Management, L.P. | 20.500 | 0,00 | 421 | 1,45 | ||||
| 2025-08-28 | NP | Cohen & Steers Closed-end Opportunity Fund, Inc. | 114.827 | 4,55 | 2.357 | 6,08 | ||||
| 2025-07-28 | 13F | Private Wealth Asset Management, LLC | 0 | -100,00 | 0 | |||||
| 2025-08-14 | 13F | GWM Advisors LLC | 35.820 | 3,01 | 735 | 4,55 | ||||
| 2025-07-15 | 13F | North Star Investment Management Corp. | 2.200 | 0,00 | 45 | 2,27 | ||||
| 2025-08-06 | 13F | Wedbush Securities Inc | 10.600 | -22,06 | 0 | |||||
| 2025-05-19 | 13F | Smith Asset Management Co., LLC | 98.096 | 3,24 | 1.985 | 4,80 | ||||
| 2025-08-14 | 13F | Fmr Llc | 400 | -89,30 | 8 | -89,33 | ||||
| 2025-08-27 | NP | RYDEX VARIABLE TRUST - Multi-Hedge Strategies Fund Variable Annuity | 40 | -2,44 | 1 | |||||
| 2025-08-08 | 13F | 1776 Wealth LLC | 60.199 | -1,55 | 1.236 | -0,16 | ||||
| 2025-08-12 | 13F | Walled Lake Planning & Wealth Management, Llc | 10.950 | 0,00 | 225 | 1,36 | ||||
| 2025-08-14 | 13F | Royal Bank Of Canada | 28.809 | 8,88 | 591 | 10,26 | ||||
| 2025-08-12 | 13F | Proequities, Inc. | 0 | 0 | ||||||
| 2025-07-22 | 13F | Merit Financial Group, LLC | 23.377 | 5,69 | 480 | 7,16 | ||||
| 2025-08-13 | 13F | Cary Street Partners Financial Llc | 24.951 | -2,73 | 512 | -1,35 | ||||
| 2025-08-04 | 13F | Wolverine Asset Management Llc | 29.097 | 464,11 | 597 | 474,04 | ||||
| 2025-08-06 | 13F | Golden State Wealth Management, LLC | 4.064 | 1,70 | 83 | 3,75 | ||||
| 2025-05-09 | 13F | CoreCap Advisors, LLC | 0 | -100,00 | 0 | |||||
| 2025-08-08 | 13F | Pnc Financial Services Group, Inc. | 5.445 | 0,00 | 112 | 0,91 | ||||
| 2025-08-15 | 13F | Morgan Stanley | 159.907 | 1,99 | 3.283 | 3,44 | ||||
| 2025-08-12 | 13F | J.w. Cole Advisors, Inc. | 10.936 | 225 | ||||||
| 2025-07-31 | 13F | Cambridge Investment Research Advisors, Inc. | 89.517 | 3,79 | 2 | 0,00 | ||||
| 2025-08-08 | 13F | Cetera Investment Advisers | 22.151 | 6,74 | 455 | 8,10 | ||||
| 2025-07-21 | 13F | Catalina Capital Group, LLC | 13.946 | 286 | ||||||
| 2025-08-14 | 13F | Sit Investment Associates Inc | 54.393 | 42,61 | 1 | |||||
| 2025-05-15 | 13F | Rivernorth Capital Management, Llc | 0 | -100,00 | 0 | |||||
| 2025-08-14 | 13F | Raymond James Financial Inc | 1.083.013 | 9,31 | 22.234 | 10,88 | ||||
| 2025-08-14 | 13F | Bank Of America Corp /de/ | 17.748 | -4,35 | 364 | -2,93 | ||||
| 2025-08-13 | 13F | Invesco Ltd. | 310.380 | 3,11 | 6.372 | 4,60 | ||||
| 2025-08-13 | 13F | Cerity Partners LLC | 14.300 | -13,59 | 294 | -12,28 | ||||
| 2025-08-19 | 13F | Newbridge Financial Services Group, Inc. | 500 | 10 | ||||||
| 2025-07-07 | 13F | Investors Research Corp | 0 | -100,00 | 0 | |||||
| 2025-08-11 | 13F | Principal Securities, Inc. | 36.350 | 5,43 | 746 | 8,59 | ||||
| 2025-07-31 | 13F | Whipplewood Advisors, LLC | 93.985 | 2.791,85 | 1.930 | -32,36 | ||||
| 2025-07-28 | NP | PCEF - Invesco CEF Income Composite ETF This fund is a listed as child fund of Invesco Ltd. and if that institution has disclosed ownership in this security, then these positions will not be double counted when calculating total shares and total value | 284.525 | -1,06 | 5.693 | -2,95 | ||||
| 2025-09-04 | 13F/A | Advisor Group Holdings, Inc. | 49.986 | 13,14 | 1.026 | 14,77 | ||||
| 2025-08-12 | 13F | AlphaCore Capital LLC | 39.483 | 13,94 | 811 | 15,55 | ||||
| 2025-08-13 | 13F | Level Four Advisory Services, Llc | 9.750 | 200 | ||||||
| 2025-05-12 | 13F | Independent Advisor Alliance | 0 | -100,00 | 0 | |||||
| 2025-05-16 | 13F | Jones Financial Companies Lllp | 0 | -100,00 | 0 | |||||
| 2025-07-15 | 13F | Revisor Wealth Management LLC | 66.129 | -0,84 | 1.381 | 2,30 | ||||
| 2025-08-14 | 13F | Wiley Bros.-aintree Capital, Llc | 30.279 | 622 | ||||||
| 2025-05-23 | NP | RBNAX - Robinson Opportunistic Income Fund Class A Shares | 17.400 | 0,00 | 352 | 1,73 | ||||
| 2025-07-25 | 13F | Atria Wealth Solutions, Inc. | 0 | -100,00 | 0 | |||||
| 2025-07-14 | 13F | AdvisorNet Financial, Inc | 4.250 | 87 | ||||||
| 2025-07-17 | 13F | Janney Montgomery Scott LLC | 23.233 | -3,02 | 0 | |||||
| 2025-08-06 | 13F | Commonwealth Equity Services, Llc | 58.032 | -0,05 | 1 | 0,00 | ||||
| 2025-07-07 | 13F | Thurston, Springer, Miller, Herd & Titak, Inc. | 7.877 | 1,14 | 162 | 2,55 | ||||
| 2025-08-05 | 13F | Huntington National Bank | 49 | 2,08 | ||||||
| 2025-08-05 | 13F | Shaker Financial Services, LLC | 130.860 | 77,14 | 2.687 | 79,67 | ||||
| 2025-07-11 | 13F | Farther Finance Advisors, LLC | 2.545 | 0,16 | 52 | 1,96 | ||||
| 2025-08-12 | 13F | LPL Financial LLC | 267.453 | -5,17 | 5.491 | -3,82 | ||||
| 2025-08-14 | 13F | Mangrove Partners | 0 | -100,00 | 0 | |||||
| 2025-08-14 | 13F | Wells Fargo & Company/mn | 188.111 | -17,68 | 3.862 | -16,52 | ||||
| 2025-08-11 | 13F | Private Advisor Group, LLC | 36.712 | -1,41 | 754 | 0,00 | ||||
| 2025-08-18 | 13F | Geneos Wealth Management Inc. | 855 | 0,00 | 18 | 0,00 | ||||
| 2025-07-08 | 13F | Strategic Advocates LLC | 43.960 | 8,37 | 902 | 9,87 | ||||
| 2025-08-04 | 13F | MeadowBrook Investment Advisors LLC | 0 | -100,00 | 0 | |||||
| 2025-08-13 | 13F | Guggenheim Capital Llc | 345.568 | 10,79 | 7.095 | 12,37 | ||||
| 2025-07-09 | 13F | Fiduciary Alliance LLC | 10.350 | 0,00 | 212 | 1,44 | ||||
| 2025-07-25 | 13F | Cwm, Llc | 2.152 | 0,00 | 0 | |||||
| 2025-08-29 | 13F | Centaurus Financial, Inc. | 16.483 | -17,18 | 0 | |||||
| 2025-04-23 | 13F | Bessemer Group Inc | 0 | -100,00 | 0 | |||||
| 2025-07-23 | 13F | Abel Hall, LLC | 10.500 | 216 | ||||||
| 2025-08-11 | 13F | Elequin Capital Lp | 36 | 1 | ||||||
| 2025-08-14 | 13F | Kovitz Investment Group Partners, LLC | 161.099 | -11,05 | 3.307 | -9,77 | ||||
| 2025-08-14 | 13F | Cohen & Steers, Inc. | 461.489 | 1,10 | 9 | 0,00 | ||||
| 2025-08-14 | 13F | UBS Group AG | 8.843 | 8,88 | 182 | 10,37 | ||||
| 2025-08-05 | 13F | Westside Investment Management, Inc. | 1.667 | 0,00 | 34 | 3,03 | ||||
| 2025-08-12 | 13F | Pathstone Holdings, LLC | 219.996 | -2,89 | 4.517 | -2,27 | ||||
| 2025-08-05 | 13F | Mathes Company, Inc. | 15.500 | 0,00 | 0 |