Grundlæggende statistik
| Institutionelle ejere | 206 total, 206 long only, 0 short only, 0 long/short - change of 1,97% MRQ |
| Gennemsnitlig porteføljeallokering | 0.1094 % - change of 0,49% MRQ |
| Institutionelle aktier (lange) | 36.597.044 (ex 13D/G) - change of 0,89MM shares 2,49% MRQ |
| Institutionel værdi (lang) | $ 654.818 USD ($1000) |
Institutionelt ejerskab og aktionærer
Calamos Strategic Total Return Fund (US:CSQ) har 206 institutionelle ejere og aktionærer, der har indsendt 13D/G- eller 13F-formularer til Securities Exchange Commission (SEC). Disse institutioner har i alt 36,597,044 aktier. Største aktionærer omfatter Bank Of America Corp /de/, Morgan Stanley, UBS Group AG, Wells Fargo & Company/mn, Royal Bank Of Canada, Raymond James Financial Inc, Cornerstone Advisors, LLC, LPL Financial LLC, Bensler, LLC, and Cornerstone Strategic Value Fund Inc .
Calamos Strategic Total Return Fund (NasdaqGS:CSQ) institutionel ejerskabsstruktur viser aktuelle positioner i virksomheden efter institutioner og fonde, samt seneste ændringer i positionsstørrelse. Større aktionærer kan omfatte individuelle investorer, investeringsforeninger, hedgefonde eller institutioner. Skema 13D angiver, at investoren besidder (eller besidder) mere end 5 % af virksomheden og har til hensigt (eller har til hensigt at) aktivt at forfølge en ændring i forretningsstrategi. Skema 13G indikerer en passiv investering på over 5%.
The share price as of September 8, 2025 is 18,76 / share. Previously, on September 9, 2024, the share price was 16,44 / share. This represents an increase of 14,11% over that period.

Fondens stemningsscore
Fund Sentiment Score (fka Ownership Accumulation Score) finder de aktier, der bliver mest købt af fonde. Det er resultatet af en sofistikeret, multi-faktor kvantitativ model, der identificerer virksomheder med de højeste niveauer af institutionel akkumulering. Scoringsmodellen bruger en kombination af den samlede stigning i oplyste ejere, ændringerne i porteføljeallokeringer i disse ejere og andre målinger. Tallet går fra 0 til 100, hvor højere tal indikerer et højere niveau af akkumulering for sine jævnaldrende, og 50 er gennemsnittet.
Opdateringsfrekvens: Dagligt
Se Ownership Explorer, som giver en liste over højest rangerende virksomheder.
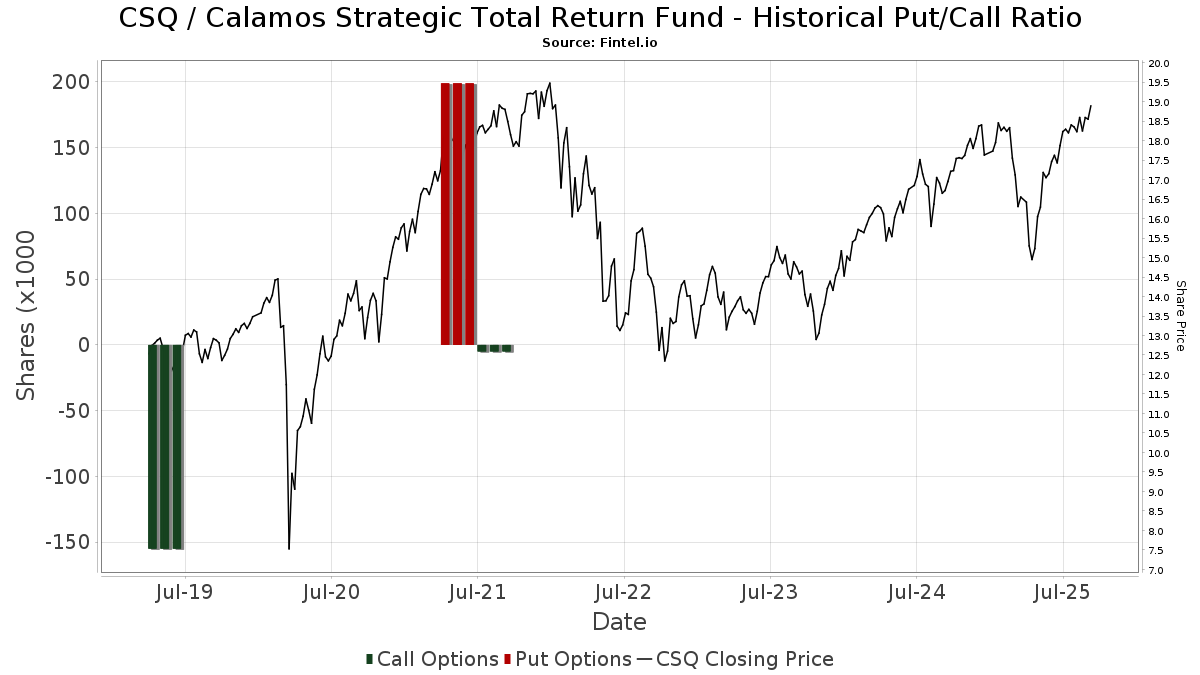
Institutionel Put/Call-forhold
Ud over at indberette standardaktie- og gældsudstedelser skal institutter med mere end 100 mill. aktiver under forvaltning også oplyse deres put- og call-optionsbeholdninger. Da salgsoptioner generelt indikerer negativ stemning, og købsoptioner indikerer positiv stemning, kan vi få en fornemmelse af den overordnede institutionelle stemning ved at plotte forholdet mellem put og kald. Diagrammet til højre viser det historiske put/call-forhold for dette instrument.
Brug af Put/Call Ratio som en indikator for investorernes stemning overvinder en af de vigtigste mangler ved at bruge totalt institutionelt ejerskab, som er, at en betydelig mængde af aktiver under forvaltning investeres passivt for at spore indekser. Passivt forvaltede fonde køber typisk ikke optioner, så indikatoren for put/call-forholdet følger mere nøje følelsen af aktivt forvaltede fonde.
13D/G-arkivering
Vi præsenterer 13D/G ansøgninger separat fra 13F ansøgninger på grund af den forskellige behandling af SEC. 13D/G-ansøgninger kan indgives af grupper af investorer (med én ledende), hvorimod 13F-ansøgninger ikke kan. Dette resulterer i situationer, hvor en investor kan indsende en 13D/G, der rapporterer én værdi for de samlede aktier (der repræsenterer alle de aktier, der ejes af investorgruppen), men derefter indsender en 13F, der rapporterer en anden værdi for de samlede aktier (der udelukkende repræsenterer deres egne) ejendomsret). Det betyder, at aktieejerskab af 13D/G-arkiver og 13F-arkiveringer ofte ikke er direkte sammenlignelige, så vi præsenterer dem separat.
Bemærk: Fra den 16. maj 2021 viser vi ikke længere ejere, der ikke har indsendt en 13D/G inden for det seneste år. Tidligere viste vi den fulde historie af 13D/G-arkiver. Generelt skal enheder, der er forpligtet til at indgive 13D/G-ansøgninger, indgive mindst årligt, før de indsender en afsluttende ansøgning. Dog forlader fonde nogle gange positioner uden at indsende en afsluttende ansøgning (dvs. de afvikler), så visning af den fulde historie resulterede nogle gange i forvirring om det nuværende ejerskab. For at undgå forvirring viser vi nu kun 'aktuelle' ejere - det vil sige - ejere, der har anmeldt inden for det seneste år.
Upgrade to unlock premium data.
| Fil dato | Form | Investor | Forrige Aktier |
Seneste Aktier |
Δ Aktier (Procent) |
Ejendomsret (Procent) |
Δ Ejerskab (Procent) |
|
|---|---|---|---|---|---|---|---|---|
| 2024-11-14 | Apollo Management Holdings GP, LLC | 1,920,000 | 1,920,000 | 0.00 | 48.00 | 0.00 | ||
| 2024-11-08 | MetLife Investment Management, LLC | 320,000 | 1,800,000 | 462.50 | 55.56 | 594.50 | ||
| 2024-08-30 | NORTHWESTERN MUTUAL LIFE INSURANCE CO | 1,200,000 | 37.50 |
13F og NPORT arkivering
Detaljer om 13F-arkivering er gratis. Detaljer om NP-ansøgninger kræver et premium-medlemskab. Grønne rækker angiver nye positioner. Røde rækker angiver lukkede positioner. Klik på linket ikon for at se den fulde transaktionshistorik.
Opgrader
for at låse premium-data op og eksportere til Excel ![]() .
.
| Fil dato | Kilde | Investor | Type | Gennemsnitlig pris (Øst) |
Aktier | Δ Aktier (%) |
Rapporteret Værdi ($1000) |
Δ Værdi (%) |
Port Alloc (%) |
|
|---|---|---|---|---|---|---|---|---|---|---|
| 2025-08-14 | 13F | Wells Fargo & Company/mn | 3.289.521 | 2,04 | 60.001 | 15,03 | ||||
| 2025-07-08 | 13F | Arlington Trust Co LLC | 2.128 | 39 | ||||||
| 2025-08-11 | 13F | Western Wealth Management, LLC | 12.463 | 0,00 | 227 | 12,94 | ||||
| 2025-08-12 | 13F | Proequities, Inc. | 0 | 0 | ||||||
| 2025-08-06 | 13F | Smh Capital Advisors Inc | 14.922 | -1,39 | 272 | 11,48 | ||||
| 2025-07-18 | 13F | First Pacific Financial | 1.100 | 20 | ||||||
| 2025-08-06 | 13F | Golden State Wealth Management, LLC | 6 | 0,00 | 0 | |||||
| 2025-08-12 | 13F | Advisors Asset Management, Inc. | 530.147 | 4,49 | 9.670 | 17,80 | ||||
| 2025-08-13 | 13F | Dana Investment Advisors, Inc. | 19.404 | 9,85 | 354 | 23,86 | ||||
| 2025-08-14 | 13F/A | Rockefeller Capital Management L.P. | 604.464 | 43,20 | 11.025 | 61,42 | ||||
| 2025-04-24 | 13F | Decker Retirement Planning Inc. | 0 | -100,00 | 0 | |||||
| 2025-07-21 | 13F | Future Financial Wealth Managment LLC | 1.100 | 0,00 | 20 | 17,65 | ||||
| 2025-08-12 | 13F | Steward Partners Investment Advisory, Llc | 145.072 | -2,76 | 2.646 | 9,66 | ||||
| 2025-08-12 | 13F | Pathstone Holdings, LLC | 30.885 | 0,00 | 563 | 12,83 | ||||
| 2025-08-13 | 13F | WCG Wealth Advisors LLC | 27.888 | 63,99 | 509 | 84,73 | ||||
| 2025-07-15 | 13F | Bay Capital Advisors, LLC | 18.379 | -19,32 | 335 | -8,97 | ||||
| 2025-07-24 | 13F | IFP Advisors, Inc | 8.273 | 0,00 | 151 | 12,78 | ||||
| 2025-08-18 | 13F | Geneos Wealth Management Inc. | 1.110 | 0,00 | 20 | 17,65 | ||||
| 2025-08-14 | 13F | Polar Asset Management Partners Inc. | 372.587 | 204,58 | 6.796 | 243,36 | ||||
| 2025-08-13 | 13F | Beacon Pointe Advisors, LLC | 10.329 | 1,66 | 188 | 14,63 | ||||
| 2025-08-08 | 13F | Pnc Financial Services Group, Inc. | 32.155 | 0,00 | 587 | 12,69 | ||||
| 2025-08-04 | 13F | Mesirow Financial Investment Management, Inc. | 52.296 | 0,08 | 954 | 12,78 | ||||
| 2025-08-05 | 13F | Key FInancial Inc | 250 | 0,00 | 5 | 0,00 | ||||
| 2025-07-29 | 13F | Fundamentun, Llc | 13.676 | 23,43 | 249 | 39,11 | ||||
| 2025-08-14 | 13F | Susquehanna International Group, Llp | 32.479 | 36,07 | 592 | 53,37 | ||||
| 2025-07-24 | 13F | Eastern Bank | 3.060 | 0,00 | 56 | 12,24 | ||||
| 2025-08-18 | 13F | N.E.W. Advisory Services LLC | 2.200 | -37,62 | 40 | -29,82 | ||||
| 2025-08-11 | 13F | Principal Securities, Inc. | 0 | -100,00 | 0 | |||||
| 2025-08-11 | 13F | Private Advisor Group, LLC | 72.393 | 5,98 | 1.320 | 19,46 | ||||
| 2025-07-29 | 13F | Chicago Partners Investment Group LLC | 12.236 | 0,91 | 225 | 14,21 | ||||
| 2025-08-14 | 13F | Jane Street Group, Llc | 17.089 | 30,08 | 312 | 46,70 | ||||
| 2025-05-19 | 13F | Smith Asset Management Co., LLC | 229.965 | 0,43 | 3.721 | -8,26 | ||||
| 2025-08-22 | NP | Cornerstone Total Return Fund Inc | 479.810 | 17,37 | 8.752 | 32,31 | ||||
| 2025-08-13 | 13F | EverSource Wealth Advisors, LLC | 18.644 | 0,12 | 340 | 12,96 | ||||
| 2025-07-28 | 13F | Fairman Group, LLC | 33.051 | 0,00 | 603 | 2,38 | ||||
| 2025-07-25 | 13F | Atria Wealth Solutions, Inc. | 12.174 | -70,22 | 222 | -66,41 | ||||
| 2025-08-14 | 13F | IHT Wealth Management, LLC | 11.551 | -8,35 | 211 | 3,45 | ||||
| 2025-04-22 | 13F | Castleview Partners, Llc | 0 | -100,00 | 0 | |||||
| 2025-08-11 | 13F | Mosaic Family Wealth Partners, Llc | 19.850 | 1,03 | 362 | 14,20 | ||||
| 2025-07-22 | 13F | Wealthcare Advisory Partners LLC | 26.952 | 11,40 | 492 | 25,58 | ||||
| 2025-08-12 | 13F | NWF Advisory Services Inc. | 40.134 | 649 | ||||||
| 2025-08-19 | 13F | Newbridge Financial Services Group, Inc. | 11.728 | 214 | ||||||
| 2025-08-07 | 13F | Allworth Financial LP | 6.235 | 13,38 | 114 | 31,40 | ||||
| 2025-08-04 | 13F | ELCO Management Co., LLC | 22.124 | -0,45 | 404 | 12,26 | ||||
| 2025-04-22 | 13F | Jmac Enterprises Llc | 0 | -100,00 | 0 | |||||
| 2025-08-05 | 13F | GHP Investment Advisors, Inc. | 3.400 | 62 | ||||||
| 2025-08-14 | 13F | UBS Group AG | 3.954.039 | -4,19 | 72.122 | 8,01 | ||||
| 2025-08-01 | 13F | Boyd Watterson Asset Management Llc/oh | 500 | 0,00 | 9 | 12,50 | ||||
| 2025-07-22 | 13F | DAVENPORT & Co LLC | 206.728 | -3,99 | 3.771 | 8,24 | ||||
| 2025-08-05 | 13F | Dunhill Financial, LLC | 2.428 | 44 | ||||||
| 2025-08-13 | 13F | Baird Financial Group, Inc. | 22.138 | -17,88 | 404 | -7,57 | ||||
| 2025-05-05 | 13F | Lindbrook Capital, Llc | 1.848 | 0,00 | 30 | -9,37 | ||||
| 2025-07-14 | 13F | Armstrong Advisory Group, Inc | 805 | 15 | ||||||
| 2025-08-12 | 13F | Fairscale Capital, LLC | 500 | 0,00 | 9 | 12,50 | ||||
| 2025-07-29 | 13F | Mezzasalma Advisors, LLC | 26.699 | 1,14 | 487 | 13,82 | ||||
| 2025-07-29 | 13F | International Assets Investment Management, Llc | 15.066 | 0,00 | 275 | 12,76 | ||||
| 2025-04-09 | 13F | Capital CS Group, LLC | 0 | -100,00 | 0 | |||||
| 2025-08-11 | 13F | Aptus Capital Advisors, LLC | 23.381 | 0,24 | 426 | 13,00 | ||||
| 2025-08-12 | 13F | SRS Capital Advisors, Inc. | 184 | 0,00 | 3 | 50,00 | ||||
| 2025-08-05 | 13F | Aviance Capital Partners, LLC | 97.262 | -2,22 | 1.774 | 10,25 | ||||
| 2025-08-11 | 13F | Rothschild Investment Llc | 5.000 | 0,00 | 91 | 13,75 | ||||
| 2025-07-18 | 13F | SOA Wealth Advisors, LLC. | 173 | 1,76 | 3 | 50,00 | ||||
| 2025-08-06 | 13F | Bensler, LLC | 994.476 | 0,17 | 18.139 | 12,93 | ||||
| 2025-07-11 | 13F | Farther Finance Advisors, LLC | 3.869 | 78,38 | 71 | 100,00 | ||||
| 2025-05-14 | 13F | Landscape Capital Management, L.l.c. | 0 | -100,00 | 0 | |||||
| 2025-07-21 | 13F | Ameritas Advisory Services, LLC | 10.001 | 0,00 | 182 | 2,82 | ||||
| 2025-07-17 | 13F | San Luis Wealth Advisors LLC | 18.649 | -7,18 | 0 | |||||
| 2025-08-06 | 13F | Savant Capital, LLC | 134.743 | -0,11 | 2.458 | 12,60 | ||||
| 2025-08-12 | 13F | LPL Financial LLC | 1.078.841 | 1,80 | 19.678 | 14,76 | ||||
| 2025-07-15 | 13F | North Star Investment Management Corp. | 400 | 0,00 | 7 | 16,67 | ||||
| 2025-08-11 | 13F | Delta Asset Management Llc/tn | 5.105 | 0,00 | 93 | 13,41 | ||||
| 2025-08-05 | 13F | Uniting Wealth Partners, LLC | 25.424 | -8,91 | 464 | 2,66 | ||||
| 2025-08-13 | 13F | Summit Financial, LLC | 22.808 | 416 | ||||||
| 2025-08-05 | 13F | Lifeworks Advisors, LLC | 15.956 | -46,13 | 291 | -39,25 | ||||
| 2025-08-15 | 13F | Captrust Financial Advisors | 81.223 | 3,86 | 1.482 | 17,08 | ||||
| 2025-04-21 | 13F | Nelson, Van Denburg & Campbell Wealth Management Group, LLC | 0 | -100,00 | 0 | -100,00 | ||||
| 2025-07-07 | 13F | Nova Wealth Management, Inc. | 5.893 | 0,00 | 107 | 12,63 | ||||
| 2025-08-12 | 13F | J.w. Cole Advisors, Inc. | 125.008 | -0,67 | 2.280 | 11,98 | ||||
| 2025-08-15 | 13F | Morgan Stanley | 4.205.936 | -0,17 | 76.716 | 12,54 | ||||
| 2025-08-25 | 13F | Silverlake Wealth Management Llc | 15.698 | 2,85 | 286 | 16,26 | ||||
| 2025-08-14 | 13F | Integrated Wealth Concepts LLC | 27.621 | 1,29 | 504 | 14,06 | ||||
| 2025-08-15 | 13F | Tower Research Capital LLC (TRC) | 24 | 1.100,00 | 0 | |||||
| 2025-08-25 | 13F/A | Kovitz Investment Group Partners, LLC | 0 | -100,00 | 0 | |||||
| 2025-08-05 | 13F | Shaker Financial Services, LLC | 394.767 | 9,20 | 7.201 | 23,12 | ||||
| 2025-08-14 | 13F | Karpus Management, Inc. | 55.333 | 3,73 | 1.009 | 16,92 | ||||
| 2025-07-17 | 13F | Janney Montgomery Scott LLC | 189.213 | -0,22 | 3 | 0,00 | ||||
| 2025-08-11 | 13F | Elequin Capital Lp | 20.704 | 378 | ||||||
| 2025-07-10 | 13F | Wealth Enhancement Advisory Services, Llc | 22.707 | 9,00 | 419 | 24,04 | ||||
| 2025-08-08 | 13F | Cetera Investment Advisers | 685.328 | -0,14 | 12.500 | 12,57 | ||||
| 2025-08-12 | 13F | Calton & Associates, Inc. | 15.923 | 31,36 | 290 | 47,96 | ||||
| 2025-09-04 | 13F/A | Advisor Group Holdings, Inc. | 280.507 | -5,68 | 5.117 | 6,32 | ||||
| 2025-08-08 | 13F | Fortis Group Advisors, LLC | 1.000 | 0,00 | 18 | 12,50 | ||||
| 2025-08-13 | 13F | Transce3nd, LLC | 707 | 0,00 | 13 | 9,09 | ||||
| 2025-07-14 | 13F | AdvisorNet Financial, Inc | 1.600 | 0,00 | 29 | 16,00 | ||||
| 2025-08-05 | 13F | Huntington National Bank | 132 | -23,39 | ||||||
| 2025-08-06 | 13F | Mark Sheptoff Financial Planning, Llc | 436 | -50,00 | 8 | -50,00 | ||||
| 2025-07-17 | 13F | XML Financial, LLC | 24.078 | -3,41 | 439 | 8,93 | ||||
| 2025-07-18 | 13F | Institute for Wealth Management, LLC. | 16.602 | -2,43 | 303 | 9,82 | ||||
| 2025-08-08 | 13F | Creative Planning | 10.250 | 187 | ||||||
| 2025-08-14 | 13F | Raymond James Financial Inc | 1.995.245 | 3,51 | 36.393 | 16,69 | ||||
| 2025-07-29 | 13F | Stephens Inc /ar/ | 16.866 | -2,28 | 308 | 10,04 | ||||
| 2025-08-13 | 13F | Smith, Moore & Co. | 19.150 | -3,53 | 349 | 8,72 | ||||
| 2025-08-14 | 13F | Beaird Harris Wealth Management, LLC | 325 | 0,00 | 6 | 0,00 | ||||
| 2025-08-14 | 13F | Modern Wealth Management, LLC | 18.300 | -2,49 | 334 | 9,90 | ||||
| 2025-08-04 | 13F | Live Oak Private Wealth LLC | 16.179 | 0,00 | 295 | 13,03 | ||||
| 2025-07-24 | 13F | Us Bancorp \de\ | 9.586 | 0,00 | 175 | 12,26 | ||||
| 2025-08-14 | 13F | Mariner, LLC | 106.036 | 1,83 | 1.934 | 14,85 | ||||
| 2025-08-12 | 13F | Meridian Wealth Advisors, LLC | 97.722 | 0,00 | 1.782 | 12,71 | ||||
| 2025-07-31 | 13F | Cambridge Investment Research Advisors, Inc. | 153.564 | -13,15 | 3 | 0,00 | ||||
| 2025-07-14 | 13F | U.S. Capital Wealth Advisors, LLC | 59.964 | -0,32 | 1.094 | 12,33 | ||||
| 2025-08-07 | 13F | CENTRAL TRUST Co | 84.515 | -5,82 | 1.542 | 6,20 | ||||
| 2025-07-23 | 13F | Litman Gregory Asset Management LLC | 22.500 | 0,00 | 410 | 12,64 | ||||
| 2025-07-24 | 13F | Game Plan Financial Advisors, LLC | 20.000 | 0,00 | 365 | 12,69 | ||||
| 2025-08-14 | 13F | LaSalle St. Investment Advisors, LLC | 11.549 | 0,61 | 0 | |||||
| 2025-08-14 | 13F | Colony Group, LLC | 44.660 | 815 | ||||||
| 2025-07-29 | 13F | Calamos Wealth Management LLC | 85.160 | 0,00 | 1.553 | 12,78 | ||||
| 2025-08-15 | 13F | Kestra Advisory Services, LLC | 57.224 | 0,10 | 1.044 | 12,88 | ||||
| 2025-08-11 | 13F | HighTower Advisors, LLC | 118.806 | -15,64 | 2.167 | -4,87 | ||||
| 2025-08-06 | 13F | Founders Financial Securities Llc | 111.305 | 15,07 | 2.030 | 32,59 | ||||
| 2025-08-13 | 13F | Guggenheim Capital Llc | 434.485 | 2,03 | 7.925 | 15,04 | ||||
| 2025-08-14 | 13F | Royal Bank Of Canada | 2.000.211 | 2,36 | 36.484 | 15,40 | ||||
| 2025-08-12 | 13F | Coldstream Capital Management Inc | 0 | -100,00 | 0 | |||||
| 2025-08-19 | 13F | National Asset Management, Inc. | 0 | -100,00 | 0 | |||||
| 2025-07-28 | 13F | Harbour Investments, Inc. | 54.119 | -5,54 | 987 | 6,59 | ||||
| 2025-08-13 | 13F | Continuum Advisory, LLC | 0 | -100,00 | 0 | |||||
| 2025-07-25 | 13F | Apollon Wealth Management, LLC | 409.908 | -0,77 | 7.477 | 11,87 | ||||
| 2025-08-07 | 13F | Cascade Financial Partners, LLC | 18.723 | 0,00 | 342 | 12,91 | ||||
| 2025-08-14 | 13F | Atomi Financial Group, Inc. | 0 | -100,00 | 0 | |||||
| 2025-08-13 | 13F | McGowan Group Asset Management, Inc. | 782.813 | 3,89 | 14.279 | 17,12 | ||||
| 2025-08-29 | 13F | Evolution Wealth Management Inc. | 2.206 | 40 | ||||||
| 2025-07-25 | 13F | Kellett Schaffner Wealth Advisors LLC | 13.477 | 0,00 | 246 | 12,39 | ||||
| 2025-08-13 | 13F | Invesco Ltd. | 107.541 | 8,29 | 1.962 | 22,10 | ||||
| 2025-07-09 | 13F | Dynamic Advisor Solutions LLC | 17.120 | 2,23 | 312 | 15,56 | ||||
| 2025-07-22 | 13F | Private Wealth Group, LLC | 11.404 | 0,00 | 208 | 13,04 | ||||
| 2025-07-01 | 13F | Legacy Wealth Management, LLC / MS | 0 | -100,00 | 0 | |||||
| 2025-08-22 | NP | Cornerstone Strategic Value Fund Inc | 958.325 | 9,97 | 17.480 | 23,96 | ||||
| 2025-08-12 | 13F | MAI Capital Management | 4.977 | -9,13 | 91 | 2,27 | ||||
| 2025-08-14 | 13F | Arete Wealth Advisors, LLC | 34.356 | 0,29 | 1 | |||||
| 2025-08-14 | 13F | Stifel Financial Corp | 382.804 | 36,69 | 6.982 | 54,09 | ||||
| 2025-08-13 | 13F | WealthTrust Axiom LLC | 23.813 | -2,86 | 434 | 9,60 | ||||
| 2025-08-13 | 13F | Cresset Asset Management, LLC | 20.743 | -1,40 | 378 | 11,18 | ||||
| 2025-08-04 | 13F | Assetmark, Inc | 991 | 466,29 | 18 | 800,00 | ||||
| 2025-08-08 | 13F | Good Life Advisors, LLC | 41.287 | 257,93 | 753 | 304,84 | ||||
| 2025-08-06 | 13F | Commonwealth Equity Services, Llc | 192.437 | 4,77 | 4 | 50,00 | ||||
| 2025-08-14 | 13F | Fwl Investment Management, Llc | 115 | 0,00 | 2 | 100,00 | ||||
| 2025-08-14 | 13F | MGB Wealth Management, LLC | 0 | -100,00 | 0 | |||||
| 2025-08-12 | 13F | Global Retirement Partners, LLC | 6.873 | -30,54 | 125 | -28,57 | ||||
| 2025-07-11 | 13F | Quad-Cities Investment Group, LLC | 32.919 | -0,38 | 600 | 12,36 | ||||
| 2025-08-13 | 13F | Russell Investments Group, Ltd. | 0 | 0 | ||||||
| 2025-08-07 | 13F | Readystate Asset Management Lp | 109.462 | 199,53 | 1.997 | 237,73 | ||||
| 2025-08-13 | 13F | M&t Bank Corp | 45.000 | 0,00 | 821 | 12,64 | ||||
| 2025-04-01 | 13F | Massmutual Trust Co Fsb/adv | 0 | -100,00 | 0 | |||||
| 2025-08-14 | 13F | Warren Averett Asset Management, LLC | 43.643 | -0,37 | 796 | 12,43 | ||||
| 2025-08-14 | 13F | Citadel Advisors Llc | 22.658 | 413 | ||||||
| 2025-08-14 | 13F | EP Wealth Advisors, Inc. | 19.148 | -39,25 | 349 | -31,43 | ||||
| 2025-08-14 | 13F | Guardian Wealth Advisors, Llc / Nc | 23.381 | 0,24 | 426 | 13,00 | ||||
| 2025-07-21 | 13F | Compass Planning Associates Inc | 17.898 | 0,00 | 326 | 12,80 | ||||
| 2025-07-29 | 13F | Salomon & Ludwin, LLC | 686 | 0,00 | 13 | 9,09 | ||||
| 2025-08-05 | 13F | Palogic Value Management, L.P. | 38.800 | 0,00 | 708 | 12,76 | ||||
| 2025-07-11 | 13F | Lantz Financial LLC | 12.000 | -16,67 | 219 | -6,03 | ||||
| 2025-05-15 | 13F | CAPROCK Group, Inc. | 20.282 | 0,00 | 328 | -9,14 | ||||
| 2025-08-07 | 13F | Kestra Private Wealth Services, Llc | 31.797 | 13,62 | 580 | 28,10 | ||||
| 2025-08-05 | 13F | Westside Investment Management, Inc. | 1.754 | 0,00 | 32 | 10,71 | ||||
| 2025-07-08 | 13F | Parallel Advisors, LLC | 5.196 | 199,14 | 95 | 235,71 | ||||
| 2025-07-18 | 13F | PFG Investments, LLC | 37.638 | 17,51 | 687 | 32,43 | ||||
| 2025-05-02 | 13F | Capital A Wealth Management, LLC | 1.280 | -11,72 | 21 | -20,00 | ||||
| 2025-08-19 | 13F | Asset Dedication, LLC | 2.400 | 0,00 | 44 | 13,16 | ||||
| 2025-07-30 | 13F | Princeton Global Asset Management LLC | 1.200 | 22 | ||||||
| 2025-07-18 | 13F | Trust Co Of Vermont | 5.289 | 96 | ||||||
| 2025-08-05 | 13F | Tsfg, Llc | 2 | 0,00 | 0 | |||||
| 2025-08-14 | 13F | Mml Investors Services, Llc | 13.744 | 5,19 | 0 | |||||
| 2025-04-17 | 13F | Cyndeo Wealth Partners, LLC | 0 | -100,00 | 0 | |||||
| 2025-07-08 | 13F | Nbc Securities, Inc. | 15.093 | 0,60 | 0 | |||||
| 2025-08-12 | 13F | Founders Financial Alliance, LLC | 16.441 | 13,68 | 300 | 27,78 | ||||
| 2025-08-04 | 13F | Kovack Advisors, Inc. | 30.825 | 562 | ||||||
| 2025-08-11 | 13F | Nations Financial Group Inc, /ia/ /adv | 22.615 | -7,14 | 413 | 4,57 | ||||
| 2025-05-02 | 13F | BlackRock, Inc. | 0 | -100,00 | 0 | |||||
| 2025-08-01 | 13F | Envestnet Asset Management Inc | 84.075 | 31,76 | 1.534 | 48,55 | ||||
| 2025-04-28 | 13F | Strategic Financial Concepts, LLC | 0 | -100,00 | 0 | |||||
| 2025-08-05 | 13F | Pointe Capital Management LLC | 131.220 | -0,00 | 2.393 | 12,72 | ||||
| 2025-08-19 | 13F | Advisory Services Network, LLC | 10.955 | -62,48 | 201 | -57,63 | ||||
| 2025-08-05 | 13F | GPS Wealth Strategies Group, LLC | 30.165 | 0,00 | 550 | 12,70 | ||||
| 2025-08-13 | 13F | Kayne Anderson Rudnick Investment Management Llc | 10.063 | 0,00 | 184 | 12,96 | ||||
| 2025-07-25 | 13F | Cwm, Llc | 7.909 | 246,89 | 0 | |||||
| 2025-07-17 | 13F | Wolff Wiese Magana Llc | 3.090 | 0,00 | 56 | 14,29 | ||||
| 2025-08-14 | 13F | GWM Advisors LLC | 62.018 | -2,56 | 1.131 | 9,91 | ||||
| 2025-08-08 | 13F | Strategies Wealth Advisors, LLC | 23.462 | 0,43 | 428 | 13,26 | ||||
| 2025-07-24 | 13F | Lokken Investment Group LLC | 11.812 | -7,51 | 215 | 4,37 | ||||
| 2025-07-31 | 13F | Oppenheimer & Co Inc | 64.763 | 0,71 | 1.181 | 13,56 | ||||
| 2025-08-11 | 13F | Lake Street Financial Llc | 65.448 | 2,11 | 1.194 | 15,04 | ||||
| 2025-07-21 | 13F | TFG Advisers LLC | 14.690 | 0,42 | 268 | 13,14 | ||||
| 2025-08-13 | 13F | StoneX Group Inc. | 0 | -100,00 | 0 | -100,00 | ||||
| 2025-08-14 | 13F | Goldman Sachs Group Inc | 31.646 | 0,00 | 577 | 12,70 | ||||
| 2025-08-08 | 13F | Hartland & Co., LLC | 139.285 | -1,65 | 2.541 | 10,87 | ||||
| 2025-08-14 | 13F | Wiley Bros.-aintree Capital, Llc | 16.187 | 5,49 | 295 | 18,47 | ||||
| 2025-05-08 | 13F | Essential Planning, LLC. | 0 | -100,00 | 0 | |||||
| 2025-08-11 | 13F | Tidemark, LLC | 17 | 0,00 | 0 | |||||
| 2025-08-06 | 13F | Wedbush Securities Inc | 22.199 | 1,73 | 0 | |||||
| 2025-07-16 | 13F | ORG Partners LLC | 1.500 | 0,00 | 27 | 12,50 | ||||
| 2025-07-21 | 13F | Ameriflex Group, Inc. | 0 | -100,00 | 0 | |||||
| 2025-04-23 | 13F | Financial Life Planners | 0 | -100,00 | 0 | |||||
| 2025-07-29 | 13F | Private Trust Co Na | 10.185 | 0,00 | 186 | 12,80 | ||||
| 2025-03-10 | 13F | Mattson Financial Services, LLC | 0 | -100,00 | 0 | |||||
| 2025-07-09 | 13F | David J Yvars Group | 27.121 | 6,77 | 493 | 19,42 | ||||
| 2025-07-18 | 13F | Bartlett & Co. Wealth Management Llc | 270 | 0,00 | 5 | 0,00 | ||||
| 2025-08-14 | 13F | Ameriprise Financial Inc | 267.626 | 2,12 | 4.872 | 14,24 | ||||
| 2025-07-21 | 13F | Barrett & Company, Inc. | 6.249 | 0,00 | 114 | 11,88 | ||||
| 2025-07-30 | 13F | D.a. Davidson & Co. | 24.720 | 2,06 | 451 | 15,09 | ||||
| 2025-04-14 | 13F | Old National Bancorp /in/ | 0 | -100,00 | 0 | |||||
| 2025-07-29 | 13F | Stratos Wealth Partners, LTD. | 512.616 | 23,16 | 9.350 | 38,85 | ||||
| 2025-08-14 | 13F | Mercer Global Advisors Inc /adv | 13.272 | -29,37 | 242 | -20,39 | ||||
| 2025-08-12 | 13F | Insigneo Advisory Services, Llc | 13.924 | 5,69 | 254 | 18,78 | ||||
| 2025-08-15 | 13F | CI Private Wealth, LLC | 15.772 | 11,10 | 288 | 25,33 | ||||
| 2025-07-14 | 13F | Maryland Capital Advisors Inc. | 0 | -100,00 | 0 | |||||
| 2025-08-08 | 13F | Cornerstone Advisors, LLC | 1.438.135 | 12,33 | 26.232 | 26,63 | ||||
| 2025-08-11 | 13F | United Capital Financial Advisers, Llc | 0 | -100,00 | 0 | |||||
| 2025-07-18 | 13F | Truist Financial Corp | 265.927 | 3,17 | 4.851 | 16,31 | ||||
| 2025-08-14 | 13F | Bank Of America Corp /de/ | 4.735.753 | -1,03 | 86.380 | 11,57 | ||||
| 2025-08-14 | 13F | CoreCap Advisors, LLC | 6.500 | -2,99 | 119 | 9,26 | ||||
| 2025-08-13 | 13F | Northwestern Mutual Wealth Management Co | 6.324 | 101,40 | 115 | 130,00 | ||||
| 2025-07-22 | 13F | Confluence Wealth Services, Inc. | 11.074 | 2,55 | 202 | 22,56 | ||||
| 2025-07-31 | 13F | City State Bank | 200 | 0,00 | 4 | 0,00 | ||||
| 2025-08-13 | 13F | Truvestments Capital Llc | 2.500 | 1,87 | 46 | 15,38 | ||||
| 2025-08-12 | 13F | Jpmorgan Chase & Co | 3.428 | 0,00 | 63 | 12,73 | ||||
| 2025-08-14 | 13F | Snowden Capital Advisors LLC | 35.632 | -2,85 | 650 | 9,44 | ||||
| 2025-05-13 | 13F | Northern Trust Corp | 0 | -100,00 | 0 | |||||
| 2025-05-06 | 13F | Venturi Wealth Management, LLC | 0 | -100,00 | 0 | |||||
| 2025-08-04 | 13F | Prairie Wealth Advisors, Inc. | 119.736 | 9,33 | 2.184 | 23,26 | ||||
| 2025-07-30 | 13F | Brookstone Capital Management | 29.765 | 24,02 | 543 | 39,69 | ||||
| 2025-07-18 | 13F | Consolidated Planning Corp | 15.071 | -13,89 | 275 | -3,18 | ||||
| 2025-08-14 | 13F | Comerica Bank | 53.929 | 2,52 | 984 | 15,51 | ||||
| 2025-05-12 | 13F | Fmr Llc | 0 | -100,00 | 0 | |||||
| 2025-05-14 | 13F | Van Hulzen Asset Management, LLC | 0 | -100,00 | 0 | |||||
| 2025-08-14 | 13F | Smartleaf Asset Management LLC | 2.502 | -0,36 | 45 | 12,50 | ||||
| 2025-07-21 | 13F | Quent Capital, LLC | 0 | -100,00 | 0 | |||||
| 2025-05-14 | 13F | Gould Capital, LLC | 0 | -100,00 | 0 | |||||
| 2025-07-25 | 13F | Sequoia Financial Advisors, LLC | 17.271 | -16,04 | 315 | -5,12 | ||||
| 2025-08-18 | 13F | Pacific Center for Financial Services | 1.692 | 0,00 | 31 | 11,11 |