Grundlæggende statistik
| Institutionelle ejere | 126 total, 126 long only, 0 short only, 0 long/short - change of -8,03% MRQ |
| Gennemsnitlig porteføljeallokering | 0.0700 % - change of -69,23% MRQ |
| Institutionelle aktier (lange) | 24.654.795 (ex 13D/G) - change of -14,61MM shares -37,21% MRQ |
| Institutionel værdi (lang) | $ 193.791 USD ($1000) |
Institutionelt ejerskab og aktionærer
Cornerstone Strategic Investment Fund, Inc. (US:CLM) har 126 institutionelle ejere og aktionærer, der har indsendt 13D/G- eller 13F-formularer til Securities Exchange Commission (SEC). Disse institutioner har i alt 24,654,795 aktier. Største aktionærer omfatter Advisor Group Holdings, Inc., PFG Investments, LLC, Sculptor Capital LP, LPL Financial LLC, Boothbay Fund Management, Llc, Quarry LP, Cetera Investment Advisers, Alpine Global Management, LLC, Cable Car Capital LLC, and Cohen & Steers, Inc. .
Cornerstone Strategic Investment Fund, Inc. (NYSEAM:CLM) institutionel ejerskabsstruktur viser aktuelle positioner i virksomheden efter institutioner og fonde, samt seneste ændringer i positionsstørrelse. Større aktionærer kan omfatte individuelle investorer, investeringsforeninger, hedgefonde eller institutioner. Skema 13D angiver, at investoren besidder (eller besidder) mere end 5 % af virksomheden og har til hensigt (eller har til hensigt at) aktivt at forfølge en ændring i forretningsstrategi. Skema 13G indikerer en passiv investering på over 5%.
The share price as of April 17, 2026 is 7,53 / share. Previously, on April 21, 2025, the share price was 6,66 / share. This represents an increase of 13,06% over that period.

Fondens stemningsscore
Fund Sentiment Score (fka Ownership Accumulation Score) finder de aktier, der bliver mest købt af fonde. Det er resultatet af en sofistikeret, multi-faktor kvantitativ model, der identificerer virksomheder med de højeste niveauer af institutionel akkumulering. Scoringsmodellen bruger en kombination af den samlede stigning i oplyste ejere, ændringerne i porteføljeallokeringer i disse ejere og andre målinger. Tallet går fra 0 til 100, hvor højere tal indikerer et højere niveau af akkumulering for sine jævnaldrende, og 50 er gennemsnittet.
Opdateringsfrekvens: Dagligt
Se Ownership Explorer, som giver en liste over højest rangerende virksomheder.
AI+ Ask Fintel’s AI assistant about Cornerstone Strategic Investment Fund, Inc..
Select a question to share a public post with an AI-crafted answer.
Thinking of good questions…
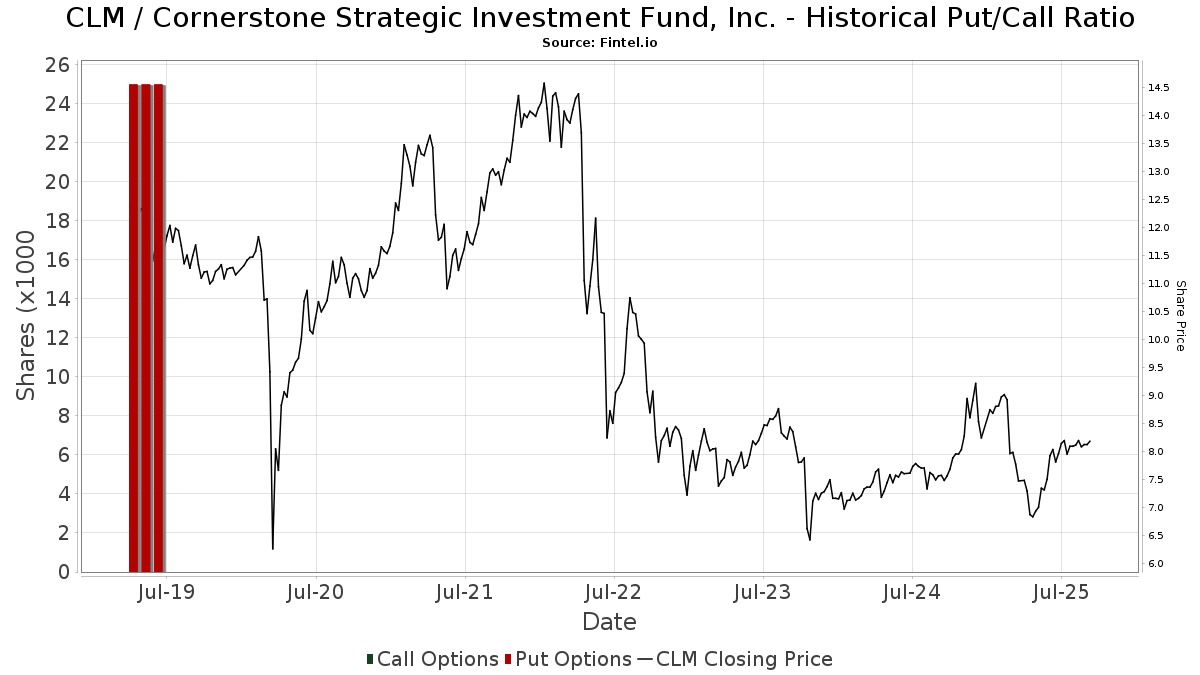
Institutionel Put/Call-forhold
Ud over at indberette standardaktie- og gældsudstedelser skal institutter med mere end 100 mill. aktiver under forvaltning også oplyse deres put- og call-optionsbeholdninger. Da salgsoptioner generelt indikerer negativ stemning, og købsoptioner indikerer positiv stemning, kan vi få en fornemmelse af den overordnede institutionelle stemning ved at plotte forholdet mellem put og kald. Diagrammet til højre viser det historiske put/call-forhold for dette instrument.
Brug af Put/Call Ratio som en indikator for investorernes stemning overvinder en af de vigtigste mangler ved at bruge totalt institutionelt ejerskab, som er, at en betydelig mængde af aktiver under forvaltning investeres passivt for at spore indekser. Passivt forvaltede fonde køber typisk ikke optioner, så indikatoren for put/call-forholdet følger mere nøje følelsen af aktivt forvaltede fonde.
13F og NPORT arkivering
Detaljer om 13F-arkivering er gratis. Detaljer om NP-ansøgninger kræver et premium-medlemskab. Grønne rækker angiver nye positioner. Røde rækker angiver lukkede positioner. Klik på linket ikon for at se den fulde transaktionshistorik.
Opgrader
for at låse premium-data op og eksportere til Excel ![]() .
.
| Fil dato | Kilde | Investor | Type | Gennemsnitlig pris (Øst) |
Aktier | Δ Aktier (%) |
Rapporteret Værdi ($1000) |
Δ Værdi (%) |
Port Alloc (%) |
|
|---|---|---|---|---|---|---|---|---|---|---|
| 2026-02-13 | 13F | Wells Fargo & Company/mn | 2 | -60,00 | 0 | |||||
| 2025-11-05 | 13F | Capital Investment Advisory Services, LLC | 0 | -100,00 | 0 | |||||
| 2026-02-10 | 13F | Pasadena Private Wealth, LLC | 20.457 | 44,94 | 171 | 47,41 | ||||
| 2026-04-20 | 13F | Kestra Private Wealth Services, Llc | 25.805 | 3,60 | 188 | -10,10 | ||||
| 2026-01-29 | 13F | Sanctuary Advisors, LLC | 19.615 | 3,78 | 164 | 4,49 | ||||
| 2026-03-03 | 13F | NWF Advisory Services Inc. | 12.500 | 104 | ||||||
| 2026-02-17 | 13F | Creative Planning | 178.086 | -10,48 | 1.489 | -9,65 | ||||
| 2026-01-07 | 13F | Harbor Investment Advisory, Llc | 11.204 | 0,00 | 94 | 1,09 | ||||
| 2026-02-11 | 13F | Jpmorgan Chase & Co | 3.032 | 25 | ||||||
| 2026-04-13 | 13F | Buska Wealth Management, LLC | 29.435 | 2,80 | 214 | -10,46 | ||||
| 2026-02-17 | 13F | Millennium Management Llc | 10.171 | -61,73 | 85 | -61,36 | ||||
| 2026-02-17 | 13F | Royal Bank Of Canada | 1.000 | 0,00 | 8 | 0,00 | ||||
| 2026-02-23 | 13F | Virtu Financial LLC | 0 | -100,00 | 0 | |||||
| 2026-02-04 | 13F | Meridian Wealth Management, LLC | 19.459 | 27,32 | 163 | 28,57 | ||||
| 2026-01-09 | 13F | Capital CS Group, LLC | 16.539 | 1,55 | 138 | 2,99 | ||||
| 2026-02-05 | 13F | Cambridge Investment Research Advisors, Inc. | 561.577 | 6,91 | 5 | 0,00 | ||||
| 2026-04-14 | 13F | Prospera Financial Services Inc | 86.673 | -1,16 | 631 | -13,92 | ||||
| 2026-02-12 | 13F | BlackRock, Inc. | 41.258 | 41,28 | 345 | 42,74 | ||||
| 2026-01-26 | 13F | Cwm, Llc | 165 | 0 | ||||||
| 2026-04-02 | 13F | Marex Group plc | 0 | -100,00 | 0 | -100,00 | ||||
| 2026-02-10 | 13F | Goldman Sachs Group Inc | 15.000 | 125 | ||||||
| 2026-01-26 | 13F | Valmark Advisers, Inc. | 10.000 | 0,00 | 84 | 1,22 | ||||
| 2026-02-11 | 13F | LPL Financial LLC | 1.802.318 | 24,11 | 15.067 | 25,31 | ||||
| 2026-02-13 | 13F | Yakira Capital Management, Inc. | 487.207 | -52,31 | 4.073 | -51,85 | ||||
| 2026-02-13 | 13F | Baird Financial Group, Inc. | 160.360 | 37,79 | 1.341 | 39,15 | ||||
| 2026-04-07 | 13F | CoreCap Advisors, LLC | 19.176 | -54,77 | 140 | -60,73 | ||||
| 2026-01-26 | 13F | PFG Investments, LLC | 2.997.808 | 7.582,94 | 25.062 | 7.658,82 | ||||
| 2026-03-13 | 13F/A | Pensionmark Financial Group, Llc | 19.654 | 164 | ||||||
| 2026-02-11 | 13F | J.w. Cole Advisors, Inc. | 219.637 | -2,01 | 1.810 | -2,48 | ||||
| 2026-02-17 | 13F | Raymond James Financial Inc | 367.470 | 6,33 | 3.072 | 7,38 | ||||
| 2026-01-27 | 13F | Duncker Streett & Co Inc | 1.000 | 0,00 | 8 | 0,00 | ||||
| 2026-04-09 | 13F | Secure Asset Management, LLC | 12.530 | 91 | ||||||
| 2026-01-12 | 13F | Salem Investment Counselors Inc | 0 | -100,00 | 0 | |||||
| 2026-02-11 | 13F | Parallel Advisors, LLC | 1.941 | 16 | ||||||
| 2026-02-13 | 13F | Colony Group, LLC | 10.189 | 85 | ||||||
| 2026-02-13 | 13F | Sculptor Capital LP | 2.967.736 | 5,52 | 24.810 | 6,54 | ||||
| 2026-02-03 | 13F | Vantage Financial Partners, LLC | 16.927 | -20,44 | 142 | -19,89 | ||||
| 2026-02-17 | 13F | Citadel Advisors Llc | 0 | -100,00 | 0 | |||||
| 2025-11-12 | 13F | Rsm Us Wealth Management Llc | 0 | -100,00 | 0 | |||||
| 2026-02-13 | 13F | A4 Wealth Advisors LLC | 15.972 | -42,43 | 134 | -41,92 | ||||
| 2026-04-09 | 13F | Firethorn Wealth Partners, Llc | 40.255 | 103,70 | 293 | 77,58 | ||||
| 2026-02-20 | 13F | Sunbelt Securities, Inc. | 1.463 | 5,48 | 12 | 9,09 | ||||
| 2026-02-12 | 13F | Wedbush Securities Inc | 17.150 | 0,00 | 0 | |||||
| 2026-01-14 | 13F | Spire Wealth Management | 3.572 | 30 | ||||||
| 2026-02-13 | 13F | Stifel Financial Corp | 46.859 | -7,27 | 392 | -6,46 | ||||
| 2025-11-06 | 13F | Oppenheimer & Co Inc | 0 | -100,00 | 0 | |||||
| 2026-02-13 | 13F | Cohen & Steers, Inc. | 654.931 | -2,24 | 5 | 0,00 | ||||
| 2026-04-15 | 13F | Seacrest Wealth Management, Llc | 28.547 | -4,60 | 208 | -17,86 | ||||
| 2026-02-17 | 13F | Cetera Investment Advisers | 1.200.246 | 12,48 | 10.034 | 13,57 | ||||
| 2026-02-04 | 13F | Ameritas Advisory Services, LLC | 0 | -100,00 | 0 | |||||
| 2026-02-13 | 13F | MAI Capital Management | 600 | -37,43 | 5 | -28,57 | ||||
| 2026-01-21 | 13F | Newbridge Financial Services Group, Inc. | 0 | -100,00 | 0 | |||||
| 2026-02-06 | 13F | HighTower Advisors, LLC | 60.900 | -11,44 | 509 | -10,54 | ||||
| 2026-02-12 | 13F | Steward Partners Investment Advisory, Llc | 1 | 0,00 | 0 | |||||
| 2026-02-05 | 13F | Thrivent Financial For Lutherans | 145.939 | 0,00 | 1 | 0,00 | ||||
| 2026-02-09 | 13F | Strategic Financial Concepts, LLC | 0 | -100,00 | 0 | |||||
| 2026-04-10 | 13F | Winebrenner Capital Management Llc | 157.800 | 15,39 | 1.149 | 0,44 | ||||
| 2026-01-23 | 13F | Assetmark, Inc | 7.960 | 303,86 | 67 | 312,50 | ||||
| 2026-01-30 | 13F | Us Bancorp \de\ | 6.505 | 0,00 | 54 | 1,89 | ||||
| 2026-02-13 | 13F | Becker Capital Management Inc | 19.471 | 10,44 | 163 | 11,72 | ||||
| 2025-11-13 | 13F | Fmr Llc | 0 | -100,00 | 0 | -100,00 | ||||
| 2026-02-13 | 13F | Change Path, LLC | 76.189 | 10,29 | 637 | 11,38 | ||||
| 2026-02-13 | 13F | SRS Capital Advisors, Inc. | 3.731 | 94,02 | 31 | 106,67 | ||||
| 2026-01-16 | 13F | Empirical Financial Services, LLC d.b.a. Empirical Wealth Management | 0 | -100,00 | 0 | |||||
| 2026-02-17 | 13F | Tower Research Capital LLC (TRC) | 0 | -100,00 | 0 | |||||
| 2026-01-23 | 13F/A | HF Advisory Group, LLC | 23.575 | 3,65 | 197 | 4,79 | ||||
| 2026-01-20 | 13F | Savvy Advisors, Inc. | 108.760 | 909 | ||||||
| 2026-02-04 | 13F | Atlantic Union Bankshares Corp | 5.500 | 0,00 | 46 | 0,00 | ||||
| 2026-02-17 | 13F | Private Advisor Group, LLC | 53.982 | 5,91 | 451 | 6,87 | ||||
| 2026-02-12 | 13F | Summit Financial, LLC | 19.427 | -10,83 | 162 | -10,00 | ||||
| 2026-02-13 | 13F | Integrated Wealth Concepts LLC | 0 | -100,00 | 0 | |||||
| 2026-02-17 | 13F | Cable Car Capital LLC | 661.683 | 0,01 | 5.532 | 0,97 | ||||
| 2026-02-12 | 13F | Mark Sheptoff Financial Planning, Llc | 34.913 | 0,00 | 292 | 0,69 | ||||
| 2026-02-12 | 13F | Jane Street Group, Llc | 180.282 | 166,93 | 1.507 | 169,59 | ||||
| 2026-02-03 | 13F | Encompass More Asset Management | 80.973 | -3,40 | 677 | -2,59 | ||||
| 2026-04-16 | 13F | Roble, Belko & Company, Inc | 898 | 0,00 | 0 | |||||
| 2026-01-07 | 13F | Aventura Private Wealth, LLC | 2.500 | 66,67 | 21 | 66,67 | ||||
| 2026-02-06 | 13F | IFP Advisors, Inc | 0 | -100,00 | 0 | -100,00 | ||||
| 2026-02-12 | 13F | Sit Investment Associates Inc | 0 | -100,00 | 0 | |||||
| 2026-02-17 | 13F | Toronto Dominion Bank | 50.000 | 0,00 | 418 | 0,97 | ||||
| 2026-04-15 | 13F | Redhawk Wealth Advisors, Inc. | 12.459 | 4,77 | 91 | -9,09 | ||||
| 2026-02-03 | 13F | We Are One Seven, LLC | 35.471 | 0,25 | 297 | 1,37 | ||||
| 2026-02-13 | 13F | Aptus Capital Advisors, LLC | 201.751 | 1,35 | 1.687 | 2,31 | ||||
| 2026-02-17 | 13F | Ameriflex Group, Inc. | 28.000 | -56,66 | 234 | -56,18 | ||||
| 2026-02-05 | 13F | Tucker Asset Management Llc | 14 | 0 | ||||||
| 2026-02-14 | 13F | Rockefeller Capital Management L.P. | 26.634 | -1,92 | 223 | -0,89 | ||||
| 2026-02-18 | 13F | EP Wealth Advisors, Inc. | 28.732 | 240 | ||||||
| 2026-02-03 | 13F | Sequoia Financial Advisors, LLC | 21.400 | 0,00 | 179 | 0,56 | ||||
| 2026-02-10 | 13F | Envestnet Asset Management Inc | 50.276 | 10,66 | 420 | 11,70 | ||||
| 2026-02-02 | 13F | WJ Financial Advisors LLC | 263.015 | 74,30 | 2.199 | 75,98 | ||||
| 2026-02-09 | 13F | Integrity Alliance, Llc. | 17.642 | -11,62 | 147 | -10,91 | ||||
| 2026-02-18 | 13F | Garton & Associates Financial Advisors LLC | 2.500 | 21 | ||||||
| 2026-02-06 | 13F | GPS Wealth Strategies Group, LLC | 0 | -100,00 | 0 | |||||
| 2025-10-20 | 13F | Absolute Investment Advisers Llc | 0 | -100,00 | 0 | |||||
| 2026-01-20 | 13F | Stratos Wealth Partners, LTD. | 626.085 | 23,13 | 5.234 | 24,32 | ||||
| 2026-02-13 | 13F | Quarry LP | 1.235.307 | 353,60 | 10.327 | 358,16 | ||||
| 2026-02-17 | 13F | Rivernorth Capital Management, Llc | 0 | -100,00 | 0 | |||||
| 2026-02-12 | 13F | Principal Securities, Inc. | 0 | -100,00 | 0 | -100,00 | ||||
| 2026-02-17 | 13F | Garden State Investment Advisory Services LLC | 52.080 | 5,77 | 436 | 6,88 | ||||
| 2026-01-26 | 13F | AE Wealth Management LLC | 71.903 | 6,34 | 601 | 7,51 | ||||
| 2026-02-17 | 13F | Ameriprise Financial Inc | 15.916 | -0,09 | 133 | 1,53 | ||||
| 2026-04-08 | 13F | Dynamic Advisor Solutions LLC | 48.798 | 9,06 | 355 | -5,08 | ||||
| 2026-04-13 | 13F | Creative Financial Designs Inc /adv | 93.982 | 3,15 | 684 | -10,12 | ||||
| 2026-02-19 | 13F | CI Private Wealth, LLC | 15.177 | 127 | ||||||
| 2026-04-07 | 13F | Farther Finance Advisors, LLC | 5.804 | 0,00 | 43 | -12,50 | ||||
| 2025-11-14 | 13F | Ursa Fund Management, LLC | 0 | -100,00 | 0 | |||||
| 2026-02-17 | 13F | Parvin Asset Management, LLC | 67 | 1 | ||||||
| 2026-02-11 | 13F | OneAscent Family Office, LLC | 34.000 | 0,00 | 284 | 1,07 | ||||
| 2025-11-12 | 13F | Dunhill Financial, LLC | 0 | -100,00 | 0 | |||||
| 2026-02-13 | 13F | Mosaic Family Wealth Partners, Llc | 0 | -100,00 | 0 | |||||
| 2026-02-17 | 13F/A | Kovack Advisors, Inc. | 211.213 | 1.766 | ||||||
| 2026-04-13 | 13F | GoalVest Advisory LLC | 928 | 0,00 | 7 | -14,29 | ||||
| 2026-02-13 | 13F | Mariner, LLC | 20.890 | 52,55 | 175 | 53,98 | ||||
| 2026-02-13 | 13F | Kestra Advisory Services, LLC | 0 | -100,00 | 0 | |||||
| 2026-02-04 | 13F | Tsfg, Llc | 2.552 | 5,50 | 0 | |||||
| 2026-02-13 | 13F | Morgan Stanley | 558.877 | 11,57 | 4.672 | 12,66 | ||||
| 2026-02-17 | 13F | Alpine Global Management, LLC | 1.139.814 | -83,70 | 9.529 | -83,55 | ||||
| 2026-02-03 | 13F | Anfield Capital Management, LLC | 6.528 | 0,00 | 55 | 0,00 | ||||
| 2025-11-06 | 13F | BlueChip Wealth Advisors LLC | 0 | -100,00 | 0 | |||||
| 2026-02-09 | 13F | Fisher Asset Management, LLC | 0 | -100,00 | 0 | |||||
| 2026-02-17 | 13F | Susquehanna International Group, Llp | 87.877 | 119,90 | 735 | 122,42 | ||||
| 2026-02-09 | 13F | Avalon Trust Co | 1.000 | 0,00 | 8 | 0,00 | ||||
| 2026-02-12 | 13F | Commonwealth Equity Services, Llc | 284.559 | 11,09 | 2.379 | 118.800,00 | ||||
| 2025-11-14 | 13F | Imprint Wealth LLC | 0 | -100,00 | 0 | |||||
| 2026-02-09 | 13F | Kingsview Wealth Management, LLC | 10.000 | 0,00 | 84 | 1,22 | ||||
| 2026-02-17 | 13F | Perennial Investment Advisors, LLC | 465.564 | 2,34 | 3.892 | 3,35 | ||||
| 2026-02-13 | 13F | Thomas J. Herzfeld Advisors, Inc. | 1.060 | -88,89 | 9 | -89,74 | ||||
| 2026-02-06 | 13F | Pnc Financial Services Group, Inc. | 1.250 | 0,00 | 10 | 0,00 | ||||
| 2026-02-17 | 13F | Bank Of America Corp /de/ | 3.895 | 33 | ||||||
| 2026-02-05 | 13F | Allworth Financial LP | 11.910 | -17,73 | 100 | -16,81 | ||||
| 2026-02-17 | 13F | Advisor Group Holdings, Inc. | 3.371.147 | -3,26 | 28.183 | -0,67 | ||||
| 2026-02-17 | 13F | Boothbay Fund Management, Llc | 1.285.340 | -79,94 | 10.745 | -79,75 | ||||
| 2026-02-02 | 13F | Danske Bank A/s | 2 | 0,00 | 0 | |||||
| 2026-02-02 | 13F | Benjamin Edwards Inc | 77.735 | -13,47 | 650 | -12,65 | ||||
| 2026-04-14 | 13F | Nbc Securities, Inc. | 25.205 | 36,58 | 183 | 18,83 | ||||
| 2026-02-04 | 13F | Money Concepts Capital Corp | 10.601 | -33,33 | 89 | -32,82 | ||||
| 2026-04-08 | 13F | Wealth Enhancement Advisory Services, Llc | 24.023 | -29,43 | 176 | -38,68 | ||||
| 2026-02-13 | 13F | Pathstone Holdings, LLC | 33.089 | 57,48 | 277 | 59,54 | ||||
| 2026-04-15 | 13F | DAVENPORT & Co LLC | 12.773 | 0,00 | 93 | -13,21 | ||||
| 2026-01-29 | 13F | UBS Group AG | 17.634 | -24,61 | 147 | -23,83 | ||||
| 2026-01-21 | 13F | Sound Income Strategies, LLC | 4.864 | 0,00 | 41 | -2,44 | ||||
| 2026-04-10 | 13F | Marshall Financial Group LLC | 10.000 | 0,00 | 73 | -13,25 | ||||
| 2026-01-23 | 13F | Keener Financial Planning LLC | 0 | -100,00 | 0 | |||||
| 2026-02-06 | 13F | Larson Financial Group LLC | 12.077 | 4,31 | 101 | 5,26 | ||||
| 2026-04-06 | 13F | Highline Wealth Partners Llc | 400 | 0,00 | 3 | -33,33 | ||||
| 2026-04-20 | 13F | Godsey & Gibb Associates | 1.000 | 0,00 | 7 | -12,50 | ||||
| 2026-02-13 | 13F | Resources Investment Advisors, LLC. | 10.760 | 4,87 | 90 | 5,95 | ||||
| 2026-02-10 | 13F/A | Northwestern Mutual Wealth Management Co | 1.908 | -66,21 | 16 | -67,39 | ||||
| 2026-02-09 | 13F | Harbour Investments, Inc. | 38 | 0,00 | 0 | |||||
| 2026-04-13 | 13F | Gill Capital Partners, Llc | 29 | 0 | ||||||
| 2026-02-10 | 13F | Evolution Wealth Management Inc. | 19.425 | 0,00 | 162 | 1,25 | ||||
| 2026-02-12 | 13F | StoneX Group Inc. | 142.949 | -10,14 | 1.195 | -9,26 | ||||
| 2026-02-18 | 13F | GWM Advisors LLC | 16.919 | 33,41 | 141 | 34,29 | ||||
| 2026-01-28 | 13F | Chicago Partners Investment Group LLC | 25.432 | -3,06 | 211 | -2,76 | ||||
| 2025-11-12 | 13F | Park Square Financial Group, LLC | 0 | -100,00 | 0 |