Grundlæggende statistik
| Institutionelle ejere | 148 total, 148 long only, 0 short only, 0 long/short - change of 6,47% MRQ |
| Gennemsnitlig porteføljeallokering | 1.6920 % - change of -17,09% MRQ |
| Institutionelle aktier (lange) | 13.566.618 (ex 13D/G) - change of 4,47MM shares 49,08% MRQ |
| Institutionel værdi (lang) | $ 1.044.366 USD ($1000) |
Institutionelt ejerskab og aktionærer
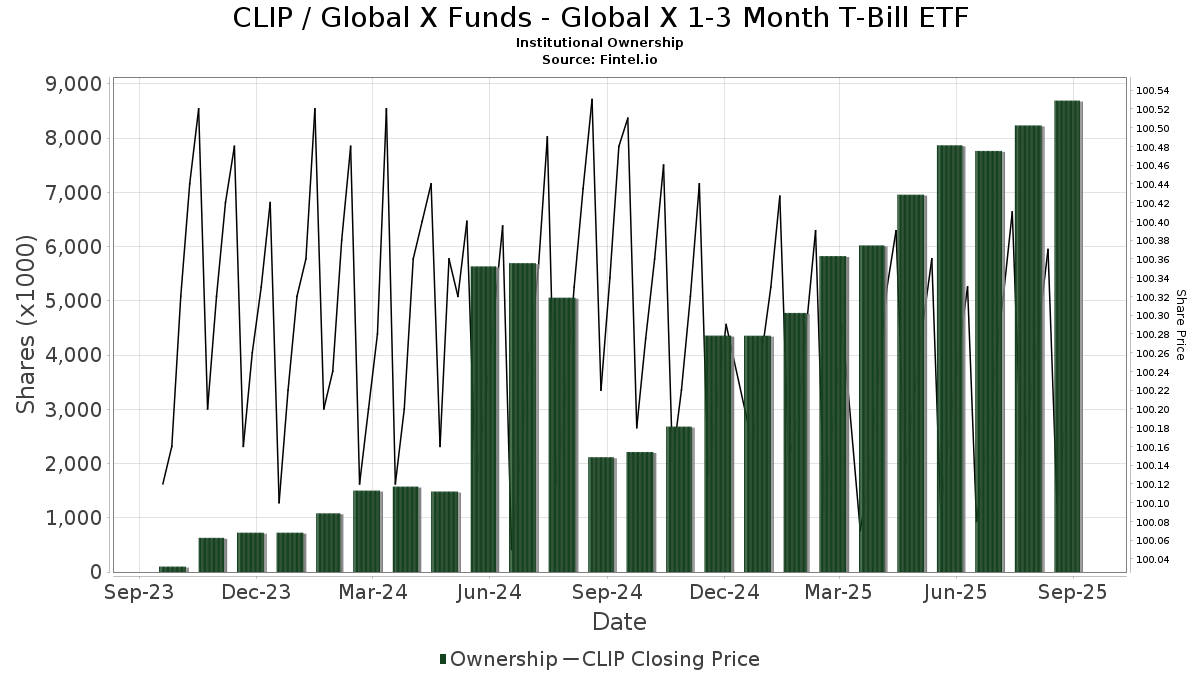
Global X Funds - Global X 1-3 Month T-Bill ETF (US:CLIP) har 148 institutionelle ejere og aktionærer, der har indsendt 13D/G- eller 13F-formularer til Securities Exchange Commission (SEC). Disse institutioner har i alt 13,566,618 aktier. Største aktionærer omfatter Harel Insurance Investments & Financial Services Ltd., Sei Investments Co, Bleakley Financial Group, LLC, LPL Financial LLC, Capital Investment Advisors, LLC, Rhl Group, Llc, Advisor OS, LLC, Mjp Associates Inc /adv, Accurate Wealth Management, LLC, and 49 Wealth Management, Llc .
Global X Funds - Global X 1-3 Month T-Bill ETF (ARCA:CLIP) institutionel ejerskabsstruktur viser aktuelle positioner i virksomheden efter institutioner og fonde, samt seneste ændringer i positionsstørrelse. Større aktionærer kan omfatte individuelle investorer, investeringsforeninger, hedgefonde eller institutioner. Skema 13D angiver, at investoren besidder (eller besidder) mere end 5 % af virksomheden og har til hensigt (eller har til hensigt at) aktivt at forfølge en ændring i forretningsstrategi. Skema 13G indikerer en passiv investering på over 5%.
The share price as of March 17, 2026 is 100,22 / share. Previously, on March 18, 2025, the share price was 100,27 / share. This represents a decline of 0,05% over that period.
Fondens stemningsscore
Fund Sentiment Score (fka Ownership Accumulation Score) finder de aktier, der bliver mest købt af fonde. Det er resultatet af en sofistikeret, multi-faktor kvantitativ model, der identificerer virksomheder med de højeste niveauer af institutionel akkumulering. Scoringsmodellen bruger en kombination af den samlede stigning i oplyste ejere, ændringerne i porteføljeallokeringer i disse ejere og andre målinger. Tallet går fra 0 til 100, hvor højere tal indikerer et højere niveau af akkumulering for sine jævnaldrende, og 50 er gennemsnittet.
Opdateringsfrekvens: Dagligt
Se Ownership Explorer, som giver en liste over højest rangerende virksomheder.
AI+ Ask Fintel’s AI assistant about Global X Funds - Global X 1-3 Month T-Bill ETF.
Select a question to share a public post with an AI-crafted answer.
Thinking of good questions…
Institutionel Put/Call-forhold
Ud over at indberette standardaktie- og gældsudstedelser skal institutter med mere end 100 mill. aktiver under forvaltning også oplyse deres put- og call-optionsbeholdninger. Da salgsoptioner generelt indikerer negativ stemning, og købsoptioner indikerer positiv stemning, kan vi få en fornemmelse af den overordnede institutionelle stemning ved at plotte forholdet mellem put og kald. Diagrammet til højre viser det historiske put/call-forhold for dette instrument.
Brug af Put/Call Ratio som en indikator for investorernes stemning overvinder en af de vigtigste mangler ved at bruge totalt institutionelt ejerskab, som er, at en betydelig mængde af aktiver under forvaltning investeres passivt for at spore indekser. Passivt forvaltede fonde køber typisk ikke optioner, så indikatoren for put/call-forholdet følger mere nøje følelsen af aktivt forvaltede fonde.
13F og NPORT arkivering
Detaljer om 13F-arkivering er gratis. Detaljer om NP-ansøgninger kræver et premium-medlemskab. Grønne rækker angiver nye positioner. Røde rækker angiver lukkede positioner. Klik på linket ikon for at se den fulde transaktionshistorik.
Opgrader
for at låse premium-data op og eksportere til Excel ![]() .
.
| Fil dato | Kilde | Investor | Type | Gennemsnitlig pris (Øst) |
Aktier | Δ Aktier (%) |
Rapporteret Værdi ($1000) |
Δ Værdi (%) |
Port Alloc (%) |
|
|---|---|---|---|---|---|---|---|---|---|---|
| 2026-01-08 | 13F | Maridea Wealth Management LLC | 0 | -100,00 | 0 | |||||
| 2026-02-12 | 13F | Brinker Capital Investments, LLC | 66.437 | 4,64 | 6.651 | 4,31 | ||||
| 2026-02-12 | 13F | Rossby Financial, LCC | 96 | 0,00 | 10 | 0,00 | ||||
| 2026-02-06 | 13F | Portland Financial Advisors Inc | 3.198 | 25,36 | 320 | 25,00 | ||||
| 2026-01-26 | 13F | Mirae Asset Global Investments Co., Ltd. | 225.000 | 171,08 | 22.525 | 170,27 | ||||
| 2026-02-12 | 13F | Sykon Capital Llc | 11.127 | -73,40 | 1.114 | -73,50 | ||||
| 2026-02-04 | 13F | Advisor OS, LLC | 355.079 | -13,37 | 35.547 | -13,64 | ||||
| 2026-02-18 | 13F | GWM Advisors LLC | 3.882 | 1,62 | 389 | 1,31 | ||||
| 2026-02-05 | 13F | Center for Financial Planning, Inc. | 1.124 | 113 | ||||||
| 2026-01-26 | 13F | Merit Financial Group, LLC | 16.332 | -0,01 | 1.635 | -0,37 | ||||
| 2026-02-17 | 13F | Fmr Llc | 34 | -79,01 | 3 | -81,25 | ||||
| 2025-10-22 | 13F | Geneos Wealth Management Inc. | 0 | -100,00 | 0 | |||||
| 2026-01-30 | 13F | Exencial Wealth Advisors, Llc | 2.774 | -1,25 | 278 | -1,77 | ||||
| 2026-02-02 | 13F | Mutual Advisors, LLC | 5.385 | -6,48 | 539 | -6,59 | ||||
| 2026-02-10 | 13F | Rothschild Investment Llc | 9.250 | 0,00 | 926 | -0,22 | ||||
| 2026-02-09 | 13F | Bleakley Financial Group, LLC | 906.065 | 90.706 | ||||||
| 2026-01-12 | 13F | Byrne Asset Management LLC | 786 | 8,41 | 79 | 8,33 | ||||
| 2026-01-21 | 13F | Stapp Wealth Management, Pllc | 108.923 | 2,79 | 10.904 | 2,47 | ||||
| 2026-02-11 | 13F | Gateway Wealth Partners, LLC | 8.020 | -2,25 | 803 | -2,55 | ||||
| 2026-02-05 | 13F | Castle Rock Wealth Management, LLC | 23.290 | 6,05 | 2.332 | 6,05 | ||||
| 2026-02-17 | 13F | Cetera Investment Advisers | 68.056 | 36,84 | 6.813 | 36,42 | ||||
| 2026-02-11 | 13F | Avise Financial Cooperative, Inc. | 2.156 | 216 | ||||||
| 2026-02-13 | 13F | Morgan Stanley | 699 | -21,02 | 70 | -21,59 | ||||
| 2026-02-13 | 13F | Denver Wealth Management, Inc. | 40.738 | 13,26 | 4.078 | 12,93 | ||||
| 2025-10-21 | 13F | McElhenny Sheffield Capital Management, LLC | 0 | -100,00 | 0 | -100,00 | ||||
| 2026-01-16 | 13F | Beaumont Financial Advisors, LLC | 5.300 | 1,01 | 531 | 0,76 | ||||
| 2026-02-10 | 13F/A | Northwestern Mutual Wealth Management Co | 10 | 1 | ||||||
| 2025-10-20 | 13F | Ascent Group, LLC | 0 | -100,00 | 0 | |||||
| 2025-11-17 | 13F | Kestra Private Wealth Services, Llc | 0 | -100,00 | 0 | -100,00 | ||||
| 2026-02-03 | 13F | Lumbard & Kellner, LLC | 23.060 | -3,66 | 2.309 | -3,95 | ||||
| 2026-01-30 | 13F | Precision Wealth Strategies, LLC | 16.473 | 20,75 | 1.649 | 20,45 | ||||
| 2026-02-04 | 13F | 49 Wealth Management, Llc | 303.414 | -35,13 | 30.375 | -35,33 | ||||
| 2026-02-09 | 13F | Rhl Group, Llc | 634.197 | 63.489 | ||||||
| 2026-02-12 | 13F | Cloud Capital Management, LLC | 5.234 | 1 | ||||||
| 2026-01-15 | 13F | Stewardship Advisors, LLC | 3.950 | 1,83 | 395 | 1,54 | ||||
| 2026-02-09 | 13F | Putnam Fl Investment Management Co | 35.653 | 818,42 | 3.569 | 817,48 | ||||
| 2025-10-29 | 13F | Meitav Dash Investments Ltd | 0 | -100,00 | 0 | -100,00 | ||||
| 2025-09-29 | NP | BTRN - Global X Bitcoin Trend Strategy ETF | 49.260 | -7,16 | 4.946 | -7,15 | ||||
| 2026-02-17 | 13F | Old Mission Capital Llc | 0 | -100,00 | 0 | -100,00 | ||||
| 2026-02-13 | 13F | Mml Investors Services, Llc | 21.527 | -4,21 | 2.155 | -4,48 | ||||
| 2026-01-28 | 13F | APS Management Group, Inc. | 116.449 | -5,77 | 11.658 | -6,07 | ||||
| 2026-02-09 | 13F | Kingsview Wealth Management, LLC | 14.348 | -13,90 | 1.436 | -14,17 | ||||
| 2026-02-10 | 13F | Calton & Associates, Inc. | 0 | -100,00 | 0 | |||||
| 2026-02-04 | 13F | Community Bank, N.A. | 27 | 0,00 | 3 | 0,00 | ||||
| 2026-02-13 | 13F | Kestra Advisory Services, LLC | 0 | -100,00 | 0 | |||||
| 2026-01-28 | 13F | Gentry Private Wealth, Llc | 3.050 | 0,00 | 305 | -0,33 | ||||
| 2026-02-12 | 13F | Gerber Kawasaki Wealth & Investment Management | 88.083 | 74,00 | 8.818 | 73,48 | ||||
| 2026-02-09 | 13F | Terril Brothers, Inc. | 71.697 | -15,25 | 7.178 | -15,52 | ||||
| 2026-02-12 | 13F | Fortress Private Ledger, Llc | 3.282 | 0,00 | 329 | -0,30 | ||||
| 2026-02-06 | 13F | Creative Financial Designs Inc /adv | 98 | -61,57 | 10 | -64,00 | ||||
| 2026-02-10 | 13F | Verus Capital Partners, Llc | 117.350 | 34,81 | 11.748 | 34,39 | ||||
| 2026-02-11 | 13F | Janney Montgomery Scott LLC | 2.573 | 0 | ||||||
| 2025-11-12 | 13F | Armis Advisers, LLC | 2.072 | 207 | ||||||
| 2026-01-12 | 13F | Castleview Partners, Llc | 10.921 | 1.093 | ||||||
| 2026-01-26 | 13F | Private Trust Co Na | 99 | 0,00 | 10 | 0,00 | ||||
| 2026-02-10 | 13F | Envestnet Asset Management Inc | 65.655 | 5,00 | 6.573 | 4,67 | ||||
| 2026-02-12 | 13F | Alaethes Wealth LLC | 105.641 | -8,85 | 10.612 | -8,82 | ||||
| 2026-02-27 | 13F | Compass Financial Services Inc | 633 | 1,12 | 63 | 1,61 | ||||
| 2026-02-13 | 13F | Wells Fargo & Company/mn | 649 | 65 | ||||||
| 2026-01-26 | 13F | PFG Investments, LLC | 3.395 | 0,21 | 340 | -0,29 | ||||
| 2026-02-13 | 13F | Focused Alpha, Llc | 10.030 | 1.004 | ||||||
| 2026-01-05 | 13F | GoalVest Advisory LLC | 2.500 | 0,00 | 250 | -0,40 | ||||
| 2026-02-13 | 13F | Sei Investments Co | 1.501.021 | 1,34 | 150.267 | 1,03 | ||||
| 2026-02-05 | 13F | New York Life Investment Management Llc | 12.972 | -25,57 | 1.298 | -25,83 | ||||
| 2026-01-12 | 13F | VisionPoint Advisory Group, LLC | 2.398 | 240 | ||||||
| 2026-02-17 | 13F | Wiley Bros.-aintree Capital, Llc | 2.310 | -21,29 | 231 | -21,43 | ||||
| 2026-02-12 | 13F | CIBC Private Wealth Group, LLC | 126 | 13 | ||||||
| 2026-02-17 | 13F | Susquehanna International Group, Llp | 26.428 | 2.646 | ||||||
| 2026-01-09 | 13F | Peterson Wealth Advisors, LLC | 244.204 | 9,59 | 24.447 | 9,53 | ||||
| 2026-01-15 | 13F | SILVER OAK SECURITIES, Inc | 3.769 | 62,74 | 377 | 62,50 | ||||
| 2026-02-03 | 13F | We Are One Seven, LLC | 80.628 | 18,71 | 8.072 | 18,34 | ||||
| 2026-01-26 | 13F | San Luis Wealth Advisors LLC | 2.004 | -13,32 | 201 | -13,79 | ||||
| 2026-01-29 | 13F | Concurrent Investment Advisors, LLC | 19.356 | 2,96 | 1.938 | 2,65 | ||||
| 2026-02-02 | 13F | Truist Financial Corp | 71.765 | 3,87 | 7.184 | 3,55 | ||||
| 2026-01-28 | 13F | West Michigan Advisors, Llc | 5.967 | 1,02 | 599 | 1,01 | ||||
| 2026-02-04 | 13F | Ameritas Advisory Services, LLC | 5.413 | 542 | ||||||
| 2026-01-22 | 13F | K2 Financial Inc. | 6.062 | -1,94 | 607 | -1,94 | ||||
| 2026-01-13 | 13F | Signal Advisors Wealth, LLC | 2.114 | 212 | ||||||
| 2026-02-13 | 13F | Smartleaf Asset Management LLC | 41 | 4 | ||||||
| 2026-01-23 | 13F | Cantor Fitzgerald Investment Adviser L.p. | 8.960 | 8,47 | 897 | 8,08 | ||||
| 2026-01-21 | 13F | Sound Income Strategies, LLC | 397 | 40 | ||||||
| 2026-02-12 | 13F | Hrt Financial Lp | 8.402 | 139,31 | 1 | |||||
| 2026-02-13 | 13F | Gts Securities Llc | 6.113 | 106,87 | 612 | 106,42 | ||||
| 2025-09-29 | NP | BITS - Global X Blockchain & Bitcoin Strategy ETF This fund is a listed as child fund of Mirae Asset Global Investments Co., Ltd. and if that institution has disclosed ownership in this security, then these positions will not be double counted when calculating total shares and total value | 100.000 | 21,95 | 10.040 | 21,98 | ||||
| 2026-02-12 | 13F | Jane Street Group, Llc | 2.526 | -95,98 | 253 | -96,01 | ||||
| 2026-02-13 | 13F | Golden State Wealth Management, LLC | 142 | 6,77 | 14 | 7,69 | ||||
| 2026-01-21 | 13F | Hunter Associates Investment Management Llc | 2.443 | 0 | ||||||
| 2025-10-07 | 13F | Nova Wealth Management, Inc. | 0 | -100,00 | 0 | |||||
| 2026-01-28 | 13F | WPG Advisers, LLC | 876 | 2,46 | 88 | 2,35 | ||||
| 2026-02-12 | 13F | Principal Securities, Inc. | 4.767 | 10,22 | 477 | 9,91 | ||||
| 2026-01-16 | 13F | Pacific Sage Partners, LLC | 136.611 | 18,68 | 13.676 | 18,31 | ||||
| 2026-02-13 | 13F | Change Path, LLC | 16.282 | -0,41 | 1.630 | -0,73 | ||||
| 2026-02-06 | 13F | Wisconsin Capital Management Llc | 2.012 | -27,94 | 201 | -28,21 | ||||
| 2026-02-03 | 13F | SBI Securities Co., Ltd. | 12.135 | 216,02 | 1.215 | 215,32 | ||||
| 2026-02-17 | 13F | Perennial Investment Advisors, LLC | 97.758 | -10,48 | 9.787 | -10,76 | ||||
| 2026-02-17 | 13F | MIRAE ASSET GLOBAL ETFS HOLDINGS Ltd. | 144.060 | -5,94 | 14.422 | -6,24 | ||||
| 2026-02-06 | 13F | IFP Advisors, Inc | 1.508 | -1,50 | 151 | -1,96 | ||||
| 2026-02-10 | 13F | Pasadena Private Wealth, LLC | 0 | -100,00 | 0 | -100,00 | ||||
| 2026-02-17 | 13F | Tower Research Capital LLC (TRC) | 10.308 | 1.032 | ||||||
| 2025-11-07 | 13F | Wealth Alliance | 0 | -100,00 | 0 | |||||
| 2026-02-17 | 13F | Blair William & Co/il | 153 | 0,00 | 15 | 0,00 | ||||
| 2026-02-13 | 13F | Centaurus Financial, Inc. | 18.424 | 2 | ||||||
| 2026-02-18 | 13F | Beacon Pointe Advisors, LLC | 14.346 | 10,04 | 1.436 | 9,70 | ||||
| 2026-01-22 | 13F | Fiduciary Alliance LLC | 34.873 | 53,49 | 3.491 | 53,05 | ||||
| 2026-02-02 | 13F | FSA Advisors, Inc. | 45.688 | 67 | ||||||
| 2026-02-18 | 13F | Ark Wealth Advisors LLC | 57.691 | 5.775 | ||||||
| 2026-02-02 | 13F | Woodard & Co Asset Management Group Inc /adv | 89.693 | -14,12 | 8.979 | -14,39 | ||||
| 2026-02-12 | 13F | Woodley Farra Manion Portfolio Management Inc | 9.272 | -1,65 | 933 | -1,48 | ||||
| 2026-02-17 | 13F | Chicago Wealth Management, Inc. | 0 | -100,00 | 0 | |||||
| 2026-01-21 | 13F | Guild Investment Management, Inc. | 112.465 | 7,67 | 11.294 | 7,67 | ||||
| 2026-01-13 | 13F | Capital Investment Advisors, LLC | 719.536 | 36,96 | 72.033 | 36,54 | ||||
| 2026-01-20 | 13F | Stratos Wealth Partners, LTD. | 33.609 | 14,11 | 3.365 | 13,76 | ||||
| 2025-10-29 | 13F | Courier Capital Llc | 0 | -100,00 | 0 | |||||
| 2026-01-29 | 13F | D.a. Davidson & Co. | 39.711 | 4,94 | 3.975 | 4,61 | ||||
| 2026-02-13 | 13F | Financial Network Wealth Advisors LLC | 57.730 | 14,60 | 5.779 | 14,25 | ||||
| 2026-01-26 | 13F | AE Wealth Management LLC | 187 | -63,48 | 19 | -64,71 | ||||
| 2026-01-26 | 13F | United Advisor Group, LLC | 8.456 | 1,83 | 847 | 1,56 | ||||
| 2026-02-02 | 13F | B.O.S.S. Retirement Advisors, LLC | 13.601 | -36,12 | 1.362 | -36,34 | ||||
| 2026-02-17 | 13F | Advisor Group Holdings, Inc. | 102.549 | -15,12 | 10.268 | -15,38 | ||||
| 2026-01-14 | 13F | Accurate Wealth Management, LLC | 314.872 | -19,11 | 31.553 | -19,12 | ||||
| 2026-01-27 | 13F | Belpointe Asset Management LLC | 61.627 | -48,80 | 6.170 | -48,96 | ||||
| 2026-02-17 | 13F | Raymond James Financial Inc | 96.587 | 517,88 | 9.669 | 516,25 | ||||
| 2026-01-26 | 13F | Cwm, Llc | 13 | 0,00 | 0 | |||||
| 2026-01-26 | 13F | Nottingham Advisors, Inc. | 58.644 | 76,84 | 5.871 | 76,28 | ||||
| 2026-01-13 | 13F | Global X Japan Co., Ltd. | 0 | -100,00 | 0 | |||||
| 2026-02-11 | 13F | Convergence Financial, LLC | 64.134 | -7,20 | 6.420 | -7,48 | ||||
| 2026-02-12 | 13F | Steward Partners Investment Advisory, Llc | 54 | 5 | ||||||
| 2026-02-03 | 13F | Harel Insurance Investments & Financial Services Ltd. | 3.000.000 | 301 | ||||||
| 2026-02-10 | 13F | Weaver Consulting Group | 3.071 | -31,89 | 307 | -32,08 | ||||
| 2026-02-13 | 13F | Inspire Advisors, LLC | 70.710 | -14,12 | 7.079 | -14,39 | ||||
| 2026-01-20 | 13F | Stratos Wealth Advisors, LLC | 3.058 | 2,14 | 306 | 2,00 | ||||
| 2026-01-08 | 13F | Wealth Enhancement Advisory Services, Llc | 117.139 | 10,03 | 11.734 | 10,03 | ||||
| 2026-01-23 | 13F | Curtis Advisory Group, LLC | 117.186 | 33,30 | 11.731 | 32,90 | ||||
| 2026-02-13 | 13F | Stifel Financial Corp | 6.590 | -30,94 | 660 | -31,21 | ||||
| 2025-11-13 | 13F | Quadrature Capital Ltd | 0 | -100,00 | 0 | |||||
| 2026-02-06 | 13F | Mjp Associates Inc /adv | 355.079 | -11,28 | 35.547 | -11,55 | ||||
| 2026-02-17 | 13F | Advisory Services Network, LLC | 29.044 | -3,35 | 2.908 | -3,65 | ||||
| 2026-01-22 | 13F | Harwood Advisory Group, LLC | 119 | 0,00 | 12 | 0,00 | ||||
| 2026-01-23 | 13F | Farther Finance Advisors, LLC | 97.897 | 11,06 | 9.800 | 10,72 | ||||
| 2026-01-29 | 13F | Golden State Equity Partners | 0 | -100,00 | 0 | |||||
| 2026-02-05 | 13F | Soltis Investment Advisors LLC | 7.029 | 704 | ||||||
| 2026-02-17 | 13F/A | Kovack Advisors, Inc. | 11.758 | 1.177 | ||||||
| 2026-02-09 | 13F | Harbour Investments, Inc. | 108.491 | 8,57 | 10.861 | 8,23 | ||||
| 2026-02-11 | 13F | LPL Financial LLC | 837.428 | -5,85 | 83.835 | -6,14 | ||||
| 2026-02-10 | 13F | Goldman Sachs Group Inc | 9.171 | 918 | ||||||
| 2026-01-30 | 13F | Us Bancorp \de\ | 0 | -100,00 | 0 | |||||
| 2026-02-12 | 13F | Commonwealth Equity Services, Llc | 37.155 | -56,06 | 3.720 | 46.387,50 | ||||
| 2026-02-13 | 13F | Plum Street Advisors, LLC | 21.731 | 38,30 | 2.175 | 37,92 | ||||
| 2026-02-17 | 13F | Private Advisor Group, LLC | 60.198 | -12,58 | 6.026 | -12,84 | ||||
| 2025-11-06 | 13F | Whipplewood Advisors, LLC | 0 | -100,00 | 0 | |||||
| 2026-01-23 | 13F | Clear Creek Financial Management, LLC | 6.743 | 675 | ||||||
| 2026-01-21 | 13F | Newbridge Financial Services Group, Inc. | 250 | 0,00 | 25 | 0,00 | ||||
| 2026-01-27 | 13F | PFG Advisors | 6.528 | -3,82 | 654 | -4,11 | ||||
| 2026-01-28 | 13F | Chicago Partners Investment Group LLC | 2.991 | 300 | ||||||
| 2026-01-29 | 13F | UBS Group AG | 5.864 | 0,67 | 587 | 0,51 | ||||
| 2026-01-16 | 13F | Life Planning Partners, Inc | 35.474 | 17,31 | 3.551 | 16,96 | ||||
| 2026-02-13 | 13F | Flow Traders U.s. Llc | 0 | -100,00 | 0 | |||||
| 2026-01-30 | 13F | SOL Capital Management CO | 56.288 | 9,13 | 6 | 0,00 | ||||
| 2026-02-17 | 13F | IHT Wealth Management, LLC | 0 | -100,00 | 0 | |||||
| 2026-02-17 | 13F | Royal Bank Of Canada | 52.580 | 121,77 | 5.264 | 121,08 | ||||
| 2026-02-11 | 13F | O'shaughnessy Asset Management, Llc | 0 | -100,00 | 0 | |||||
| 2026-02-04 | 13F | Beverly Hills Private Wealth, LLC | 22.201 | 0,00 | 2.229 | 0,00 | ||||
| 2026-01-27 | 13F | 5T Wealth, LLC | 5.535 | 554 | ||||||
| 2026-02-06 | 13F | Global Retirement Partners, LLC | 4.103 | 1.166,36 | 411 | 1.181,25 | ||||
| 2026-02-17 | 13F | Running Point Capital Advisors, LLC | 36.693 | 29,91 | 3.673 | 29,51 | ||||
| 2025-11-14 | 13F | Two Sigma Securities, Llc | 0 | -100,00 | 0 | |||||
| 2026-02-06 | 13F | 3EDGE Asset Management, LP | 263.152 | 484,13 | 26.339 | 482,31 | ||||
| 2025-11-12 | 13F | Creekmur Asset Management LLC | 81.214 | 2,08 | 8.156 | 2,08 | ||||
| 2025-11-06 | 13F | Prospera Financial Services Inc | 0 | -100,00 | 0 | |||||
| 2026-02-17 | 13F | Equitable Holdings, Inc. | 0 | -100,00 | 0 | |||||
| 2026-01-15 | 13F | Highline Wealth Partners Llc | 59.886 | -2,01 | 5.995 | -2,30 | ||||
| 2026-02-17 | 13F | Citadel Advisors Llc | 0 | -100,00 | 0 | |||||
| 2026-02-12 | 13F | Resurgent Financial Advisors LLC | 8.037 | 33,48 | 805 | 33,11 | ||||
| 2026-02-17 | 13F | Bank Of America Corp /de/ | 55.351 | 7,36 | 5.541 | 7,03 |