Grundlæggende statistik
| Institutionelle ejere | 139 total, 139 long only, 0 short only, 0 long/short - change of 37,62% MRQ |
| Gennemsnitlig porteføljeallokering | 0.2482 % - change of 13,92% MRQ |
| Institutionelle aktier (lange) | 23.926.330 (ex 13D/G) - change of 7,78MM shares 48,17% MRQ |
| Institutionel værdi (lang) | $ 757.514 USD ($1000) |
Institutionelt ejerskab og aktionærer
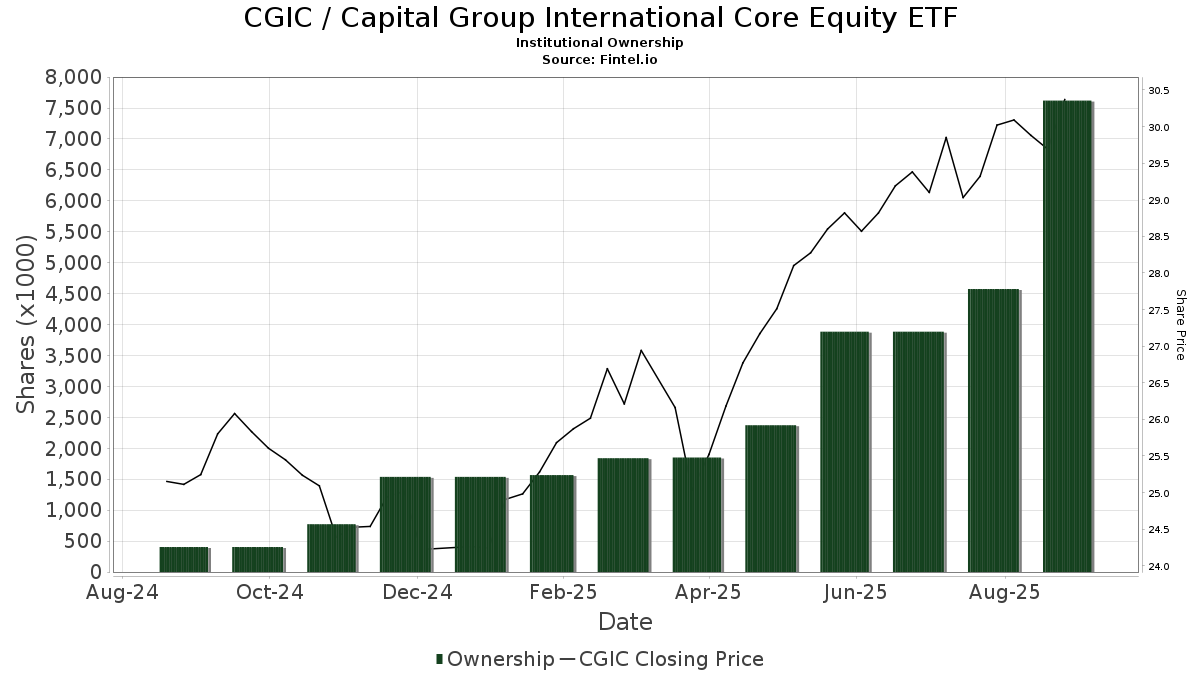
Capital Group International Core Equity ETF (US:CGIC) har 139 institutionelle ejere og aktionærer, der har indsendt 13D/G- eller 13F-formularer til Securities Exchange Commission (SEC). Disse institutioner har i alt 23,926,330 aktier. Største aktionærer omfatter LPL Financial LLC, Advisor Group Holdings, Inc., Raymond James Financial Inc, Capital Group Private Client Services, Inc., Envestnet Asset Management Inc, Merit Financial Group, LLC, Amplius Wealth Advisors, LLC, Royal Bank Of Canada, Commonwealth Equity Services, Llc, and Cetera Investment Advisers .
Capital Group International Core Equity ETF (ARCA:CGIC) institutionel ejerskabsstruktur viser aktuelle positioner i virksomheden efter institutioner og fonde, samt seneste ændringer i positionsstørrelse. Større aktionærer kan omfatte individuelle investorer, investeringsforeninger, hedgefonde eller institutioner. Skema 13D angiver, at investoren besidder (eller besidder) mere end 5 % af virksomheden og har til hensigt (eller har til hensigt at) aktivt at forfølge en ændring i forretningsstrategi. Skema 13G indikerer en passiv investering på over 5%.
The share price as of March 9, 2026 is 33,92 / share. Previously, on March 10, 2025, the share price was 26,10 / share. This represents an increase of 29,98% over that period.
Fondens stemningsscore
Fund Sentiment Score (fka Ownership Accumulation Score) finder de aktier, der bliver mest købt af fonde. Det er resultatet af en sofistikeret, multi-faktor kvantitativ model, der identificerer virksomheder med de højeste niveauer af institutionel akkumulering. Scoringsmodellen bruger en kombination af den samlede stigning i oplyste ejere, ændringerne i porteføljeallokeringer i disse ejere og andre målinger. Tallet går fra 0 til 100, hvor højere tal indikerer et højere niveau af akkumulering for sine jævnaldrende, og 50 er gennemsnittet.
Opdateringsfrekvens: Dagligt
Se Ownership Explorer, som giver en liste over højest rangerende virksomheder.
AI+ Ask Fintel’s AI assistant about Capital Group International Core Equity ETF.
Select a question to share a public post with an AI-crafted answer.
Thinking of good questions…
Institutionel Put/Call-forhold
Ud over at indberette standardaktie- og gældsudstedelser skal institutter med mere end 100 mill. aktiver under forvaltning også oplyse deres put- og call-optionsbeholdninger. Da salgsoptioner generelt indikerer negativ stemning, og købsoptioner indikerer positiv stemning, kan vi få en fornemmelse af den overordnede institutionelle stemning ved at plotte forholdet mellem put og kald. Diagrammet til højre viser det historiske put/call-forhold for dette instrument.
Brug af Put/Call Ratio som en indikator for investorernes stemning overvinder en af de vigtigste mangler ved at bruge totalt institutionelt ejerskab, som er, at en betydelig mængde af aktiver under forvaltning investeres passivt for at spore indekser. Passivt forvaltede fonde køber typisk ikke optioner, så indikatoren for put/call-forholdet følger mere nøje følelsen af aktivt forvaltede fonde.
13F og NPORT arkivering
Detaljer om 13F-arkivering er gratis. Detaljer om NP-ansøgninger kræver et premium-medlemskab. Grønne rækker angiver nye positioner. Røde rækker angiver lukkede positioner. Klik på linket ikon for at se den fulde transaktionshistorik.
Opgrader
for at låse premium-data op og eksportere til Excel ![]() .
.
| Fil dato | Kilde | Investor | Type | Gennemsnitlig pris (Øst) |
Aktier | Δ Aktier (%) |
Rapporteret Værdi ($1000) |
Δ Værdi (%) |
Port Alloc (%) |
|
|---|---|---|---|---|---|---|---|---|---|---|
| 2026-02-09 | 13F | Kingsview Wealth Management, LLC | 34.239 | 1.113 | ||||||
| 2026-02-17 | 13F | Raymond James Financial Inc | 2.304.847 | 75,69 | 74.908 | 85,33 | ||||
| 2026-01-12 | 13F | KWB Wealth | 21.818 | 709 | ||||||
| 2026-01-26 | 13F | Prosperity Financial Group, Inc. | 51.478 | 1.673 | ||||||
| 2026-01-29 | 13F | Aprio Wealth Management, LLC | 64.591 | 2.099 | ||||||
| 2026-01-30 | 13F | Strategic Blueprint, LLC | 68.926 | -82,37 | 2.240 | -81,41 | ||||
| 2026-02-13 | 13F | BNB Wealth Management, LLC | 111.043 | 3.609 | ||||||
| 2026-01-28 | 13F | Geneos Wealth Management Inc. | 24.188 | 624,63 | 786 | 670,59 | ||||
| 2026-02-10 | 13F | Acorn Wealth Advisors, LLC | 130.268 | 85,54 | 4.234 | 95,70 | ||||
| 2026-02-09 | 13F | Annis Gardner Whiting Capital Advisors, LLC | 337 | 16,61 | 11 | 25,00 | ||||
| 2026-02-06 | 13F | Plan A Wealth LLC | 8.886 | 289 | ||||||
| 2026-02-17 | 13F | Royal Bank Of Canada | 819.485 | 74,91 | 26.633 | 84,50 | ||||
| 2026-02-02 | 13F | Benjamin Edwards Inc | 38.154 | 174,23 | 1.240 | 189,49 | ||||
| 2026-02-13 | 13F | Integrated Wealth Concepts LLC | 6.231 | 203 | ||||||
| 2026-02-13 | 13F | Brown Advisory Inc | 8.332 | 20,23 | 271 | 26,76 | ||||
| 2026-02-12 | 13F | Great Valley Advisor Group, Inc. | 44.191 | 61,48 | 1.436 | 70,55 | ||||
| 2026-02-10 | 13F | Sittner & Nelson, Llc | 35.415 | 229,69 | 1.241 | 276,06 | ||||
| 2026-02-09 | 13F | Prospera Financial Services Inc | 6.176 | -58,68 | 201 | -56,52 | ||||
| 2026-02-10 | 13F | Swisher Financial Concepts, Inc. | 32.231 | -1,40 | 1.048 | 3,97 | ||||
| 2026-02-06 | 13F | HighTower Advisors, LLC | 15.683 | 40,20 | 510 | 47,97 | ||||
| 2026-02-13 | 13F | Centaurus Financial, Inc. | 40.178 | -33,71 | 1 | 0,00 | ||||
| 2026-02-11 | 13F | Capital International Investors | 20.128 | -49,84 | 654 | -47,09 | ||||
| 2026-02-02 | 13F | Souders Financial Advisors | 375.228 | 4,09 | 12.195 | 9,80 | ||||
| 2026-01-23 | 13F | Assetmark, Inc | 58.579 | 167,74 | 1.904 | 182,34 | ||||
| 2026-03-03 | 13F | NWF Advisory Services Inc. | 44.917 | -56,69 | 1.460 | -54,33 | ||||
| 2026-02-12 | 13F | Steward Partners Investment Advisory, Llc | 241.491 | 7,58 | 7.848 | 13,48 | ||||
| 2025-10-08 | 13F | Patriot Financial Group Insurance Agency, LLC | 0 | -100,00 | 0 | -100,00 | ||||
| 2026-01-26 | 13F | Tribridge Partners Financial LLC | 7.668 | 0,00 | 249 | 4,62 | ||||
| 2026-01-28 | 13F | Schmidt P J Investment Management Inc | 28.841 | 937 | ||||||
| 2026-02-13 | 13F | Advyzon Investment Management, LLC | 12.800 | 0,75 | 416 | 6,14 | ||||
| 2026-02-05 | 13F | PCG Wealth Advisors, LLC | 15.940 | 0,46 | 518 | 6,15 | ||||
| 2026-02-09 | 13F | Rhl Group, Llc | 2.584 | 84 | ||||||
| 2026-02-17 | 13F | Cetera Investment Advisers | 572.235 | 255,61 | 18.598 | 275,17 | ||||
| 2026-01-14 | 13F | ORG Partners LLC | 57.580 | 15,16 | 1.871 | 7,53 | ||||
| 2026-02-11 | 13F | LPL Financial LLC | 2.778.105 | 96,42 | 90.288 | 107,19 | ||||
| 2026-02-27 | 13F | Strategic Investment Solutions, Inc. /IL | 500 | 0,00 | 16 | 6,67 | ||||
| 2025-11-12 | 13F | Ameriflex Group, Inc. | 0 | -100,00 | 0 | |||||
| 2026-02-06 | 13F | Cullen/frost Bankers, Inc. | 1.861 | 7,51 | 60 | 13,21 | ||||
| 2026-02-06 | 13F | EverSource Wealth Advisors, LLC | 6.460 | 61,14 | 210 | 69,92 | ||||
| 2026-01-20 | 13F | AdvisorNet Financial, Inc | 7.083 | 59,28 | 230 | 67,88 | ||||
| 2026-02-10 | 13F | Envestnet Asset Management Inc | 1.205.760 | 174,67 | 39.187 | 189,74 | ||||
| 2026-01-29 | 13F | Kestra Private Wealth Services, Llc | 15.737 | 61,36 | 511 | 70,33 | ||||
| 2026-02-06 | 13F | Envestnet Portfolio Solutions, Inc. | 38.539 | 1.253 | ||||||
| 2026-02-12 | 13F | Hrt Financial Lp | 16.498 | 1 | ||||||
| 2026-02-02 | 13F | Oppenheimer & Co Inc | 7.913 | -6,74 | 257 | -1,53 | ||||
| 2026-02-02 | 13F | Mutual Advisors, LLC | 61.377 | 1,73 | 1.995 | 6,23 | ||||
| 2026-02-13 | 13F | MAI Capital Management | 356 | 0,00 | 12 | 10,00 | ||||
| 2026-01-13 | 13F | Capital Investment Advisors, LLC | 66.619 | 87,47 | 2.165 | 97,90 | ||||
| 2026-02-05 | 13F | Financial Council Asset Management Inc | 15.559 | 506 | ||||||
| 2026-01-21 | 13F/A | Main Line Retirement Advisors, LLC | 36.919 | 21,53 | 1.200 | 28,24 | ||||
| 2026-01-29 | 13F | Comerica Bank | 471 | 15 | ||||||
| 2026-02-17 | 13F | Susquehanna International Group, Llp | 156.153 | 1.467,80 | 5.075 | 1.558,17 | ||||
| 2026-01-26 | 13F | CMC Financial Group | 112.804 | -1,22 | 3.666 | 4,21 | ||||
| 2026-02-04 | 13F | Pensionmark Financial Group, Llc | 34.399 | 54,10 | 982 | 42,94 | ||||
| 2026-02-09 | 13F | Harbour Investments, Inc. | 20.721 | 247,03 | 673 | 267,76 | ||||
| 2026-02-17 | 13F | Advisory Services Network, LLC | 27.254 | 886 | ||||||
| 2026-02-17 | 13F | Wiley Bros.-aintree Capital, Llc | 111.237 | 739,14 | 3.854 | 844,61 | ||||
| 2026-01-08 | 13F | Sar Wealth Management Group, Llc | 151.551 | 7,24 | 4.925 | 13,11 | ||||
| 2026-01-30 | 13F | Sigma Planning Corp | 7.415 | 0,07 | 241 | 5,26 | ||||
| 2026-02-13 | 13F | Gts Securities Llc | 31.060 | 256,77 | 1.009 | 276,49 | ||||
| 2026-01-28 | 13F | Ai Financial Services Llc | 16.116 | 3,02 | 524 | 7,84 | ||||
| 2026-02-03 | 13F | McIlrath & Eck, LLC | 4.880 | 159 | ||||||
| 2026-02-17 | 13F | Cape Investment Advisory, Inc. | 3.601 | 111,33 | 117 | 125,00 | ||||
| 2026-01-27 | 13F | Berger Financial Group, Inc | 15.592 | 88,88 | 507 | 99,21 | ||||
| 2026-02-13 | 13F | Tudor Financial Inc. | 11.528 | 43,10 | 375 | 50,81 | ||||
| 2026-02-10 | 13F | Founders Financial Securities Llc | 14.833 | 0,00 | 482 | 5,47 | ||||
| 2026-02-17 | 13F | Citadel Advisors Llc | 47.146 | -75,85 | 1.532 | -74,53 | ||||
| 2026-02-13 | 13F | Venture Visionary Partners LLC | 7.647 | 0,00 | 249 | 5,53 | ||||
| 2026-01-08 | 13F | Sound View Wealth Advisors Group, LLC | 201.960 | 38,09 | 6.564 | 45,65 | ||||
| 2026-02-17 | 13F | Equitable Holdings, Inc. | 51.839 | 44,82 | 1.685 | 52,81 | ||||
| 2025-11-03 | 13F | Pines Wealth Management, LLC | 0 | -100,00 | 0 | |||||
| 2026-02-13 | 13F | Stifel Financial Corp | 464.113 | 7,54 | 15.084 | 13,44 | ||||
| 2026-02-11 | 13F | Capital Group Private Client Services, Inc. | 1.642.755 | 44,04 | 53.390 | 51,94 | ||||
| 2026-01-15 | 13F | Cassilly Financial Group LLC | 8.507 | 276 | ||||||
| 2026-02-13 | 13F | Arkadios Wealth Advisors | 23.365 | 759 | ||||||
| 2026-02-13 | 13F | Wells Fargo & Company/mn | 398.873 | 743,52 | 12.963 | 790,32 | ||||
| 2026-02-18 | 13F | GWM Advisors LLC | 483.756 | 1,68 | 15.722 | 7,26 | ||||
| 2026-02-04 | 13F | Meridian Wealth Management, LLC | 23.855 | 0,00 | 775 | 5,59 | ||||
| 2026-02-13 | 13F | Flow Traders U.s. Llc | 0 | -100,00 | 0 | |||||
| 2026-01-23 | 13F | Farther Finance Advisors, LLC | 223.610 | 16,90 | 7.267 | 23,32 | ||||
| 2026-02-13 | 13F | Baird Financial Group, Inc. | 130.957 | 7,68 | 4.256 | 13,58 | ||||
| 2026-02-02 | 13F | Truist Financial Corp | 14.860 | 87,01 | 483 | 97,54 | ||||
| 2026-01-28 | 13F | Confluence Wealth Services, Inc. | 155.241 | 1.213,71 | 5.045 | 1.285,99 | ||||
| 2026-02-10 | 13F | Thoroughbred Financial Services, Llc | 10.853 | 0 | ||||||
| 2026-01-26 | 13F | Cwm, Llc | 9.131 | 0,00 | 0 | |||||
| 2026-02-10 | 13F/A | Northwestern Mutual Wealth Management Co | 329.862 | 66,29 | 10.721 | 75,42 | ||||
| 2026-02-12 | 13F | Gerber Kawasaki Wealth & Investment Management | 48.560 | 57,85 | 1.578 | 66,63 | ||||
| 2026-02-05 | 13F | Cambridge Investment Research Advisors, Inc. | 512.312 | 15,04 | 17 | 23,08 | ||||
| 2026-02-12 | 13F | Commonwealth Equity Services, Llc | 781.098 | 67,68 | 25.386 | 181.221,43 | ||||
| 2026-01-21 | 13F | Sowell Financial Services LLC | 21.785 | 708 | ||||||
| 2026-02-13 | 13F | Beacon Financial Advisory LLC | 10.202 | 332 | ||||||
| 2026-01-12 | 13F | DAVENPORT & Co LLC | 25.798 | 838 | ||||||
| 2026-01-14 | 13F | Redhawk Wealth Advisors, Inc. | 9.765 | 317 | ||||||
| 2026-02-17 | 13F | Advisor Group Holdings, Inc. | 2.368.482 | 14,75 | 76.976 | 23,01 | ||||
| 2026-01-09 | 13F | First Heartland Consultants, Inc. | 321.636 | 3,72 | 10.453 | 9,42 | ||||
| 2026-02-13 | 13F | Kestra Advisory Services, LLC | 0 | -100,00 | 0 | |||||
| 2026-02-12 | 13F | Jane Street Group, Llc | 180.781 | 47,11 | 5.875 | 55,18 | ||||
| 2026-02-11 | 13F | Greykasell Wealth Strategies, Inc. | 886 | 57,37 | 29 | 64,71 | ||||
| 2026-01-21 | 13F | Landaas & Co /wi /adv | 23.736 | 107,94 | 771 | 119,03 | ||||
| 2026-02-13 | 13F | SRS Capital Advisors, Inc. | 1.066 | 35 | ||||||
| 2026-02-10 | 13F | Rothschild Investment Llc | 1.700 | 55 | ||||||
| 2026-02-12 | 13F | Summit Financial, LLC | 114.864 | 19,86 | 3.733 | 26,46 | ||||
| 2026-02-04 | 13F | Certior Financial Group, Llc | 13.446 | 61,77 | 437 | 70,31 | ||||
| 2026-01-07 | 13F | Central Pacific Bank - Trust Division | 35 | 1 | ||||||
| 2026-02-17 | 13F | Fmr Llc | 1 | 0 | ||||||
| 2026-01-23 | 13F | Smith, Moore & Co. | 8.318 | 270 | ||||||
| 2026-01-23 | 13F | U.S. Capital Wealth Advisors, LLC | 28.185 | 48,99 | 916 | 57,39 | ||||
| 2026-02-17 | 13F | Captrust Financial Advisors | 51.633 | 30,46 | 1.678 | 37,65 | ||||
| 2026-02-06 | 13F | Gutierrez Wealth Advisory, LLC | 12.800 | 0,75 | 416 | 6,14 | ||||
| 2026-02-10 | 13F | Florida Financial Advisors, Llc | 7.485 | 13,39 | 243 | 19,70 | ||||
| 2026-01-21 | 13F | BIP Wealth, LLC | 300.817 | 9.777 | ||||||
| 2026-01-23 | 13F | Westside Investment Management, Inc. | 3.250 | 106 | ||||||
| 2026-02-12 | 13F | Rossby Financial, LCC | 133 | 4 | ||||||
| 2026-01-29 | 13F | D.a. Davidson & Co. | 343.258 | 104,30 | 11.156 | 115,51 | ||||
| 2026-02-13 | 13F | Tcfg Wealth Management, Llc | 22.029 | 7,38 | 716 | 13,13 | ||||
| 2026-01-20 | 13F | Steel Peak Wealth Management LLC | 10.586 | 344 | ||||||
| 2026-02-11 | 13F | Capital Analysts, Inc. | 11.479 | 29,97 | 0 | |||||
| 2026-02-17 | 13F/A | Sentinus, LLC | 74.090 | 2.408 | ||||||
| 2026-02-11 | 13F | Janney Montgomery Scott LLC | 26.677 | 80,89 | 1 | |||||
| 2026-02-10 | 13F | Cercano Management LLC | 32.733 | 0,00 | 1.064 | 5,46 | ||||
| 2026-01-08 | 13F | Cooper Financial Group | 12.289 | 399 | ||||||
| 2026-02-17 | 13F | Signature Equity Partners, LLC | 326 | 11 | ||||||
| 2026-01-08 | 13F | Wealth Enhancement Advisory Services, Llc | 10.992 | 15,04 | 368 | 24,32 | ||||
| 2026-01-13 | 13F | NerdWallet Wealth Partners, LLC | 30.306 | 985 | ||||||
| 2026-01-22 | 13F | Vicus Capital | 81.810 | -8,81 | 2.659 | -3,84 | ||||
| 2026-02-17 | 13F | Old Mission Capital Llc | 189.798 | 36,89 | 6.168 | 44,42 | ||||
| 2026-01-21 | 13F | Sound Income Strategies, LLC | 6 | 0 | ||||||
| 2026-02-12 | 13F | Brinker Capital Investments, LLC | 92.729 | 18,36 | 3.014 | 24,87 | ||||
| 2026-01-12 | 13F | Amplius Wealth Advisors, LLC | 1.032.666 | 1,62 | 33.562 | 7,19 | ||||
| 2026-02-13 | 13F | Mml Investors Services, Llc | 516.825 | 15,16 | 16.797 | 21,48 | ||||
| 2026-02-17 | 13F | Private Advisor Group, LLC | 200.388 | 139,51 | 6.513 | 152,70 | ||||
| 2026-01-27 | 13F | GHP Investment Advisors, Inc. | 700 | 23 | ||||||
| 2026-02-24 | 13F | Astoria Portfolio Advisors LLC. | 11.480 | 410 | ||||||
| 2026-02-12 | 13F | Principal Securities, Inc. | 0 | -100,00 | 0 | |||||
| 2026-01-26 | 13F | Merit Financial Group, LLC | 1.114.156 | 2,90 | 36.210 | 8,55 | ||||
| 2026-02-11 | 13F | Jpmorgan Chase & Co | 1.020 | -29,12 | 33 | -25,00 | ||||
| 2026-02-17 | 13F | LaSalle St. Investment Advisors, LLC | 8.462 | 0 | ||||||
| 2025-11-10 | 13F | Siligmueller & Norvid Wealth Advisors LLC | 0 | -100,00 | 0 | |||||
| 2026-02-17 | 13F | Jones Financial Companies Lllp | 256.900 | 392,96 | 8.349 | 422,79 | ||||
| 2026-01-14 | 13F | Spire Wealth Management | 253 | 0,40 | 8 | 14,29 | ||||
| 2026-01-15 | 13F | Lodestone Wealth Management LLC | 2.096 | 68 | ||||||
| 2026-02-10 | 13F | Natixis Advisors, L.p. | 21.199 | 1 | ||||||
| 2026-01-16 | 13F | Armstrong, Fleming & Moore, Inc | 16.319 | 0,00 | 530 | 5,58 | ||||
| 2026-01-30 | 13F | Barnes Pettey Financial Advisors, Llc | 15.466 | 503 | ||||||
| 2026-01-30 | 13F | SK Wealth Management, LLC | 416.097 | 1.314,33 | 14.580 | 1.503,96 | ||||
| 2026-02-12 | 13F | Titleist Asset Management, Llc | 12.502 | 406 |