Grundlæggende statistik
| Institutionelle aktier (lange) | 168.907.655 - 38,42% (ex 13D/G) - change of 11,62MM shares 7,39% MRQ |
| Institutionel værdi (lang) | $ 1.269.008 USD ($1000) |
Institutionelt ejerskab og aktionærer
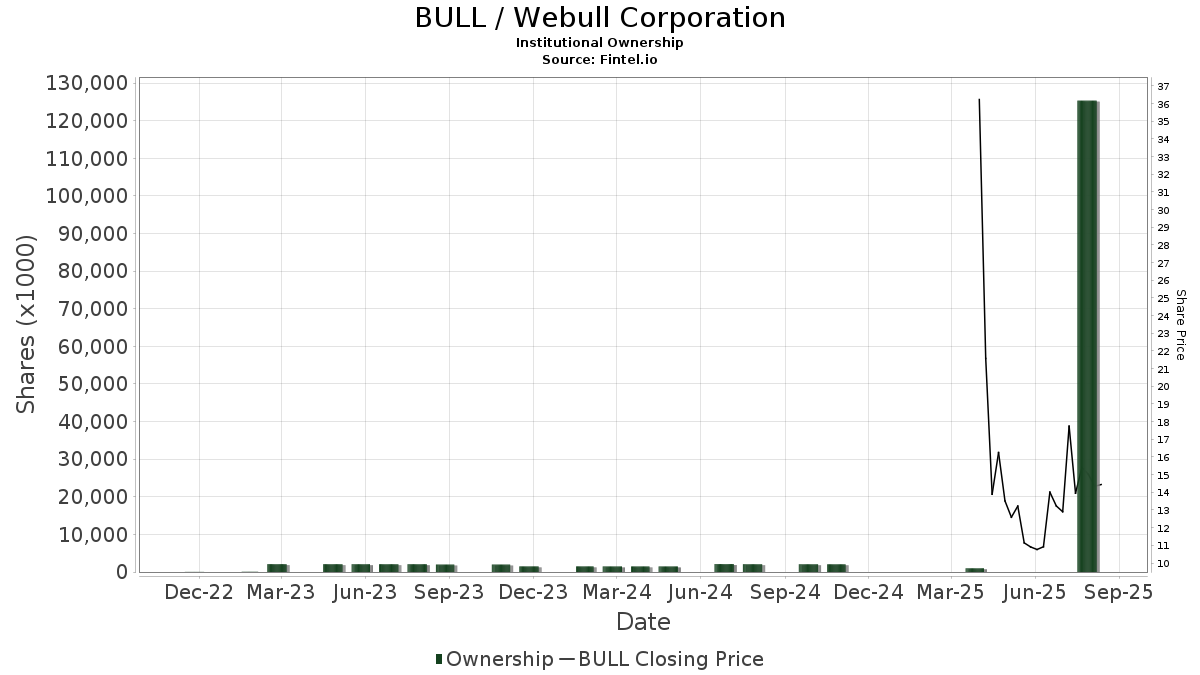
Webull Corporation (US:BULL) har 164 institutionelle ejere og aktionærer, der har indsendt 13D/G- eller 13F-formularer til Securities Exchange Commission (SEC). Disse institutioner har i alt 168,907,655 aktier. Største aktionærer omfatter Susquehanna International Group, Llp, Peak6 Llc, BlackRock, Inc., HS Investments IV Ltd, SC CHINA HOLDING Ltd, Tiger Global Management Llc, Citadel Advisors Llc, Hillhouse Capital Advisors, Ltd., Yong Rong (HK) Asset Management Ltd, and Citadel Advisors Llc .
Webull Corporation (NasdaqCM:BULL) institutionel ejerskabsstruktur viser aktuelle positioner i virksomheden efter institutioner og fonde, samt seneste ændringer i positionsstørrelse. Større aktionærer kan omfatte individuelle investorer, investeringsforeninger, hedgefonde eller institutioner. Skema 13D angiver, at investoren besidder (eller besidder) mere end 5 % af virksomheden og har til hensigt (eller har til hensigt at) aktivt at forfølge en ændring i forretningsstrategi. Skema 13G indikerer en passiv investering på over 5%.
The share price as of March 16, 2026 is 5,31 / share. Previously, on April 11, 2025, the share price was 13,25 / share. This represents a decline of 59,92% over that period.
Fondens stemningsscore
Fund Sentiment Score (fka Ownership Accumulation Score) finder de aktier, der bliver mest købt af fonde. Det er resultatet af en sofistikeret, multi-faktor kvantitativ model, der identificerer virksomheder med de højeste niveauer af institutionel akkumulering. Scoringsmodellen bruger en kombination af den samlede stigning i oplyste ejere, ændringerne i porteføljeallokeringer i disse ejere og andre målinger. Tallet går fra 0 til 100, hvor højere tal indikerer et højere niveau af akkumulering for sine jævnaldrende, og 50 er gennemsnittet.
Opdateringsfrekvens: Dagligt
Se Ownership Explorer, som giver en liste over højest rangerende virksomheder.
AI+ Ask Fintel’s AI assistant about Webull Corporation.
Select a question to share a public post with an AI-crafted answer.
Thinking of good questions…
Institutionel Put/Call-forhold
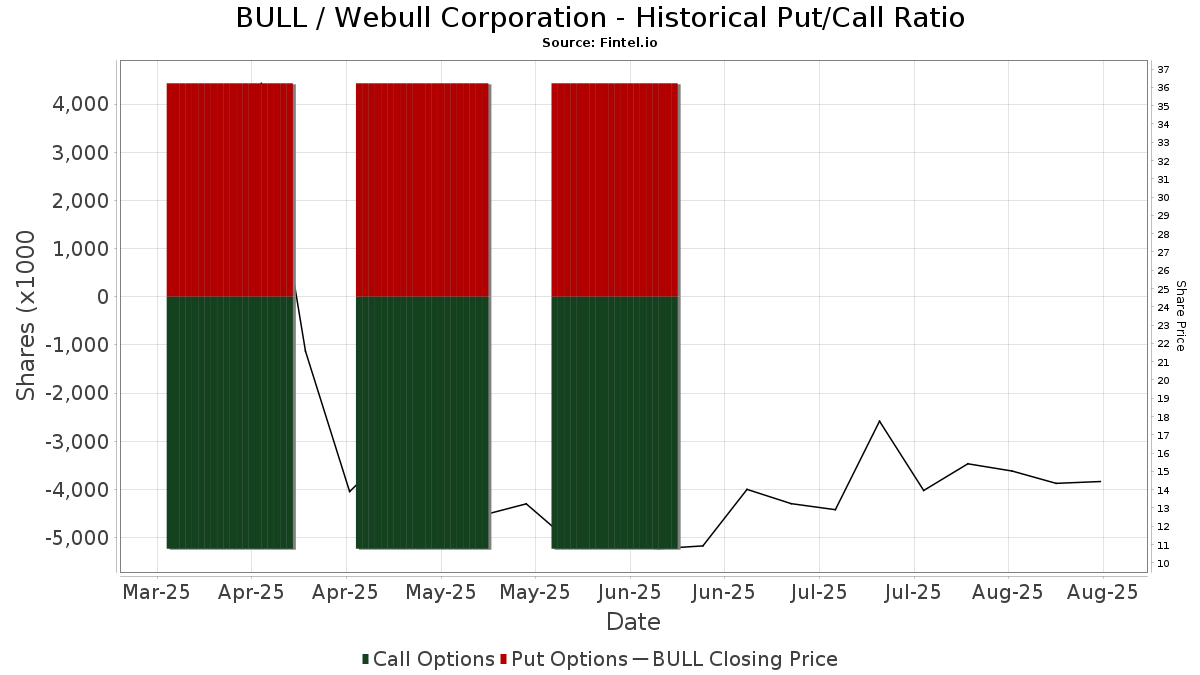
Ud over at indberette standardaktie- og gældsudstedelser skal institutter med mere end 100 mill. aktiver under forvaltning også oplyse deres put- og call-optionsbeholdninger. Da salgsoptioner generelt indikerer negativ stemning, og købsoptioner indikerer positiv stemning, kan vi få en fornemmelse af den overordnede institutionelle stemning ved at plotte forholdet mellem put og kald. Diagrammet til højre viser det historiske put/call-forhold for dette instrument.
Brug af Put/Call Ratio som en indikator for investorernes stemning overvinder en af de vigtigste mangler ved at bruge totalt institutionelt ejerskab, som er, at en betydelig mængde af aktiver under forvaltning investeres passivt for at spore indekser. Passivt forvaltede fonde køber typisk ikke optioner, så indikatoren for put/call-forholdet følger mere nøje følelsen af aktivt forvaltede fonde.
13D/G-arkivering
Vi præsenterer 13D/G ansøgninger separat fra 13F ansøgninger på grund af den forskellige behandling af SEC. 13D/G-ansøgninger kan indgives af grupper af investorer (med én ledende), hvorimod 13F-ansøgninger ikke kan. Dette resulterer i situationer, hvor en investor kan indsende en 13D/G, der rapporterer én værdi for de samlede aktier (der repræsenterer alle de aktier, der ejes af investorgruppen), men derefter indsender en 13F, der rapporterer en anden værdi for de samlede aktier (der udelukkende repræsenterer deres egne) ejendomsret). Det betyder, at aktieejerskab af 13D/G-arkiver og 13F-arkiveringer ofte ikke er direkte sammenlignelige, så vi præsenterer dem separat.
Bemærk: Fra den 16. maj 2021 viser vi ikke længere ejere, der ikke har indsendt en 13D/G inden for det seneste år. Tidligere viste vi den fulde historie af 13D/G-arkiver. Generelt skal enheder, der er forpligtet til at indgive 13D/G-ansøgninger, indgive mindst årligt, før de indsender en afsluttende ansøgning. Dog forlader fonde nogle gange positioner uden at indsende en afsluttende ansøgning (dvs. de afvikler), så visning af den fulde historie resulterede nogle gange i forvirring om det nuværende ejerskab. For at undgå forvirring viser vi nu kun 'aktuelle' ejere - det vil sige - ejere, der har anmeldt inden for det seneste år.
Upgrade to unlock premium data.
| Fil dato | Form | Investor | Forrige Aktier |
Seneste Aktier |
Δ Aktier (Procent) |
Ejendomsret (Procent) |
Δ Ejerskab (Procent) |
|
|---|---|---|---|---|---|---|---|---|
| 2026-02-17 | HS Investments IV Ltd | 28,592,200 | 15,060,036 | -47.33 | 3.60 | -49.44 | ||
| 2026-02-13 | Wang Anquan | 103,194,966 | 96,218,814 | -6.76 | 19.10 | -8.17 | ||
| 2026-02-13 | Lishui Bojiang Chuangfu 2nd Equity Investment Partnership (Limited Partnership) | 29,151,428 | 21,863,571 | -25.00 | 5.20 | -28.77 | ||
| 2026-02-11 | PEAK6 Capital Management LLC | 28,183,470 | 6.70 | |||||
| 2026-02-10 | PEAK6 LLC | 26,567,832 | 28,183,470 | 6.08 | 6.70 | 21.82 | ||
| 2025-08-18 | Yuan Jun | 29,758,301 | 7.40 | |||||
| 2025-08-14 | SIG Asia Investment, LLLP | 24,152,813 | 6.40 | |||||
| 2025-08-12 | Tianjin Nuofeng Enterprise Management Consulting Partnership (Limited Partnership) | 37,594,146 | 9.40 |
13F og NPORT arkivering
Detaljer om 13F-arkivering er gratis. Detaljer om NP-ansøgninger kræver et premium-medlemskab. Grønne rækker angiver nye positioner. Røde rækker angiver lukkede positioner. Klik på linket ikon for at se den fulde transaktionshistorik.
Opgrader
for at låse premium-data op og eksportere til Excel ![]() .
.
| Fil dato | Kilde | Investor | Type | Gennemsnitlig pris (Øst) |
Aktier | Δ Aktier (%) |
Rapporteret Værdi ($1000) |
Δ Værdi (%) |
Port Alloc (%) |
|
|---|---|---|---|---|---|---|---|---|---|---|
| 2026-02-13 | 13F | Parkside Financial Bank & Trust | 225 | 2 | ||||||
| 2026-02-11 | 13F | Ameritas Investment Partners, Inc. | 22.170 | 172 | ||||||
| 2026-02-17 | 13F | Atom Investors LP | 139.917 | 1.087 | ||||||
| 2026-02-17 | 13F | Cetera Investment Advisers | 12.861 | 100 | ||||||
| 2026-02-10 | 13F | Goldman Sachs Group Inc | 2.675.558 | 882,88 | 20.789 | 416,37 | ||||
| 2025-11-14 | 13F | Binnacle Investments Inc | 1.650 | 24 | ||||||
| 2026-01-23 | 13F | Farther Finance Advisors, LLC | 400 | 0,00 | 3 | -40,00 | ||||
| 2026-01-16 | 13F | Ronald Blue Trust, Inc. | 32 | 0 | ||||||
| 2026-02-09 | 13F | Rooted Wealth Advisors, Inc. | 12.500 | 84 | ||||||
| 2026-02-17 | 13F | Millennium Management Llc | Put | 0 | -100,00 | 0 | -100,00 | |||
| 2026-02-17 | 13F | Millennium Management Llc | Call | 0 | -100,00 | 0 | -100,00 | |||
| 2026-01-23 | 13F | Lunate Capital Ltd | 0 | -100,00 | 0 | -100,00 | ||||
| 2026-02-18 | 13F | Mackenzie Financial Corp | 16.905 | 134 | ||||||
| 2026-02-17 | 13F | Millennium Management Llc | 3.433.314 | 1.351,03 | 26.677 | 662,39 | ||||
| 2026-02-17 | 13F | LMR Partners LLP | Call | 100.000 | 777 | |||||
| 2026-02-09 | 13F | SLT Holdings LLC | Call | 10.000 | 0,00 | 78 | -47,62 | |||
| 2026-01-05 | 13F | GAMMA Investing LLC | 596 | 5 | ||||||
| 2026-02-23 | 13F | Virtu Financial LLC | 102.889 | 1 | ||||||
| 2026-02-17 | 13F | Magnetar Financial LLC | 113.485 | 882 | ||||||
| 2026-02-12 | 13F | Jane Street Group, Llc | Call | 3.892.100 | 29,52 | 30.242 | -31,96 | |||
| 2026-02-12 | 13F | Jane Street Group, Llc | 3.082.421 | 1.905,75 | 23.950 | 954,14 | ||||
| 2025-11-14 | 13F | Sassicaia Capital Advisers Llc | 0 | -100,00 | 0 | -100,00 | ||||
| 2026-02-12 | 13F | Jane Street Group, Llc | Put | 1.291.000 | -6,70 | 10.031 | -50,98 | |||
| 2026-02-09 | 13F | SLT Holdings LLC | 0 | -100,00 | 0 | -100,00 | ||||
| 2026-02-11 | 13F | Winton Capital Group Ltd | 418.317 | 319,19 | 3.250 | 120,34 | ||||
| 2026-02-10 | 13F | Quantbot Technologies LP | 333.886 | 2.594 | ||||||
| 2026-02-13 | 13F | Charles Schwab Investment Management Inc | 677.815 | 5.267 | ||||||
| 2026-02-17 | 13F | Tiger Global Management Llc | 6.724.137 | -42,65 | 52.247 | -69,87 | ||||
| 2026-02-03 | 13F | Mitsubishi UFJ Kokusai Asset Management Co., Ltd. | 21.064 | 173 | ||||||
| 2026-02-12 | 13F | MetLife Investment Management, LLC | 151.426 | 1.177 | ||||||
| 2026-02-17 | 13F | Equitable Holdings, Inc. | 12.950 | -47,50 | 101 | -72,53 | ||||
| 2026-02-06 | 13F | Larson Financial Group LLC | 585 | 5 | ||||||
| 2026-02-17 | 13F | Fmr Llc | 15.990 | 124 | ||||||
| 2026-02-17 | 13F | Quadrature Capital Ltd | 23.995 | -95,16 | 186 | -97,46 | ||||
| 2026-02-02 | 13F | Truist Financial Corp | 30.110 | 281 | ||||||
| 2026-02-09 | 13F | Legal & General Group Plc | 24.890 | 1.305,42 | 193 | 642,31 | ||||
| 2026-02-17 | 13F | Creative Planning | 10.000 | 78 | ||||||
| 2026-02-11 | 13F | J.w. Cole Advisors, Inc. | 0 | -100,00 | 0 | -100,00 | ||||
| 2026-02-17 | 13F | Advisory Services Network, LLC | 11.650 | 44,72 | 91 | -24,37 | ||||
| 2026-01-21 | 13F | Sound Income Strategies, LLC | 170 | 1 | ||||||
| 2026-02-13 | 13F | Golden State Wealth Management, LLC | 202 | 0,00 | 2 | -50,00 | ||||
| 2025-11-13 | 13F | Marathon Trading Investment Management LLC | 0 | -100,00 | 0 | -100,00 | ||||
| 2026-01-13 | 13F/A | Sanctuary Advisors, LLC | 15.000 | 25,00 | 222 | 54,55 | ||||
| 2025-11-14 | 13F | Walleye Capital LLC | Put | 0 | -100,00 | 0 | -100,00 | |||
| 2026-02-11 | 13F | Jpmorgan Chase & Co | 3.159.402 | 90.168,63 | 24.549 | 48.033,33 | ||||
| 2026-02-17 | 13F | Citadel Advisors Llc | 6.192.635 | 1.070,33 | 48.117 | 514,90 | ||||
| 2025-11-13 | 13F | Css Llc/il | Put | 0 | -100,00 | 0 | -100,00 | |||
| 2026-02-17 | 13F | Citadel Advisors Llc | Put | 2.164.000 | -29,04 | 16.814 | -62,72 | |||
| 2026-02-12 | 13F | Nuveen, LLC | 592.458 | 4.603 | ||||||
| 2026-02-13 | 13F | Harraden Circle Investments, LLC | 0 | -100,00 | 0 | -100,00 | ||||
| 2026-02-17 | 13F | Citadel Advisors Llc | Call | 4.463.200 | -6,79 | 34.679 | -51,03 | |||
| 2025-11-12 | 13F | HAP Trading, LLC | Call | 502.000 | 1.244 | |||||
| 2026-02-17 | 13F | Coatue Management Llc | 74.334 | -99,35 | 578 | -99,66 | ||||
| 2026-02-17 | 13F | National Asset Management, Inc. | 21.000 | 163 | ||||||
| 2026-02-17 | 13F | Ameriprise Financial Inc | 23.700 | -69,05 | 184 | -83,75 | ||||
| 2026-02-13 | 13F | Sterling Capital Management LLC | 14.113 | 110 | ||||||
| 2026-02-12 | 13F | Intrinsic Edge Capital Management LLC | 0 | -100,00 | 0 | -100,00 | ||||
| 2026-02-13 | 13F | Barclays Plc | Put | 234.200 | -27,76 | 1.820 | -62,06 | |||
| 2026-02-13 | 13F | Barclays Plc | 1.186.107 | 171,13 | 9.216 | 42,44 | ||||
| 2026-02-13 | 13F | Barclays Plc | Call | 1.574.200 | 0,00 | 12.232 | -47,47 | |||
| 2025-11-13 | 13F | Css Llc/il | 0 | -100,00 | 0 | -100,00 | ||||
| 2026-02-17 | 13F | Hillhouse Capital Advisors, Ltd. | 5.974.604 | -81,94 | 46.423 | -90,51 | ||||
| 2026-02-13 | 13F | Mariner, LLC | 0 | -100,00 | 0 | -100,00 | ||||
| 2026-02-17 | 13F | SummitTX Capital, L.P. | 108.476 | 132,97 | 843 | 22,38 | ||||
| 2026-02-17 | 13F | Twinbeech Capital Lp | 59.800 | 465 | ||||||
| 2026-02-17 | 13F | Jones Financial Companies Lllp | 7.218 | 143,93 | 56 | 27,27 | ||||
| 2026-02-17 | 13F | Jump Financial, LLC | 0 | -100,00 | 0 | |||||
| 2026-02-17 | 13F | Polar Asset Management Partners Inc. | 0 | -100,00 | 0 | |||||
| 2026-01-07 | 13F | Massmutual Trust Co Fsb/adv | 12 | 0 | ||||||
| 2026-02-13 | 13F | SC CHINA HOLDING Ltd | 7.053.639 | -26,17 | 55.230 | -48,11 | ||||
| 2026-01-20 | 13F/A | Miller Wealth Advisors, Llc | 0 | -100,00 | 0 | -100,00 | ||||
| 2026-02-06 | 13F | Bare Financial Services, Inc | 0 | -100,00 | 0 | -100,00 | ||||
| 2026-02-06 | 13F | Flaharty Asset Management, LLC | 15.765 | 8,11 | 122 | -43,26 | ||||
| 2025-11-14 | 13F | Toronto Dominion Bank | 0 | -100,00 | 0 | -100,00 | ||||
| 2025-11-14 | 13F | Toronto Dominion Bank | Call | 0 | -100,00 | 0 | -100,00 | |||
| 2026-02-17 | 13F | XTX Topco Ltd | 244.344 | 514,07 | 1.899 | 222,79 | ||||
| 2026-02-09 | 13F | Prospera Financial Services Inc | 58.624 | 48,87 | 455 | -21,82 | ||||
| 2026-02-17 | 13F | Point72 Asset Management, L.P. | Call | 19.100 | 148 | |||||
| 2025-11-13 | 13F | Total Investment Management Inc | 0 | -100,00 | 0 | |||||
| 2026-02-17 | 13F | Point72 Asset Management, L.P. | 1.963.453 | 15.256 | ||||||
| 2026-02-13 | 13F | Ausdal Financial Partners, Inc. | 16.000 | -20,78 | 124 | -58,39 | ||||
| 2026-02-13 | 13F | Y-Intercept (Hong Kong) Ltd | 0 | -100,00 | 0 | -100,00 | ||||
| 2026-02-17 | 13F | Qube Research & Technologies Ltd | 44.952 | 349 | ||||||
| 2026-02-17 | 13F | MIRAE ASSET GLOBAL ETFS HOLDINGS Ltd. | 316.720 | 59,47 | 2.461 | -16,24 | ||||
| 2026-02-17 | 13F | Greenland Capital Management LP | Call | 0 | -100,00 | 0 | -100,00 | |||
| 2026-02-13 | 13F | Toroso Investments, LLC | 2.133.571 | 371,37 | 16.578 | 147,64 | ||||
| 2026-02-13 | 13F | Sei Investments Co | 28.131 | 219 | ||||||
| 2026-02-13 | 13F | Morgan Stanley | 1.045.234 | 15,22 | 8.121 | -39,47 | ||||
| 2026-02-13 | 13F | Prudential Financial Inc | 16.205 | 126 | ||||||
| 2026-02-13 | 13F | Caitong International Asset Management Co., Ltd | 11.744 | 91 | ||||||
| 2026-03-12 | 13F/A | Peak6 Llc | Put | 0 | -100,00 | 0 | -100,00 | |||
| 2026-02-12 | 13F | New York State Common Retirement Fund | 86.100 | 669 | ||||||
| 2026-03-12 | 13F/A | Peak6 Llc | 23.966.070 | 228,32 | 186.216 | 72,48 | ||||
| 2026-03-12 | 13F/A | Peak6 Llc | Call | 4.217.400 | -35,11 | 32.769 | -65,91 | |||
| 2026-02-13 | 13F | Toroso Investments, LLC | Put | 510.300 | 3.965 | |||||
| 2026-02-17 | 13F | Northern Trust Corp | 1.322.002 | 10.272 | ||||||
| 2025-11-06 | 13F | Warberg Asset Management LLC | 0 | -100,00 | 0 | -100,00 | ||||
| 2026-02-13 | 13F | Atlas Merchant Capital LLC | 0 | -100,00 | 0 | -100,00 | ||||
| 2025-11-14 | 13F | Caption Management, LLC | Put | 0 | -100,00 | 0 | -100,00 | |||
| 2026-02-17 | 13F | Greenland Capital Management LP | Put | 0 | -100,00 | 0 | -100,00 | |||
| 2026-02-17 | 13F | Capital Fund Management S.a. | 291.198 | -21,15 | 2.263 | -58,58 | ||||
| 2026-02-10 | 13F | Foundations Investment Advisors, LLC | Call | 10.000 | 0,00 | 78 | -47,62 | |||
| 2026-02-04 | 13F | Valeo Financial Advisors, LLC | Call | 0 | -100,00 | 0 | -100,00 | |||
| 2025-11-14 | 13F | Cable Car Capital LLC | 0 | -100,00 | 0 | -100,00 | ||||
| 2026-02-17 | 13F | Sig Brokerage, Lp | Put | 29.200 | -40,65 | 227 | -68,91 | |||
| 2026-02-17 | 13F | Sig Brokerage, Lp | Call | 39.200 | 0,00 | 305 | -47,50 | |||
| 2026-01-26 | 13F | PFG Investments, LLC | 17.050 | 132 | ||||||
| 2026-02-18 | 13F | GWM Advisors LLC | 25.918 | 7,89 | 201 | -43,38 | ||||
| 2026-02-10 | 13F | Skaana Management L.P. | 10.426 | -91,42 | 81 | -95,49 | ||||
| 2026-02-12 | 13F | Commonwealth Equity Services, Llc | 18.061 | 54,24 | 140 | |||||
| 2026-02-17 | 13F | Abel Hall, LLC | 14.402 | 112 | ||||||
| 2026-02-10 | 13F | Skaana Management L.P. | Call | 349.500 | -15,35 | 2.716 | -55,54 | |||
| 2026-02-10 | 13F | Skaana Management L.P. | Put | 327.500 | 2,54 | 2.545 | -46,14 | |||
| 2026-02-04 | 13F | Valeo Financial Advisors, LLC | 0 | -100,00 | 0 | -100,00 | ||||
| 2026-03-06 | 13F | Hsbc Holdings Plc | 46.393 | 362 | ||||||
| 2026-02-09 | 13F | Geode Capital Management, Llc | 3.633.150 | 938,47 | 28.230 | 445,59 | ||||
| 2026-01-30 | 13F | Yong Rong (HK) Asset Management Ltd | 5.000.000 | 39 | ||||||
| 2026-02-11 | 13F | 111 Capital | 23.829 | 185 | ||||||
| 2026-02-17 | 13F | Balyasny Asset Management Llc | 419.940 | 3.263 | ||||||
| 2026-02-17 | 13F | Balyasny Asset Management Llc | Call | 50.600 | -54,00 | 393 | -75,83 | |||
| 2026-02-13 | 13F | Wells Fargo & Company/mn | 308.135 | 9.956,63 | 2.394 | 5.220,00 | ||||
| 2026-02-17 | 13F | Capital Fund Management S.a. | Call | 2.019.300 | 7.060,64 | 15.690 | 3.662,35 | |||
| 2026-02-17 | 13F | Capital Fund Management S.a. | Put | 79.600 | 618 | |||||
| 2026-02-17 | 13F | Cnh Partners Llc | 0 | -100,00 | 0 | |||||
| 2026-02-17 | 13F | Hidden Lake Asset Management LP | 0 | -100,00 | 0 | |||||
| 2026-02-13 | 13F | Divisadero Street Capital Management, LP | 800.000 | 6.216 | ||||||
| 2026-02-17 | 13F | Cantor Fitzgerald, L. P. | Put | 500.000 | 3.885 | |||||
| 2026-01-29 | 13F | Vanguard Group Inc | 1.675.316 | 13.017 | ||||||
| 2026-02-17 | 13F | Cantor Fitzgerald, L. P. | 1.079.460 | 906,02 | 8.387 | 469,00 | ||||
| 2026-02-17 | 13F | Russell Investments Group, Ltd. | 21.717 | 169 | ||||||
| 2026-02-17 | 13F | PDT Partners, LLC | 164.200 | 1.276 | ||||||
| 2026-01-29 | 13F | UBS Group AG | Put | 71.300 | 0,00 | 554 | -47,44 | |||
| 2026-01-29 | 13F | UBS Group AG | Call | 5.400 | 0,00 | 42 | -48,10 | |||
| 2026-01-29 | 13F | UBS Group AG | 1.795.676 | 148,59 | 13.952 | 30,60 | ||||
| 2025-10-29 | 13F | Sequoia Financial Advisors, LLC | 0 | -100,00 | 0 | -100,00 | ||||
| 2026-02-12 | 13F | Marex Group plc | 2.107.938 | 313,31 | 16.379 | 117,13 | ||||
| 2026-02-13 | 13F | Walleye Capital LLC | Call | 0 | -100,00 | 0 | -100,00 | |||
| 2026-02-17 | 13F | Tower Research Capital LLC (TRC) | 5.158 | 6.777,33 | 40 | 3.900,00 | ||||
| 2026-02-13 | 13F | Walleye Capital LLC | 0 | -100,00 | 0 | -100,00 | ||||
| 2026-02-13 | 13F | Vienna Asset Management LLC | 135.052 | -6,50 | 1.049 | -50,89 | ||||
| 2026-02-17 | 13F | Two Sigma Securities, Llc | 0 | -100,00 | 0 | -100,00 | ||||
| 2026-02-13 | 13F | National Bank Of Canada /fi/ | 1.700 | 41,67 | 13 | -23,53 | ||||
| 2026-01-12 | 13F | CVA Family Office, LLC | 52 | 0 | ||||||
| 2026-02-17 | 13F | Royal Bank Of Canada | 57.789 | 4.284,60 | 450 | 2.268,42 | ||||
| 2026-02-13 | 13F | Healthcare Of Ontario Pension Plan Trust Fund | 347.364 | 2.699 | ||||||
| 2026-02-11 | 13F | Los Angeles Capital Management Llc | 4.352 | 47 | ||||||
| 2026-02-17 | 13F | Schonfeld Strategic Advisors LLC | 0 | -100,00 | 0 | |||||
| 2026-02-12 | 13F | EntryPoint Capital, LLC | 28.912 | 225 | ||||||
| 2026-02-12 | 13F | Xponance, Inc. | 21.183 | 165 | ||||||
| 2026-02-24 | 13F | Bell Investment Advisors, Inc | 64 | 0,00 | 0 | |||||
| 2026-02-10 | 13F | Bnp Paribas Arbitrage, Sa | 165.352 | 42,91 | 1.285 | -24,96 | ||||
| 2026-02-02 | 13F | Wolverine Asset Management Llc | Put | 0 | -100,00 | 0 | -100,00 | |||
| 2026-02-05 | 13F | Qsemble Capital Management, LP | 105.889 | 278,01 | 823 | 98,55 | ||||
| 2026-02-12 | 13F | BlackRock, Inc. | 15.155.408 | 19.081,63 | 117.758 | 9.981,93 | ||||
| 2026-02-06 | 13F | EverSource Wealth Advisors, LLC | 1.716 | 243,20 | 13 | 85,71 | ||||
| 2026-02-09 | 13F | Rit Capital Partners Plc | Put | 0 | -100,00 | 0 | -100,00 | |||
| 2026-02-09 | 13F | Rit Capital Partners Plc | 0 | -100,00 | 0 | -100,00 | ||||
| 2026-02-11 | 13F | Group One Trading, L.p. | 1.438.487 | 419,44 | 11.177 | 172,94 | ||||
| 2026-02-13 | 13F | State Street Corp | 4.342.717 | 23.123,09 | 33.743 | 12.125,36 | ||||
| 2026-02-17 | 13F | California State Teachers Retirement System | 16.815 | 131 | ||||||
| 2026-01-23 | 13F | Aspect Partners, LLC | 692 | 5 | ||||||
| 2026-02-17 | 13F | Lightspeed Management Company, L.L.C. | 0 | -100,00 | 0 | |||||
| 2025-11-14 | 13F | Jain Global LLC | 0 | -100,00 | 0 | -100,00 | ||||
| 2026-02-04 | 13F | Independent Advisor Alliance | 34.930 | 119,41 | 271 | 15,32 | ||||
| 2026-02-11 | 13F | LPL Financial LLC | 141.565 | 24,12 | 1.100 | -34,82 | ||||
| 2026-02-13 | 13F | Archon Capital Management LLC | 0 | -100,00 | 0 | |||||
| 2026-01-09 | 13F | SG Americas Securities, LLC | 413.279 | 3.486,56 | 3 | |||||
| 2026-02-13 | 13F | Citigroup Inc | 11.122 | 86 | ||||||
| 2025-11-14 | 13F | Militia Capital Partners, LP | 0 | -100,00 | 0 | -100,00 | ||||
| 2026-02-17 | 13F | Blackstone Group Inc | Put | 0 | -100,00 | 0 | -100,00 | |||
| 2025-11-14 | 13F | Wolverine Trading, Llc | 24.836 | -78,98 | 386 | -69,82 | ||||
| 2025-11-14 | 13F | Wolverine Trading, Llc | Call | 762.500 | 80,60 | 11.857 | 159,32 | |||
| 2025-11-14 | 13F | Wolverine Trading, Llc | Put | 330.400 | 53,18 | 5.138 | 119,91 | |||
| 2026-02-13 | 13F | Walleye Trading LLC | 371.548 | -36,40 | 2.887 | -66,60 | ||||
| 2026-02-17 | 13F | Parallax Volatility Advisers, L.P. | Put | 40.000 | 311 | |||||
| 2026-02-10 | 13F | Bank of New York Mellon Corp | 736.142 | 5.720 | ||||||
| 2026-02-17 | 13F | Parallax Volatility Advisers, L.P. | 36.342 | 282 | ||||||
| 2026-02-17 | 13F | Nomura Holdings Inc | 54.127 | 421 | ||||||
| 2026-02-13 | 13F | Walleye Trading LLC | Put | 497.000 | 128,72 | 3.862 | 20,17 | |||
| 2026-02-17 | 13F | Nomura Holdings Inc | Call | 200.900 | 33,93 | 1.561 | -29,67 | |||
| 2026-02-17 | 13F | Corsair Capital Management, L.p. | 12.000 | 93 | ||||||
| 2026-02-13 | 13F | Walleye Trading LLC | Call | 543.100 | 110,99 | 4.220 | 10,85 | |||
| 2026-02-17 | 13F | Nomura Holdings Inc | Put | 61.600 | 479 | |||||
| 2026-01-26 | 13F | Mirae Asset Global Investments Co., Ltd. | 1.211 | 20,26 | 9 | -35,71 | ||||
| 2026-02-13 | 13F | Police & Firemen's Retirement System of New Jersey | 73.052 | 568 | ||||||
| 2026-02-11 | 13F | Deutsche Bank Ag\ | 190.251 | 1.478 | ||||||
| 2026-02-03 | 13F | SBI Securities Co., Ltd. | 1.706 | 301,41 | 13 | 116,67 | ||||
| 2025-11-14 | 13F | Shay Capital LLC | 0 | -100,00 | 0 | -100,00 | ||||
| 2026-02-17 | 13F | Tudor Investment Corp Et Al | Call | 705.500 | -7,17 | 5.482 | -51,24 | |||
| 2026-02-19 | 13F | Invesco Ltd. | 187.626 | 1.458 | ||||||
| 2026-02-13 | 13F | Manufacturers Life Insurance Company, The | 83.530 | 649 | ||||||
| 2026-01-20 | 13F | Ascent Group, LLC | 13.216 | 103 | ||||||
| 2026-02-12 | 13F | Federation des caisses Desjardins du Quebec | 150 | 100,00 | 1 | 0,00 | ||||
| 2026-02-17 | 13F | Main Street Financial Solutions, LLC | 15.000 | 117 | ||||||
| 2026-02-13 | 13F | Quarry LP | Put | 0 | -100,00 | 0 | ||||
| 2026-02-13 | 13F | Quarry LP | 0 | -100,00 | 0 | |||||
| 2026-02-13 | 13F | Arkadios Wealth Advisors | 0 | -100,00 | 0 | -100,00 | ||||
| 2026-02-17 | 13F | Bank Of America Corp /de/ | Put | 0 | -100,00 | 0 | -100,00 | |||
| 2026-01-29 | 13F | Nbc Securities, Inc. | Put | 14 | 2 | |||||
| 2026-02-09 | 13F | Jefferies Financial Group Inc. | Put | 0 | -100,00 | 0 | -100,00 | |||
| 2026-02-02 | 13F | Strs Ohio | 48.200 | 375 | ||||||
| 2026-02-09 | 13F | Jefferies Financial Group Inc. | Call | 0 | -100,00 | 0 | -100,00 | |||
| 2026-01-08 | 13F | Tompkins Financial Corp | 565 | 0,00 | 4 | -50,00 | ||||
| 2026-02-17 | 13F | Engineers Gate Manager LP | 0 | -100,00 | 0 | -100,00 | ||||
| 2026-02-13 | 13F | Gts Securities Llc | 26.832 | -14,95 | 208 | -55,36 | ||||
| 2026-02-17 | 13F | Bank Of America Corp /de/ | Call | 0 | -100,00 | 0 | -100,00 | |||
| 2026-02-03 | 13F | LJI Wealth Management, LLC | 17.000 | 132 | ||||||
| 2026-02-13 | 13F | Verition Fund Management LLC | 847.383 | 6.584 | ||||||
| 2026-01-30 | 13F | R Squared Ltd | 25.145 | 195 | ||||||
| 2026-02-12 | 13F | Bank Of Montreal /can/ | Put | 1.956.100 | 15.199 | |||||
| 2026-02-13 | 13F | Verition Fund Management LLC | Put | 289.400 | 6,24 | 2.249 | -44,19 | |||
| 2026-02-17 | 13F | Alliancebernstein L.p. | 267.600 | 2.079 | ||||||
| 2026-02-18 | 13F | Vident Advisory, LLC | 77.576 | 345,79 | 603 | 134,24 | ||||
| 2026-02-12 | 13F | Bank Of Montreal /can/ | Call | 265.700 | -21,81 | 2.064 | -58,93 | |||
| 2026-02-13 | 13F | Verition Fund Management LLC | Call | 36.500 | -87,43 | 284 | -93,41 | |||
| 2026-02-12 | 13F | Bank Of Montreal /can/ | 1.967.073 | 9.719,65 | 15.284 | 5.063,51 | ||||
| 2026-02-13 | 13F | Clear Street Group Inc. | Put | 0 | -100,00 | 0 | -100,00 | |||
| 2026-01-16 | 13F | FNY Investment Advisers, LLC | 2.500 | -94,44 | 0 | |||||
| 2026-02-10 | 13F | Rothschild Investment Llc | 210 | 2 | ||||||
| 2026-01-16 | 13F | FNY Investment Advisers, LLC | Call | 10 | 0 | |||||
| 2026-02-17 | 13F | Advisor Group Holdings, Inc. | 2.572 | -88,95 | 20 | -94,44 | ||||
| 2026-02-17 | 13F | Azora Capital LP | 1.800.423 | -45,26 | 13.989 | -71,24 | ||||
| 2026-02-17 | 13F | Susquehanna International Group, Llp | 27.967.859 | -3,37 | 217.310 | -49,23 | ||||
| 2026-02-13 | 13F | Squarepoint Ops LLC | 181.532 | 1.411 | ||||||
| 2026-02-12 | 13F | Hrt Financial Lp | 0 | -100,00 | 0 | |||||
| 2026-02-17 | 13F | Price T Rowe Associates Inc /md/ | 157.150 | 1 | ||||||
| 2026-02-17 | 13F | HS Investments IV Ltd | 14.126.289 | 109.761 | ||||||
| 2025-12-02 | 13F | IFP Advisors, Inc | 0 | -100,00 | 0 | -100,00 | ||||
| 2026-02-06 | 13F | ProShare Advisors LLC | 49.915 | 388 | ||||||
| 2026-02-05 | 13F | Amalgamated Bank | 8.581 | 0 | ||||||
| 2026-02-17 | 13F | Tudor Investment Corp Et Al | Put | 0 | -100,00 | 0 | -100,00 | |||
| 2026-02-13 | 13F | Marshall Wace, Llp | 0 | -100,00 | 0 | |||||
| 2026-02-17 | 13F | Susquehanna International Group, Llp | Put | 3.557.600 | -4,24 | 27.643 | -49,69 | |||
| 2026-02-17 | 13F | Susquehanna International Group, Llp | Call | 3.879.000 | 28,28 | 30.140 | -32,61 | |||
| 2026-02-13 | 13F | Rhumbline Advisers | 331.618 | 2.577 | ||||||
| 2026-02-13 | 13F | Clear Street Group Inc. | 272.865 | 18,64 | 2.120 | -37,67 | ||||
| 2026-02-17 | 13F | General Atlantic Llc | 50.816 | -99,29 | 395 | -99,63 | ||||
| 2026-02-02 | 13F | Principal Financial Group Inc | 12.328 | 96 | ||||||
| 2026-02-11 | 13F | Simplex Trading, Llc | 44.482 | 346 | ||||||
| 2026-01-29 | 13F | IMC-Chicago, LLC | 98.135 | 763 | ||||||
| 2025-11-13 | 13F | Wells Fargo & Company/mn | Call | 0 | -100,00 | 0 | -100,00 | |||
| 2026-02-17 | 13F | Sandia Investment Management LP | 0 | -100,00 | 0 | |||||
| 2026-02-17 | 13F | Raymond James Financial Inc | 0 | -100,00 | 0 | |||||
| 2026-02-17 | 13F | Bank Of America Corp /de/ | 2.431.784 | 22,75 | 18.895 | -35,52 | ||||
| 2026-02-17 | 13F | Moore Capital Management, Lp | 0 | -100,00 | 0 | |||||
| 2025-11-13 | 13F | Private Advisor Group, LLC | 0 | -100,00 | 0 | -100,00 | ||||
| 2026-02-17 | 13F | Trexquant Investment LP | 1.383.291 | 10.748 | ||||||
| 2026-02-12 | 13F | Renaissance Technologies Llc | 364.400 | 2.831 | ||||||
| 2026-02-10 | 13F | Foundations Investment Advisors, LLC | 0 | -100,00 | 0 | -100,00 | ||||
| 2026-02-13 | 13F | Entropy Technologies, LP | 336.932 | 1.327,68 | 2.618 | 649,86 | ||||
| 2026-02-17 | 13F | Aquatic Capital Management LLC | 412.413 | 3.204 | ||||||
| 2026-02-10 | 13F | Goldman Sachs Group Inc | Put | 0 | -100,00 | 0 | -100,00 | |||
| 2026-02-10 | 13F/A | Northwestern Mutual Wealth Management Co | 25 | 0 | ||||||
| 2026-02-02 | 13F | Wolverine Asset Management Llc | 21.715 | -9,63 | 169 | -52,68 | ||||
| 2025-11-14 | 13F | Two Sigma Investments, Lp | 0 | -100,00 | 0 | -100,00 | ||||
| 2025-11-14 | 13F | LMR Partners LLP | Put | 0 | -100,00 | 0 | -100,00 | |||
| 2025-11-14 | 13F | LMR Partners LLP | 0 | -100,00 | 0 | -100,00 | ||||
| 2026-02-12 | 13F | Cibc World Markets Corp | 18.069 | 140 | ||||||
| 2026-02-12 | 13F | Voya Investment Management Llc | 47.710 | 371 |