Grundlæggende statistik
| Institutionelle ejere | 135 total, 135 long only, 0 short only, 0 long/short - change of -0,74% MRQ |
| Gennemsnitlig porteføljeallokering | 0.4804 % - change of -1,97% MRQ |
| Institutionelle aktier (lange) | 10.643.495 (ex 13D/G) - change of -1,55MM shares -12,69% MRQ |
| Institutionel værdi (lang) | $ 495.947 USD ($1000) |
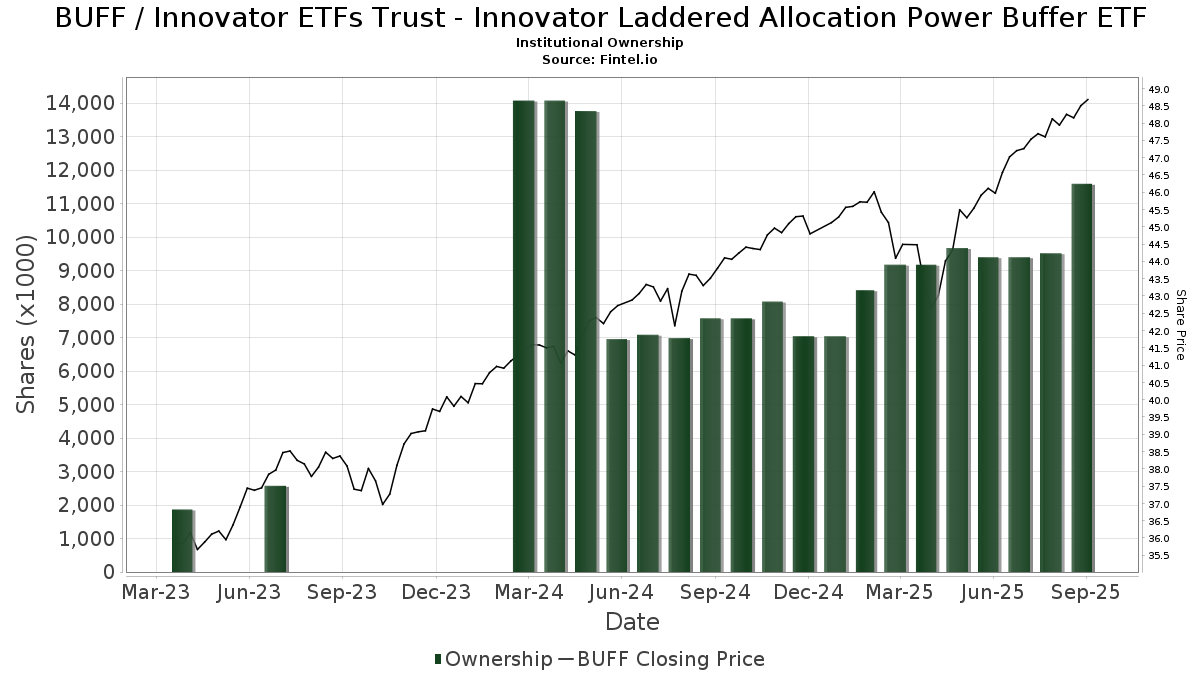
Institutionelt ejerskab og aktionærer
Innovator ETFs Trust - Innovator Laddered Allocation Power Buffer ETF (US:BUFF) har 135 institutionelle ejere og aktionærer, der har indsendt 13D/G- eller 13F-formularer til Securities Exchange Commission (SEC). Disse institutioner har i alt 10,643,495 aktier. Største aktionærer omfatter LPL Financial LLC, Mercer Global Advisors Inc /adv, Cetera Investment Advisers, Envestnet Asset Management Inc, Advisor Group Holdings, Inc., GGM Financials LLC, Kingsview Wealth Management, LLC, Prasad Wealth Partners, LLC, Janney Montgomery Scott LLC, and Holos Integrated Wealth LLC .
Innovator ETFs Trust - Innovator Laddered Allocation Power Buffer ETF (BATS:BUFF) institutionel ejerskabsstruktur viser aktuelle positioner i virksomheden efter institutioner og fonde, samt seneste ændringer i positionsstørrelse. Større aktionærer kan omfatte individuelle investorer, investeringsforeninger, hedgefonde eller institutioner. Skema 13D angiver, at investoren besidder (eller besidder) mere end 5 % af virksomheden og har til hensigt (eller har til hensigt at) aktivt at forfølge en ændring i forretningsstrategi. Skema 13G indikerer en passiv investering på over 5%.
The share price as of March 19, 2026 is 49,54 / share. Previously, on March 20, 2025, the share price was 44,34 / share. This represents an increase of 11,73% over that period.
Fondens stemningsscore
Fund Sentiment Score (fka Ownership Accumulation Score) finder de aktier, der bliver mest købt af fonde. Det er resultatet af en sofistikeret, multi-faktor kvantitativ model, der identificerer virksomheder med de højeste niveauer af institutionel akkumulering. Scoringsmodellen bruger en kombination af den samlede stigning i oplyste ejere, ændringerne i porteføljeallokeringer i disse ejere og andre målinger. Tallet går fra 0 til 100, hvor højere tal indikerer et højere niveau af akkumulering for sine jævnaldrende, og 50 er gennemsnittet.
Opdateringsfrekvens: Dagligt
Se Ownership Explorer, som giver en liste over højest rangerende virksomheder.
AI+ Ask Fintel’s AI assistant about Innovator ETFs Trust - Innovator Laddered Allocation Power Buffer ETF.
Select a question to share a public post with an AI-crafted answer.
Thinking of good questions…
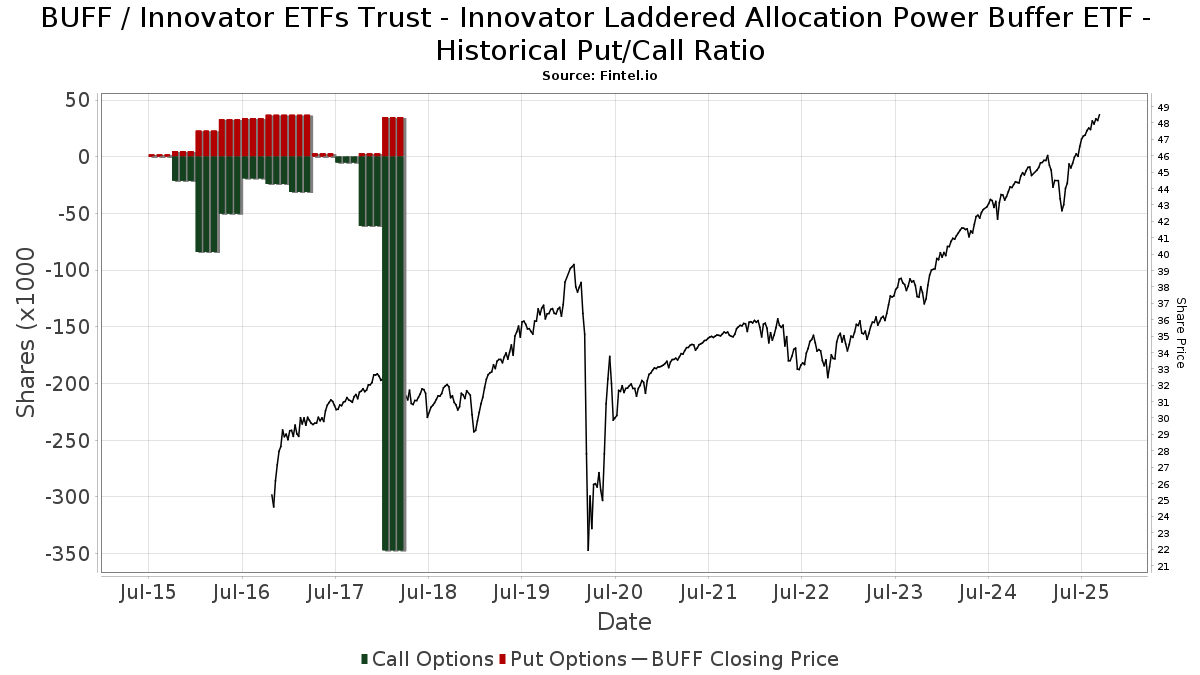
Institutionel Put/Call-forhold
Ud over at indberette standardaktie- og gældsudstedelser skal institutter med mere end 100 mill. aktiver under forvaltning også oplyse deres put- og call-optionsbeholdninger. Da salgsoptioner generelt indikerer negativ stemning, og købsoptioner indikerer positiv stemning, kan vi få en fornemmelse af den overordnede institutionelle stemning ved at plotte forholdet mellem put og kald. Diagrammet til højre viser det historiske put/call-forhold for dette instrument.
Brug af Put/Call Ratio som en indikator for investorernes stemning overvinder en af de vigtigste mangler ved at bruge totalt institutionelt ejerskab, som er, at en betydelig mængde af aktiver under forvaltning investeres passivt for at spore indekser. Passivt forvaltede fonde køber typisk ikke optioner, så indikatoren for put/call-forholdet følger mere nøje følelsen af aktivt forvaltede fonde.
13F og NPORT arkivering
Detaljer om 13F-arkivering er gratis. Detaljer om NP-ansøgninger kræver et premium-medlemskab. Grønne rækker angiver nye positioner. Røde rækker angiver lukkede positioner. Klik på linket ikon for at se den fulde transaktionshistorik.
Opgrader
for at låse premium-data op og eksportere til Excel ![]() .
.
| Fil dato | Kilde | Investor | Type | Gennemsnitlig pris (Øst) |
Aktier | Δ Aktier (%) |
Rapporteret Værdi ($1000) |
Δ Værdi (%) |
Port Alloc (%) |
|
|---|---|---|---|---|---|---|---|---|---|---|
| 2026-01-29 | 13F | Comprehensive Financial Consultants Institutional, Inc. | 40.516 | 3,16 | 2.020 | 5,32 | ||||
| 2026-02-05 | 13F | IMG Wealth Management, Inc. | 6.953 | 0,00 | 347 | 2,06 | ||||
| 2026-01-05 | 13F | City Center Advisors, LLC | 27.119 | 33,80 | 1.352 | 36,57 | ||||
| 2026-02-12 | 13F | BRYN MAWR TRUST Co | 758 | 0,00 | 38 | 0,00 | ||||
| 2026-02-10 | 13F | IFG Advisory, LLC | 0 | -100,00 | 0 | |||||
| 2026-01-12 | 13F | Focus Financial Network, Inc. | 47.306 | -11,93 | 2.359 | -10,14 | ||||
| 2026-01-20 | 13F | Stratos Wealth Partners, LTD. | 67.893 | 25,22 | 3.385 | 27,83 | ||||
| 2026-02-10 | 13F | COFG Advisors, LLC | 5.949 | 297 | ||||||
| 2026-02-18 | 13F | GWM Advisors LLC | 8.241 | -2,94 | 411 | -0,97 | ||||
| 2026-02-10 | 13F | Advisor Resource Council | 25.951 | -3,84 | 1.294 | -1,90 | ||||
| 2026-02-13 | 13F | Glen Eagle Advisors, LLC | 55.087 | -4,64 | 2.747 | -2,69 | ||||
| 2026-01-07 | 13F | Harbor Investment Advisory, Llc | 3.230 | 0,00 | 161 | 2,55 | ||||
| 2026-02-17 | 13F | Core Wealth Advisors, Inc. | 82.572 | 4,91 | 4.117 | 7,07 | ||||
| 2026-02-09 | 13F | Blue Bell Private Wealth Management, Llc | 1.649 | 0,00 | 82 | 2,50 | ||||
| 2026-02-18 | 13F | Onyx Bridge Wealth Group LLC | 9.496 | -2,61 | 473 | -0,63 | ||||
| 2026-01-13 | 13F | Signal Advisors Wealth, LLC | 16.795 | 40,10 | 837 | 43,08 | ||||
| 2026-01-23 | 13F | Webster Bank, N. A. | 8.934 | 445 | ||||||
| 2026-01-26 | 13F | Patriot Financial Group Insurance Agency, LLC | 32.006 | 4,42 | 1.596 | 6,55 | ||||
| 2026-02-13 | 13F | Change Path, LLC | 72.623 | -1,19 | 3.621 | 0,84 | ||||
| 2026-02-18 | 13F | Beacon Pointe Advisors, LLC | 22.926 | 75,03 | 1.143 | 78,87 | ||||
| 2026-01-28 | 13F | Geneos Wealth Management Inc. | 1.058 | 0,00 | 53 | 1,96 | ||||
| 2026-01-21 | 13F | Capital Advisors, Ltd. LLC | 285 | 0,00 | 0 | |||||
| 2026-02-17 | 13F | Mercer Global Advisors Inc /adv | 794.629 | -13,22 | 39.620 | -11,44 | ||||
| 2026-01-29 | 13F | UBS Group AG | 350 | 17 | ||||||
| 2026-02-09 | 13F | Collaborative Wealth Managment Inc. | 27.691 | -2,08 | 1.381 | -0,07 | ||||
| 2026-02-06 | 13F | HighTower Advisors, LLC | 180.414 | 2,38 | 8.995 | 4,48 | ||||
| 2025-11-13 | 13F | AlphaStar Capital Management, LLC | 0 | -100,00 | 0 | |||||
| 2026-02-04 | 13F | Pensionmark Financial Group, Llc | 150.628 | 3.253,25 | 224 | 1,83 | ||||
| 2026-02-17 | 13F | Susquehanna International Group, Llp | 10.043 | -73,34 | 501 | -72,83 | ||||
| 2026-02-17 | 13F | Private Advisor Group, LLC | 20.692 | -3,88 | 1.032 | -1,90 | ||||
| 2026-02-12 | 13F | Andina Capital Management, LLC | 54.168 | 7,80 | 2.701 | 10,02 | ||||
| 2026-02-13 | 13F | Morgan Stanley | 295 | 0,00 | 15 | 0,00 | ||||
| 2026-01-20 | 13F | AdvisorNet Financial, Inc | 9.698 | -4,52 | 484 | -2,62 | ||||
| 2026-02-03 | 13F | Capstone Triton Financial Group, LLC | 6.479 | -3,90 | 323 | -1,82 | ||||
| 2026-01-27 | 13F | BLVD Private Wealth, LLC | 0 | -100,00 | 0 | |||||
| 2026-01-29 | 13F | Concurrent Investment Advisors, LLC | 64.721 | 97,12 | 3.227 | 101,12 | ||||
| 2026-01-28 | 13F | Caliber Wealth Management, LLC / KS | 10.123 | 18,81 | 505 | 21,15 | ||||
| 2026-02-13 | 13F | Visionary Wealth Advisors | 86.669 | -7,85 | 4.321 | -5,94 | ||||
| 2026-02-17 | 13F | Maripau Wealth Management Llc | 14.839 | 49,02 | 736 | 51,44 | ||||
| 2026-02-10 | 13F | Envestnet Asset Management Inc | 561.791 | -56,47 | 28.011 | -55,57 | ||||
| 2026-01-16 | 13F | Ronald Blue Trust, Inc. | 72.955 | 9,80 | 3.638 | 12,05 | ||||
| 2026-02-10 | 13F | Goldman Sachs Group Inc | 0 | -100,00 | 0 | |||||
| 2026-02-17 | 13F | Mpwm Advisory Solutions, Llc | 0 | -100,00 | 0 | |||||
| 2026-02-13 | 13F | Golden State Wealth Management, LLC | 555 | 0,00 | 28 | 0,00 | ||||
| 2026-02-06 | 13F | IFP Advisors, Inc | 5.871 | -9,13 | 293 | -7,30 | ||||
| 2026-02-05 | 13F | Cambridge Investment Research Advisors, Inc. | 183.431 | 6,48 | 9 | 12,50 | ||||
| 2026-02-11 | 13F | LPL Financial LLC | 1.307.748 | -24,03 | 65.204 | -22,47 | ||||
| 2025-11-06 | 13F | Ameritas Advisory Services, LLC | 0 | -100,00 | 0 | -100,00 | ||||
| 2026-02-12 | 13F | Empower Advisory Group, LLC | 4.413 | 220 | ||||||
| 2026-02-04 | 13F | BCJ Capital Management, LLC | 10.629 | 0,00 | 530 | 1,93 | ||||
| 2026-02-11 | 13F | Jpmorgan Chase & Co | 1.481 | -11,16 | 74 | -9,88 | ||||
| 2026-01-21 | 13F | Kfg Wealth Management, Llc | 137.212 | -70,29 | 6.841 | -69,68 | ||||
| 2026-02-12 | 13F | Steward Partners Investment Advisory, Llc | 19.183 | -1,04 | 956 | 0,95 | ||||
| 2026-02-17 | 13F | Raymond James Financial Inc | 233.411 | 42,93 | 11.638 | 45,86 | ||||
| 2026-02-17 | 13F/A | Sentinus, LLC | 4.913 | 245 | ||||||
| 2026-01-23 | 13F | Diligent Investors, LLC | 41.595 | -0,28 | 2.074 | 1,77 | ||||
| 2026-02-09 | 13F | Prospera Financial Services Inc | 16.607 | 828 | ||||||
| 2026-02-10 | 13F | BKD Wealth Advisors, LLC | 123.071 | -7,90 | 6.136 | -6,00 | ||||
| 2026-01-08 | 13F | Sound View Wealth Advisors Group, LLC | 29.700 | 0,00 | 1.481 | 2,07 | ||||
| 2026-02-17 | 13F | VestGen Advisors, LLC | 4.422 | -47,81 | 220 | -46,73 | ||||
| 2026-02-04 | 13F | Ofc Financial Planning, Llc | 23.394 | 6,25 | 1.166 | 8,47 | ||||
| 2026-02-13 | 13F/A | Planwiser Financial, Llc | 0 | -100,00 | 0 | |||||
| 2026-01-22 | 13F | Columbia Advisory Partners Llc | 55.183 | 82,47 | 2.751 | 86,26 | ||||
| 2026-02-05 | 13F | Allworth Financial LP | 3.054 | 1.340,57 | 152 | 1.420,00 | ||||
| 2026-02-02 | 13F | Chapman Financial Group, Llc | 11.521 | 34,42 | 574 | 37,32 | ||||
| 2026-02-09 | 13F | Bellwether Advisors, LLC | 8.396 | 0,00 | 419 | 1,95 | ||||
| 2026-02-13 | 13F | Capital Square, LLC | 6.807 | -27,48 | 339 | -25,98 | ||||
| 2026-01-23 | 13F | DHJJ Financial Advisors, Ltd. | 6.314 | -7,13 | 315 | -5,42 | ||||
| 2026-02-17 | 13F | Advisory Services Network, LLC | 48.577 | 2,61 | 2.422 | 4,76 | ||||
| 2026-02-12 | 13F | TopTier Wealth Management, LLC | 20.288 | 1.012 | ||||||
| 2026-02-12 | 13F | Principal Securities, Inc. | 26.212 | 33,91 | 1.307 | 36,61 | ||||
| 2025-10-15 | 13F | Davies Financial Advisors, Inc. | 0 | -100,00 | 0 | |||||
| 2026-01-14 | 13F | Lineweaver Wealth Advisors, LLC | 39.917 | 0,00 | 1.990 | 2,05 | ||||
| 2026-02-17 | 13F | Garden State Investment Advisory Services LLC | 101.622 | -0,29 | 5.067 | 1,75 | ||||
| 2026-02-06 | 13F | GPS Wealth Strategies Group, LLC | 0 | -100,00 | 0 | |||||
| 2026-01-16 | 13F | Applied Capital LLC | 10.597 | 27,54 | 528 | 30,37 | ||||
| 2026-02-04 | 13F | GGM Financials LLC | 524.690 | 2,17 | 26.161 | 4,27 | ||||
| 2026-02-05 | 13F | Atria Investments Llc | 18.815 | -0,32 | 938 | 1,74 | ||||
| 2026-02-12 | 13F | Commonwealth Equity Services, Llc | 212.090 | -21,59 | 10.575 | 81.238,46 | ||||
| 2026-02-10 | 13F | Founders Financial Securities Llc | 11.229 | 11,64 | 560 | 13,85 | ||||
| 2026-02-12 | 13F | Jane Street Group, Llc | 10.012 | -77,14 | 499 | -76,67 | ||||
| 2026-02-11 | 13F | Janney Montgomery Scott LLC | 340.082 | 4,75 | 17 | 6,67 | ||||
| 2026-02-11 | 13F | Gwn Securities Inc. | 126.240 | 14,45 | 6.294 | 16,66 | ||||
| 2026-02-13 | 13F | Mml Investors Services, Llc | 107.610 | 22,21 | 5.365 | 24,74 | ||||
| 2026-02-17 | 13F | Old Mission Capital Llc | 44.096 | 2.199 | ||||||
| 2026-01-30 | 13F | Strategic Blueprint, LLC | 18.436 | 0,00 | 919 | 2,11 | ||||
| 2025-11-10 | 13F | Siligmueller & Norvid Wealth Advisors LLC | 0 | -100,00 | 0 | |||||
| 2026-01-08 | 13F | Wealth Enhancement Advisory Services, Llc | 43.388 | -4,07 | 2.178 | -1,63 | ||||
| 2026-02-10 | 13F | Hazlett, Burt & Watson, Inc. | 27.365 | 4,11 | 1 | 0,00 | ||||
| 2026-02-13 | 13F | MAI Capital Management | 0 | -100,00 | 0 | |||||
| 2026-01-23 | 13F | Clear Creek Financial Management, LLC | 6.303 | 0,00 | 314 | 2,28 | ||||
| 2026-02-06 | 13F | Integral Investment Advisors, Inc. | 11.629 | 20,77 | 580 | 23,19 | ||||
| 2026-02-13 | 13F | Resources Investment Advisors, LLC. | 13.533 | -24,11 | 675 | -22,62 | ||||
| 2026-01-26 | 13F | Merit Financial Group, LLC | 81.127 | 6,71 | 4.045 | 8,89 | ||||
| 2026-01-28 | 13F | Nicholson Meyer Capital Management, Inc. | 14.918 | 61,57 | 744 | 64,75 | ||||
| 2026-01-14 | 13F | Southland Equity Partners LLC | 50.490 | -2,72 | 2.517 | -0,71 | ||||
| 2026-02-11 | 13F | J.w. Cole Advisors, Inc. | 15.031 | 0,00 | 749 | 2,04 | ||||
| 2026-01-27 | 13F | Prasad Wealth Partners, LLC | 392.553 | 2,07 | 19.573 | 4,17 | ||||
| 2026-02-10 | 13F | Bank of New York Mellon Corp | 0 | -100,00 | 0 | |||||
| 2026-02-17 | 13F | Cetera Investment Advisers | 612.919 | 8,97 | 30.560 | 11,21 | ||||
| 2026-01-20 | 13F | Thurston, Springer, Miller, Herd & Titak, Inc. | 511 | 25 | ||||||
| 2026-02-13 | 13F | Wells Fargo & Company/mn | 200 | 10 | ||||||
| 2026-02-10 | 13F | Weaver Consulting Group | 20.699 | 13,89 | 1.032 | 16,35 | ||||
| 2026-01-07 | 13F | Wisconsin Wealth Advisors, LLC | 27.698 | 28,56 | 1.381 | 31,27 | ||||
| 2026-02-17 | 13F | SageView Advisory Group, LLC | 23.484 | -19,67 | 1.171 | -18,07 | ||||
| 2025-11-12 | 13F | Armis Advisers, LLC | 0 | -100,00 | 0 | |||||
| 2026-02-17 | 13F | Bank Of America Corp /de/ | 0 | -100,00 | 0 | |||||
| 2026-02-06 | 13F | Seros Financial, LLC | 79.137 | 4,22 | 3.946 | 6,36 | ||||
| 2026-01-13 | 13F | CoreCap Advisors, LLC | 11.954 | -10,17 | 596 | -8,31 | ||||
| 2026-02-05 | 13F | Western Wealth Management, LLC | 15.417 | 769 | ||||||
| 2026-02-19 | 13F | Mcguire Capital Advisors Inc | 41 | 2 | ||||||
| 2026-01-26 | 13F | LifeWealth Investments, LLC | 266.849 | 14,48 | 13.305 | 16,84 | ||||
| 2026-01-27 | 13F | Vestia Personal Wealth Advisors | 33.874 | -6,32 | 1.698 | -3,91 | ||||
| 2026-02-13 | 13F | Financial Network Wealth Advisors LLC | 39.636 | -1,93 | 1.976 | 0,10 | ||||
| 2026-01-26 | 13F | Nations Financial Group Inc, /ia/ /adv | 4.799 | 0,29 | 239 | 2,58 | ||||
| 2026-02-12 | 13F | Brinker Capital Investments, LLC | 12.290 | 64,06 | 613 | 67,67 | ||||
| 2026-02-06 | 13F | Global Retirement Partners, LLC | 700 | -2,64 | 35 | -2,86 | ||||
| 2026-02-17 | 13F | Fmr Llc | 5 | 0 | ||||||
| 2026-02-17 | 13F | Harvest Investment Services, LLC | 6.900 | 0,00 | 344 | 2,08 | ||||
| 2026-02-02 | 13F | JDM Financial Group LLC | 40.867 | -2,95 | 2.038 | -0,97 | ||||
| 2026-02-02 | 13F | Truist Financial Corp | 16.311 | 47,84 | 813 | 50,83 | ||||
| 2026-01-05 | 13F | Holos Integrated Wealth LLC | 324.434 | 2,99 | 16.218 | 6,15 | ||||
| 2026-01-20 | 13F | Sovran Advisors, LLC | 13.155 | -3,68 | 660 | -1,79 | ||||
| 2026-01-28 | 13F | Bedel Financial Consulting, Inc. | 4.883 | 0,00 | 243 | 2,10 | ||||
| 2026-02-03 | 13F | Cheviot Value Management, LLC | 244 | 0,00 | 12 | 0,00 | ||||
| 2026-02-09 | 13F | Kingsview Wealth Management, LLC | 514.676 | 2,34 | 25.662 | 4,44 | ||||
| 2026-01-26 | 13F | AE Wealth Management LLC | 830 | -11,80 | 41 | -8,89 | ||||
| 2026-01-28 | 13F | Milestone Asset Management, Llc | 45.319 | -2,71 | 2.260 | -0,70 | ||||
| 2026-02-03 | 13F | Channel Wealth Llc | 6.000 | -19,35 | 299 | -17,63 | ||||
| 2026-02-12 | 13F | Colonial Trust Co / SC | 121 | 0,00 | 6 | 20,00 | ||||
| 2026-02-13 | 13F | Bluedoor Private Wealth, Llc | 13.905 | 693 | ||||||
| 2026-02-17 | 13F | Captrust Financial Advisors | 19.333 | 5,43 | 964 | 7,60 | ||||
| 2025-11-07 | 13F | Atticus Wealth Management, Llc | 0 | -100,00 | 0 | |||||
| 2026-01-29 | 13F | Nbc Securities, Inc. | 934 | 0,00 | 47 | 2,22 | ||||
| 2026-01-22 | 13F | Buska Wealth Management, LLC | 174.488 | -13,92 | 8.700 | -12,15 | ||||
| 2026-02-09 | 13F | Harbour Investments, Inc. | 126.207 | -11,23 | 6.293 | -9,42 | ||||
| 2026-01-12 | 13F | Seacrest Wealth Management, Llc | 31.028 | 93,26 | 1.555 | 98,09 | ||||
| 2026-02-02 | 13F | Mutual Advisors, LLC | 217.378 | 0,80 | 10.838 | 2,30 | ||||
| 2026-02-17 | 13F | Advisor Group Holdings, Inc. | 539.562 | 4,33 | 26.903 | 6,96 | ||||
| 2026-02-05 | 13F | Soltis Investment Advisors LLC | 36.480 | -0,86 | 1.819 | 1,17 | ||||
| 2026-01-14 | 13F | Stegent Equity Advisors, Inc. | 6.460 | -37,44 | 322 | -36,11 | ||||
| 2026-02-13 | 13F | Kestra Advisory Services, LLC | 0 | -100,00 | 0 | |||||
| 2026-01-15 | 13F | Brookstone Capital Management | 26.677 | -63,87 | 1.330 | -63,12 | ||||
| 2026-02-03 | 13F | Diversify Wealth Management, Llc | 32.337 | 0,78 | 1.625 | 2,72 | ||||
| 2026-02-03 | 13F | Red Crane Wealth Management, Llc | 5.780 | 0,00 | 288 | 2,13 | ||||
| 2026-01-21 | 13F | Capital Investment Advisory Services, LLC | 3.532 | 7,00 | 176 | 9,32 | ||||
| 2026-01-14 | 13F | Wealthcare Advisory Partners LLC | 52.034 | 14,61 | 2.594 | 16,95 | ||||
| 2026-02-19 | 13F/A | Axxcess Wealth Management, Llc | 45.192 | 20,84 | 2.253 | 23,32 | ||||
| 2026-02-13 | 13F | Beacon Financial Advisory LLC | 16.311 | 3,34 | 813 | 5,45 | ||||
| 2026-01-26 | 13F | Cwm, Llc | 346 | 0,00 | 0 | |||||
| 2026-01-30 | 13F | Sigma Planning Corp | 0 | -100,00 | 0 | |||||
| 2026-01-28 | 13F | Southern Capital Advisors, Llc | 12.265 | 1,15 | 612 | 3,21 |