Grundlæggende statistik
| Institutionelle ejere | 117 total, 117 long only, 0 short only, 0 long/short - change of 14,71% MRQ |
| Gennemsnitlig porteføljeallokering | 1.5721 % - change of 11,69% MRQ |
| Institutionelle aktier (lange) | 78.154.325 (ex 13D/G) - change of 8,39MM shares 12,02% MRQ |
| Institutionel værdi (lang) | $ 1.815.832 USD ($1000) |
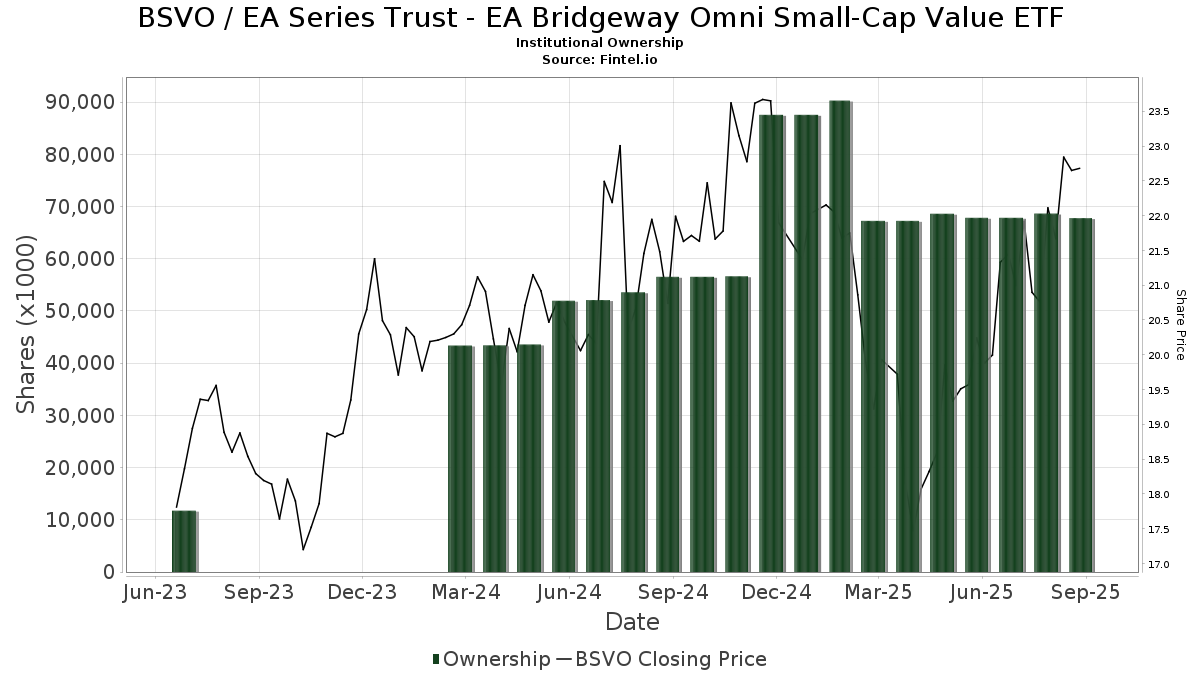
Institutionelt ejerskab og aktionærer
EA Series Trust - EA Bridgeway Omni Small-Cap Value ETF (US:BSVO) har 117 institutionelle ejere og aktionærer, der har indsendt 13D/G- eller 13F-formularer til Securities Exchange Commission (SEC). Disse institutioner har i alt 78,154,325 aktier. Største aktionærer omfatter Colony Group, LLC, Buckingham Strategic Partners, Peirce Capital Management, LLC, Keb Asset Management, Llc, Squire Investment Management Company, LLC, Kaufman Rossin Wealth, LLC, Claris Advisors, Llc / Mo /, Envestnet Asset Management Inc, Brady Martz Wealth Solutions, LLC, and Friday Financial .
EA Series Trust - EA Bridgeway Omni Small-Cap Value ETF (NasdaqGM:BSVO) institutionel ejerskabsstruktur viser aktuelle positioner i virksomheden efter institutioner og fonde, samt seneste ændringer i positionsstørrelse. Større aktionærer kan omfatte individuelle investorer, investeringsforeninger, hedgefonde eller institutioner. Skema 13D angiver, at investoren besidder (eller besidder) mere end 5 % af virksomheden og har til hensigt (eller har til hensigt at) aktivt at forfølge en ændring i forretningsstrategi. Skema 13G indikerer en passiv investering på over 5%.
The share price as of March 6, 2026 is 25,04 / share. Previously, on March 7, 2025, the share price was 19,86 / share. This represents an increase of 26,07% over that period.
Fondens stemningsscore
Fund Sentiment Score (fka Ownership Accumulation Score) finder de aktier, der bliver mest købt af fonde. Det er resultatet af en sofistikeret, multi-faktor kvantitativ model, der identificerer virksomheder med de højeste niveauer af institutionel akkumulering. Scoringsmodellen bruger en kombination af den samlede stigning i oplyste ejere, ændringerne i porteføljeallokeringer i disse ejere og andre målinger. Tallet går fra 0 til 100, hvor højere tal indikerer et højere niveau af akkumulering for sine jævnaldrende, og 50 er gennemsnittet.
Opdateringsfrekvens: Dagligt
Se Ownership Explorer, som giver en liste over højest rangerende virksomheder.
AI+ Ask Fintel’s AI assistant about EA Series Trust - EA Bridgeway Omni Small-Cap Value ETF.
Select a question to share a public post with an AI-crafted answer.
Thinking of good questions…
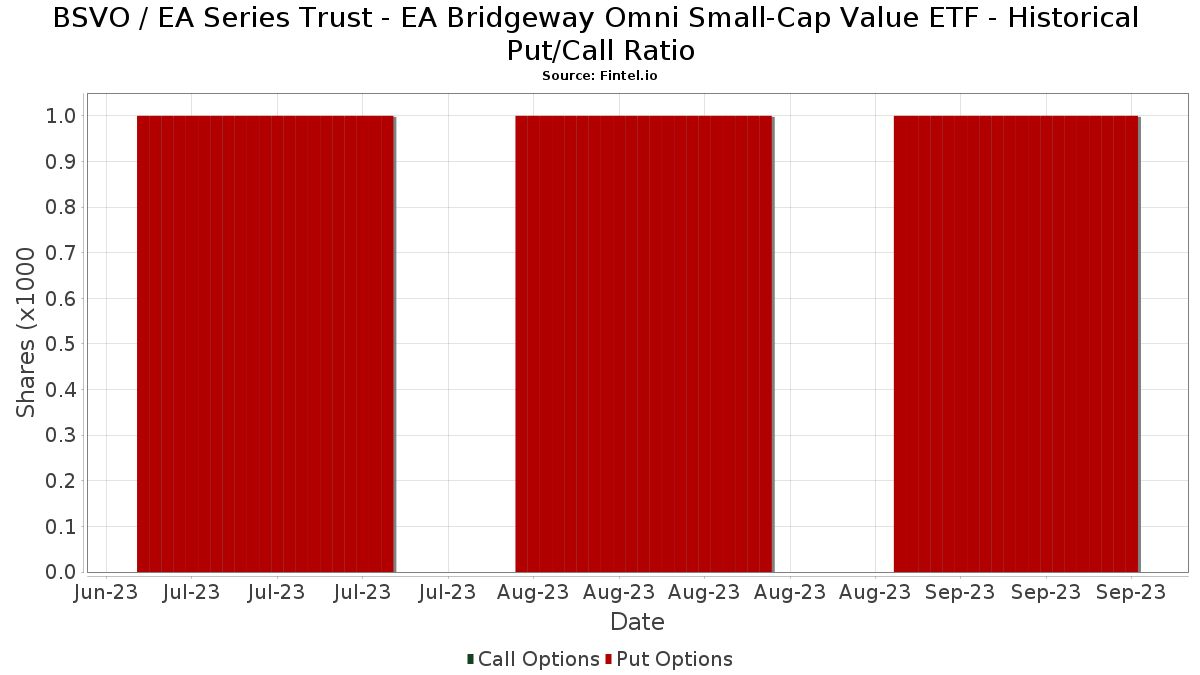
Institutionel Put/Call-forhold
Ud over at indberette standardaktie- og gældsudstedelser skal institutter med mere end 100 mill. aktiver under forvaltning også oplyse deres put- og call-optionsbeholdninger. Da salgsoptioner generelt indikerer negativ stemning, og købsoptioner indikerer positiv stemning, kan vi få en fornemmelse af den overordnede institutionelle stemning ved at plotte forholdet mellem put og kald. Diagrammet til højre viser det historiske put/call-forhold for dette instrument.
Brug af Put/Call Ratio som en indikator for investorernes stemning overvinder en af de vigtigste mangler ved at bruge totalt institutionelt ejerskab, som er, at en betydelig mængde af aktiver under forvaltning investeres passivt for at spore indekser. Passivt forvaltede fonde køber typisk ikke optioner, så indikatoren for put/call-forholdet følger mere nøje følelsen af aktivt forvaltede fonde.
13F og NPORT arkivering
Detaljer om 13F-arkivering er gratis. Detaljer om NP-ansøgninger kræver et premium-medlemskab. Grønne rækker angiver nye positioner. Røde rækker angiver lukkede positioner. Klik på linket ikon for at se den fulde transaktionshistorik.
Opgrader
for at låse premium-data op og eksportere til Excel ![]() .
.
| Fil dato | Kilde | Investor | Type | Gennemsnitlig pris (Øst) |
Aktier | Δ Aktier (%) |
Rapporteret Værdi ($1000) |
Δ Værdi (%) |
Port Alloc (%) |
|
|---|---|---|---|---|---|---|---|---|---|---|
| 2026-02-13 | 13F | Blueprint Financial Advisors LLC | 10.092 | 235 | ||||||
| 2026-02-12 | 13F | Andina Capital Management, LLC | 12.660 | 0,00 | 295 | 2,80 | ||||
| 2026-02-17 | 13F | Hill Investment Group Partners, LLC | 215.741 | -0,66 | 5.027 | 2,18 | ||||
| 2026-01-26 | 13F | AE Wealth Management LLC | 18 | -99,81 | 0 | -100,00 | ||||
| 2026-01-09 | 13F | Rf&l Wealth Management, Llc | 38.641 | 22,55 | 900 | 26,05 | ||||
| 2026-02-10 | 13F | Savant Capital, LLC | 38.808 | -0,75 | 904 | 2,15 | ||||
| 2026-02-02 | 13F | Integrity Wealth Solutions LLC | 71.538 | 1,01 | 1.667 | 3,87 | ||||
| 2026-02-06 | 13F | EverSource Wealth Advisors, LLC | 622.811 | 0,93 | 14.512 | 3,82 | ||||
| 2026-02-13 | 13F | Mariner, LLC | 47.810 | 0,04 | 1.114 | 2,87 | ||||
| 2026-02-02 | 13F | Your Advocates Ltd., LLP | 4.163 | 0,00 | 97 | 2,13 | ||||
| 2026-02-13 | 13F | Ieq Capital, Llc | 72.529 | 0,00 | 1.690 | 2,86 | ||||
| 2026-02-12 | 13F | Cloud Capital Management, LLC | 0 | -100,00 | 0 | |||||
| 2026-01-27 | 13F | Berger Financial Group, Inc | 129.855 | 3,05 | 3.026 | 5,99 | ||||
| 2026-02-17 | 13F | Private Advisor Group, LLC | 14.220 | 20,02 | 331 | 23,51 | ||||
| 2026-02-17 | 13F | Aqr Capital Management Llc | 625.507 | 14,97 | 14.574 | 18,27 | ||||
| 2026-02-13 | 13F | Lauterbach Financial Advisors, LLC | 338.537 | 0,79 | 7.888 | 3,67 | ||||
| 2026-01-26 | 13F | Discipline Wealth Solutions, LLC | 32.257 | -0,61 | 752 | 2,18 | ||||
| 2026-02-03 | 13F | Cassaday & Co Wealth Management LLC | 17.415 | 0,00 | 406 | 2,79 | ||||
| 2026-02-17 | 13F | Cresset Asset Management, LLC | 34.051 | -9,83 | 793 | -7,25 | ||||
| 2026-02-10 | 13F/A | Northwestern Mutual Wealth Management Co | 4.620 | 0,00 | 108 | 2,88 | ||||
| 2026-02-12 | 13F | Hamilton Point Investment Advisors, LLC | 5.639 | 131 | ||||||
| 2026-02-13 | 13F | Kestra Advisory Services, LLC | 5.928 | 138 | ||||||
| 2026-02-12 | 13F | Jane Street Group, Llc | 0 | -100,00 | 0 | |||||
| 2026-01-26 | 13F | WorthPointe, LLC | 13.516 | 315 | ||||||
| 2026-02-12 | 13F | Vistica Wealth Advisors, LLC | 608.817 | 14.185 | ||||||
| 2026-01-15 | 13F | Parkwoods Wealth Partners, LLC | 189.438 | -2,58 | 4.414 | 0,20 | ||||
| 2026-01-14 | 13F | Nova Wealth Management, Inc. | 3.092 | -2,00 | 72 | 1,41 | ||||
| 2026-02-09 | 13F | Hantz Financial Services, Inc. | 3.016 | 0,00 | 0 | |||||
| 2026-01-30 | 13F | Ares Financial Consulting, LLC | 1.167 | 27 | ||||||
| 2026-02-17 | 13F | Creative Planning | 32.443 | 0,07 | 756 | 2,86 | ||||
| 2026-02-13 | 13F | Morgan Stanley | 9.873 | -7,58 | 230 | -4,56 | ||||
| 2026-01-09 | 13F | Friday Financial | 712.163 | 24,24 | 16.593 | 27,80 | ||||
| 2026-01-26 | 13F | DBK Financial Counsel, LLC | 15.175 | 0,00 | 354 | 2,92 | ||||
| 2026-02-05 | 13F | Plancorp, LLC | 12.544 | 0,00 | 292 | 2,82 | ||||
| 2026-01-09 | 13F | Dopkins Wealth Management, Llc | 393.407 | -2,99 | 9.166 | -0,21 | ||||
| 2026-02-06 | 13F | Peirce Capital Management, LLC | 1.834.005 | 0,11 | 42.732 | 2,98 | ||||
| 2026-02-13 | 13F | Wells Fargo & Company/mn | 0 | -100,00 | 0 | |||||
| 2026-02-17 | 13F | Raymond James Financial Inc | 13.893 | 0,49 | 324 | 3,19 | ||||
| 2026-01-05 | 13F | JDH Wealth Management, LLC | 381.784 | 1,27 | 8.896 | 4,17 | ||||
| 2026-01-08 | 13F | Wealth Enhancement Advisory Services, Llc | 53.226 | 2,84 | 1.280 | 9,87 | ||||
| 2026-01-08 | 13F | Bayshore Asset Management, Llc | 141.471 | 1,02 | 3.296 | 3,91 | ||||
| 2026-01-27 | 13F | Forum Financial Management, LP | 656.352 | -0,36 | 15.293 | 2,50 | ||||
| 2026-02-02 | 13F | Alliance Wealth Strategies, LLC d/b/a Brown Edwards Wealth Strategies | 9.000 | 210 | ||||||
| 2026-02-11 | 13F | Kilner Capital Advisors, Llc | 16.410 | 382 | ||||||
| 2026-02-13 | 13F | Visionary Wealth Advisors | 23.118 | 0,00 | 539 | 2,87 | ||||
| 2026-02-18 | 13F | GWM Advisors LLC | 18.868 | 0,00 | 440 | 2,81 | ||||
| 2026-02-17 | 13F | Advisor Group Holdings, Inc. | 4.516 | -23,37 | 105 | -21,64 | ||||
| 2026-02-03 | 13F | LJI Wealth Management, LLC | 27.062 | 177,90 | 631 | 186,36 | ||||
| 2026-01-14 | 13F | Kaufman Rossin Wealth, LLC | 1.240.724 | -0,72 | 28.909 | 2,12 | ||||
| 2026-01-20 | 13F | HMV Wealth Advisors, LLC | 537.732 | 20,48 | 12.529 | 23,94 | ||||
| 2026-01-20 | 13F | Stratos Wealth Partners, LTD. | 9.067 | -26,70 | 211 | -24,64 | ||||
| 2026-01-20 | 13F | HBE Wealth Management, LLC | 576.334 | 13.429 | ||||||
| 2026-01-20 | 13F | Kavar Capital Partners Group, Llc | 8.931 | 0,00 | 208 | 2,97 | ||||
| 2026-01-30 | 13F | Catalytic Wealth RIA, LLC | 90.597 | 0,00 | 2.111 | 2,83 | ||||
| 2026-02-03 | 13F | Ballentine Partners, LLC | 49.265 | 0,00 | 1.148 | 2,87 | ||||
| 2026-01-08 | 13F | Wedmont Private Capital | 60.853 | 1.458 | ||||||
| 2026-01-22 | 13F | Jackson Thornton Asset Management, Llc | 151.820 | 0,00 | 3.652 | 6,50 | ||||
| 2026-01-12 | 13F | Evanson Asset Management, LLC | 232.232 | 6,25 | 5.411 | 9,31 | ||||
| 2026-01-15 | 13F | Brady Martz Wealth Solutions, LLC | 715.560 | 4,93 | 16.673 | 7,94 | ||||
| 2026-01-27 | 13F/A | Capital Performance Advisors Llp | 87.853 | -17,43 | 2.047 | -15,10 | ||||
| 2026-02-10 | 13F | COFG Advisors, LLC | 12.192 | 284 | ||||||
| 2026-01-27 | 13F | Krilogy Financial LLC | 43.323 | 0,27 | 1.082 | 10,75 | ||||
| 2026-02-17 | 13F | Royal Bank Of Canada | 0 | -100,00 | 0 | |||||
| 2026-01-27 | 13F | Benningfield Financial Advisors, Llc | 541.315 | -2,72 | 12.613 | 0,07 | ||||
| 2026-01-29 | 13F | UBS Group AG | 613 | -81,66 | 14 | -81,33 | ||||
| 2026-02-13 | 13F | Colony Group, LLC | 36.371.177 | 5,56 | 847.448 | 8,59 | ||||
| 2026-01-14 | 13F | Northwest Wealth Management, Llc | 219.313 | 1,81 | 5.110 | 4,71 | ||||
| 2026-02-11 | 13F | Jpmorgan Chase & Co | 72.829 | 227,85 | 1.697 | 237,18 | ||||
| 2026-02-09 | 13F | Poinciana Advisors Group, Llc | 247.387 | -4,42 | 5.764 | -1,67 | ||||
| 2026-02-10 | 13F | Goldman Sachs Group Inc | 9.846 | 229 | ||||||
| 2026-01-15 | 13F | PFG Private Wealth Management, LLC | 0 | -100,00 | 0 | |||||
| 2026-02-17 | 13F | Two Sigma Investments, Lp | 46.500 | -17,41 | 1.083 | -15,06 | ||||
| 2026-02-12 | 13F | Commonwealth Equity Services, Llc | 0 | -100,00 | 0 | |||||
| 2026-02-06 | 13F | HighTower Advisors, LLC | 13.939 | -27,71 | 325 | -25,69 | ||||
| 2026-01-27 | 13F | Waterfront Wealth Inc. | 55.203 | 0,00 | 1.387 | 11,77 | ||||
| 2026-02-24 | 13F | Tru Independence Asset Management 2, Llc | 17.867 | -5,68 | 416 | -3,03 | ||||
| 2025-11-14 | 13F | NorthRock Partners, LLC | 0 | -100,00 | 0 | -100,00 | ||||
| 2026-02-13 | 13F | Pathstone Holdings, LLC | 16.897 | 0,00 | 394 | 2,88 | ||||
| 2026-01-14 | 13F | BWM Planning, LLC | 12.191 | 0,00 | 284 | 2,90 | ||||
| 2026-02-03 | 13F | RB Capital Management, LLC | 176.495 | 5,08 | 4.112 | 8,10 | ||||
| 2026-02-17 | 13F | Fmr Llc | 1.878 | 0,00 | 44 | 2,38 | ||||
| 2026-02-10 | 13F | Bridge Generations Wealth Management Llc | 7.375 | 0,00 | 172 | 2,40 | ||||
| 2026-03-02 | 13F | Cogent Strategic Wealth Llc | 261.105 | 6.535 | ||||||
| 2026-02-17 | 13F | Advisory Services Network, LLC | 9.486 | 1,48 | 221 | 4,74 | ||||
| 2026-02-05 | 13F | Gibson Capital, LLC | 621.416 | 0,53 | 14.479 | 3,40 | ||||
| 2026-02-10 | 13F | Bbr Partners, Llc | 9.045 | 0,00 | 211 | 2,94 | ||||
| 2026-02-11 | 13F | Buckingham Strategic Partners | 19.630.402 | 27,65 | 457.388 | 31,30 | ||||
| 2025-10-27 | 13F | PBMares Wealth Management LLC | 75.896 | 0,00 | 1.719 | 11,19 | ||||
| 2026-02-17 | 13F | Cetera Investment Advisers | 22.618 | 9,07 | 527 | 12,15 | ||||
| 2025-11-14 | 13F | Skopos Labs, Inc. | 0 | -100,00 | 0 | |||||
| 2026-02-12 | 13F | Moneta Group Investment Advisors Llc | 76.095 | -7,31 | 1.773 | -4,63 | ||||
| 2026-01-16 | 13F | Claris Advisors, Llc / Mo / | 1.221.532 | 2,97 | 28.462 | 17,72 | ||||
| 2026-02-13 | 13F | Smartleaf Asset Management LLC | 85.310 | 2.006 | ||||||
| 2026-02-10 | 13F | Envestnet Asset Management Inc | 1.152.863 | 2,72 | 26.862 | 5,66 | ||||
| 2026-01-13 | 13F | IFG Advisors, LLC | 108.297 | -8,87 | 2.523 | -6,24 | ||||
| 2026-01-14 | 13F | Thompson Investment Management, Inc. | 7.195 | 0,00 | 168 | 3,09 | ||||
| 2026-02-17 | 13F | Quantinno Capital Management LP | 14.162 | 330 | ||||||
| 2026-02-12 | 13F | Oath Planning, LLC | 107.728 | 2.510 | ||||||
| 2026-02-17 | 13F | Blueprint Investment Partners LLC | 10.092 | 235 | ||||||
| 2025-11-19 | 13F | Coldstream Capital Management Inc | 0 | -100,00 | 0 | |||||
| 2026-01-21 | 13F | Apella Capital, LLC | 9.148 | 0,00 | 213 | 5,97 | ||||
| 2026-01-30 | 13F | Belleair Asset Management, LLC | 40.598 | 946 | ||||||
| 2026-02-06 | 13F | Pnc Financial Services Group, Inc. | 9.920 | 0,00 | 231 | 3,13 | ||||
| 2026-02-23 | 13F | Beaird Harris Wealth Management, LLC | 40.599 | 0,00 | 946 | 2,83 | ||||
| 2026-01-20 | 13F | Capstone Wealth Management, LLC | 708.387 | 0,66 | 16.505 | 3,54 | ||||
| 2026-02-11 | 13F | Prism Planning Partners LLC | 191.982 | 4.473 | ||||||
| 2026-02-05 | 13F | Allworth Financial LP | 257.507 | -3,72 | 6.000 | -0,96 | ||||
| 2026-01-22 | 13F | Carlton Hofferkamp & Jenks Wealth Management, LLC | 52.645 | 0,00 | 1.227 | 1,83 | ||||
| 2026-02-11 | 13F | LPL Financial LLC | 107.019 | -1,42 | 2.494 | 1,42 | ||||
| 2026-02-17 | 13F | Susquehanna International Group, Llp | 19.698 | -38,48 | 459 | -36,83 | ||||
| 2026-01-22 | 13F | Bartlett & Co. Wealth Management Llc | 14.455 | 0,00 | 337 | 2,75 | ||||
| 2026-02-13 | 13F | Fiduciary Trust Co | 26.773 | -5,17 | 624 | -2,50 | ||||
| 2026-02-17 | 13F | RMB Capital Management, LLC | 82.395 | -10,64 | 1.920 | -8,09 | ||||
| 2026-02-06 | 13F | Delap Wealth Advisory, Llc | 256.062 | 4,77 | 5.966 | 7,59 | ||||
| 2026-01-16 | 13F | CogentBlue Wealth Advisors, LLC | 178.917 | 8,52 | 4.169 | 11,62 | ||||
| 2026-01-05 | 13F | Park Avenue Securities Llc | 136.747 | -0,37 | 3 | 0,00 | ||||
| 2026-01-27 | 13F | Symmetry Partners, LLC | 38.742 | -12,64 | 903 | -10,16 | ||||
| 2026-02-18 | 13F/A | Empowered Funds, LLC | 14.496 | 338 | ||||||
| 2026-01-08 | 13F | Baker Tilly Financial, Llc | 62.885 | -57,23 | 1.465 | -56,01 | ||||
| 2026-01-26 | 13F | Cwm, Llc | 113.335 | 12,80 | 3 | 0,00 | ||||
| 2026-01-22 | 13F | Squire Investment Management Company, LLC | 1.553.853 | 5,96 | 36.205 | 8,99 | ||||
| 2026-02-03 | 13F | Crestwood Advisors Group LLC | 11.069 | 0,00 | 258 | 2,80 | ||||
| 2026-02-02 | 13F | CENTRAL TRUST Co | 6.947 | 162 | ||||||
| 2026-02-13 | 13F | Mml Investors Services, Llc | 14.569 | 1,48 | 339 | 4,31 | ||||
| 2026-01-12 | 13F | Sax Wealth Advisors, Llc | 26.828 | 0,53 | 625 | 3,48 | ||||
| 2026-01-09 | 13F | Keb Asset Management, Llc | 1.621.003 | -0,54 | 37.769 | 2,31 |