Grundlæggende statistik
| Institutionelle ejere | 83 total, 83 long only, 0 short only, 0 long/short - change of 0,00% MRQ |
| Gennemsnitlig porteføljeallokering | 0.1994 % - change of 39,50% MRQ |
| Institutionelle aktier (lange) | 12.388.498 (ex 13D/G) - change of 0,34MM shares 2,83% MRQ |
| Institutionel værdi (lang) | $ 167.559 USD ($1000) |
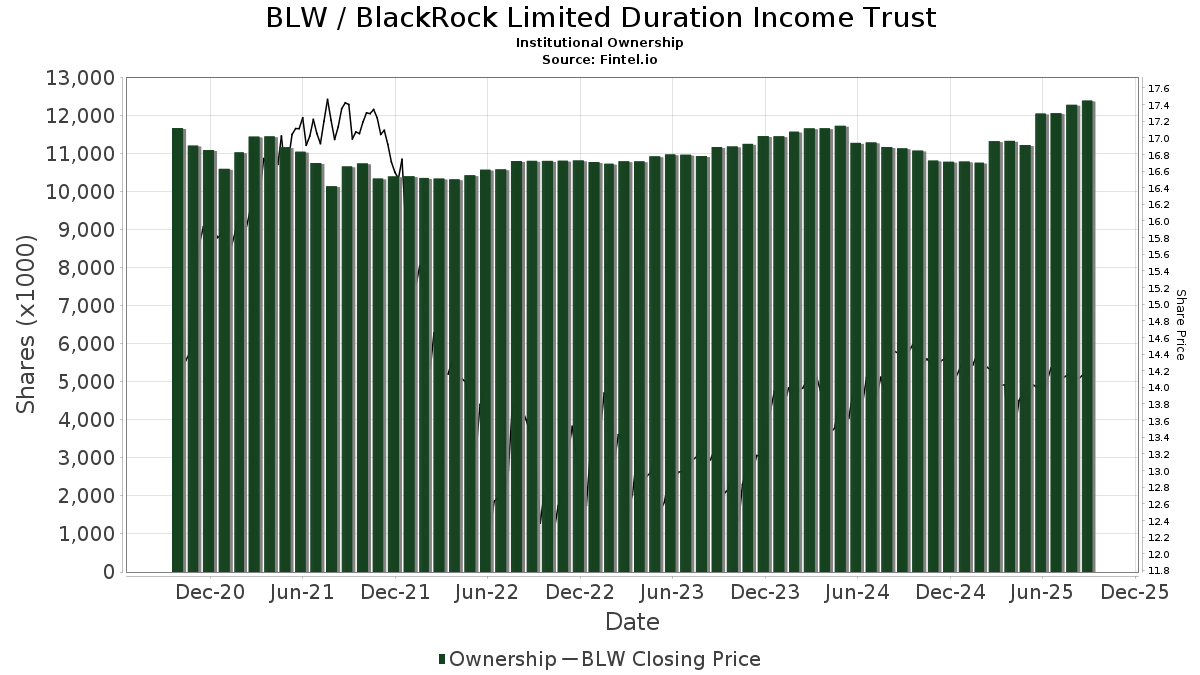
Institutionelt ejerskab og aktionærer
BlackRock Limited Duration Income Trust (US:BLW) har 83 institutionelle ejere og aktionærer, der har indsendt 13D/G- eller 13F-formularer til Securities Exchange Commission (SEC). Disse institutioner har i alt 12,388,498 aktier. Største aktionærer omfatter Morgan Stanley, Wells Fargo & Company/mn, Guggenheim Capital Llc, UBS Group AG, Venture Visionary Partners LLC, Cohen & Steers, Inc., Invesco Ltd., PCEF - Invesco CEF Income Composite ETF, Blue Zone Wealth Advisors, LLC, and Bank Of America Corp /de/ .
BlackRock Limited Duration Income Trust (NYSE:BLW) institutionel ejerskabsstruktur viser aktuelle positioner i virksomheden efter institutioner og fonde, samt seneste ændringer i positionsstørrelse. Større aktionærer kan omfatte individuelle investorer, investeringsforeninger, hedgefonde eller institutioner. Skema 13D angiver, at investoren besidder (eller besidder) mere end 5 % af virksomheden og har til hensigt (eller har til hensigt at) aktivt at forfølge en ændring i forretningsstrategi. Skema 13G indikerer en passiv investering på over 5%.
The share price as of September 16, 2025 is 14,12 / share. Previously, on September 17, 2024, the share price was 14,37 / share. This represents a decline of 1,74% over that period.
Fondens stemningsscore
Fund Sentiment Score (fka Ownership Accumulation Score) finder de aktier, der bliver mest købt af fonde. Det er resultatet af en sofistikeret, multi-faktor kvantitativ model, der identificerer virksomheder med de højeste niveauer af institutionel akkumulering. Scoringsmodellen bruger en kombination af den samlede stigning i oplyste ejere, ændringerne i porteføljeallokeringer i disse ejere og andre målinger. Tallet går fra 0 til 100, hvor højere tal indikerer et højere niveau af akkumulering for sine jævnaldrende, og 50 er gennemsnittet.
Opdateringsfrekvens: Dagligt
Se Ownership Explorer, som giver en liste over højest rangerende virksomheder.
Institutionel Put/Call-forhold
Ud over at indberette standardaktie- og gældsudstedelser skal institutter med mere end 100 mill. aktiver under forvaltning også oplyse deres put- og call-optionsbeholdninger. Da salgsoptioner generelt indikerer negativ stemning, og købsoptioner indikerer positiv stemning, kan vi få en fornemmelse af den overordnede institutionelle stemning ved at plotte forholdet mellem put og kald. Diagrammet til højre viser det historiske put/call-forhold for dette instrument.
Brug af Put/Call Ratio som en indikator for investorernes stemning overvinder en af de vigtigste mangler ved at bruge totalt institutionelt ejerskab, som er, at en betydelig mængde af aktiver under forvaltning investeres passivt for at spore indekser. Passivt forvaltede fonde køber typisk ikke optioner, så indikatoren for put/call-forholdet følger mere nøje følelsen af aktivt forvaltede fonde.
13F og NPORT arkivering
Detaljer om 13F-arkivering er gratis. Detaljer om NP-ansøgninger kræver et premium-medlemskab. Grønne rækker angiver nye positioner. Røde rækker angiver lukkede positioner. Klik på linket ikon for at se den fulde transaktionshistorik.
Opgrader
for at låse premium-data op og eksportere til Excel ![]() .
.
| Fil dato | Kilde | Investor | Type | Gennemsnitlig pris (Øst) |
Aktier | Δ Aktier (%) |
Rapporteret Værdi ($1000) |
Δ Værdi (%) |
Port Alloc (%) |
|
|---|---|---|---|---|---|---|---|---|---|---|
| 2025-07-31 | 13F | Jackson Hole Capital Partners, LLC | 15.624 | 222 | ||||||
| 2025-08-14 | 13F | Raymond James Financial Inc | 242.705 | 0,27 | 3.442 | 0,56 | ||||
| 2025-08-01 | 13F | Envestnet Asset Management Inc | 145.410 | 3,52 | 2.062 | 3,78 | ||||
| 2025-08-07 | 13F | Montag A & Associates Inc | 1.410 | 0,00 | 20 | 0,00 | ||||
| 2025-08-14 | 13F | BTG Pactual Asset Management US LLC | 37.630 | 0,00 | 534 | 0,19 | ||||
| 2025-08-19 | 13F | Newbridge Financial Services Group, Inc. | 2.979 | 42 | ||||||
| 2025-07-10 | 13F | Oliver Lagore Vanvalin Investment Group | 3.300 | 0,00 | 47 | 0,00 | ||||
| 2025-07-30 | NP | HYIN - WisdomTree Alternative Income Fund N/A | 127.977 | 285,67 | 1.789 | 284,73 | ||||
| 2025-07-17 | 13F/A | Capital Investment Advisors, LLC | 154.069 | -3,57 | 2.185 | -3,32 | ||||
| 2025-07-15 | 13F | Missouri Trust & Investment Co | 1.244 | 3,32 | 18 | 0,00 | ||||
| 2025-08-07 | 13F | Fountainhead AM, LLC | 69.536 | 1,18 | 986 | 1,54 | ||||
| 2025-07-18 | 13F | Consolidated Portfolio Review Corp | 21.590 | -22,81 | 306 | -22,53 | ||||
| 2025-08-08 | 13F | Capital Investment Advisory Services, LLC | 11.138 | 158 | ||||||
| 2025-08-14 | 13F | Comerica Bank | 51.909 | 9,61 | 736 | 10,01 | ||||
| 2025-04-01 | NP | CVY - Invesco Zacks Multi-Asset Income ETF This fund is a listed as child fund of Invesco Ltd. and if that institution has disclosed ownership in this security, then these positions will not be double counted when calculating total shares and total value | 24.513 | 5,97 | 352 | -11,81 | ||||
| 2025-08-14 | 13F | Papamarkou Wellner Asset Management inc. | 10.000 | 0,00 | 142 | 1,44 | ||||
| 2025-07-22 | 13F | Fortitude Advisory Group L.L.C. | 14.853 | 0,00 | 211 | 6,06 | ||||
| 2025-08-13 | 13F | Beacon Pointe Advisors, LLC | 21.195 | -0,77 | 301 | -0,66 | ||||
| 2025-08-05 | 13F | Pointe Capital Management LLC | 26.565 | 0,00 | 377 | 0,27 | ||||
| 2025-08-06 | 13F | Round Rock Advisors, LLC | 35.345 | 4,47 | 501 | 4,81 | ||||
| 2025-07-28 | 13F | Harbour Investments, Inc. | 190 | 0,00 | 3 | 0,00 | ||||
| 2025-08-07 | 13F | Samalin Investment Counsel, LLC | 0 | -100,00 | 0 | |||||
| 2025-07-25 | 13F | Concurrent Investment Advisors, LLC | 17.942 | 15,18 | 254 | 15,45 | ||||
| 2025-08-14 | 13F | Ameriprise Financial Inc | 13.677 | -27,28 | 194 | -27,17 | ||||
| 2025-07-18 | 13F | Bartlett & Co. Wealth Management Llc | 1.900 | 0,00 | 27 | 0,00 | ||||
| 2025-08-14 | 13F | Royal Bank Of Canada | 158.862 | -2,98 | 2.252 | -2,72 | ||||
| 2025-07-11 | 13F | Annex Advisory Services, LLC | 15.407 | 0,00 | 218 | 0,46 | ||||
| 2025-08-12 | 13F | LPL Financial LLC | 166.907 | 7,97 | 2.367 | 8,28 | ||||
| 2025-09-04 | 13F/A | Advisor Group Holdings, Inc. | 114.125 | 3,62 | 1.618 | 3,92 | ||||
| 2025-07-17 | 13F | Janney Montgomery Scott LLC | 26.199 | -2,01 | 0 | |||||
| 2025-07-08 | 13F | Nbc Securities, Inc. | 68.759 | 11,72 | 1 | |||||
| 2025-08-12 | 13F | MAI Capital Management | 15.475 | 0,68 | 219 | 0,92 | ||||
| 2025-08-08 | 13F | Fiera Capital Corp | 112.432 | -1,88 | 1.594 | -1,60 | ||||
| 2025-08-14 | 13F | UBS Group AG | 596.345 | -1,82 | 8.456 | -1,54 | ||||
| 2025-06-27 | NP | Calamos ETF Trust - Calamos CEF Income & Arbitrage ETF | 16.631 | 230 | ||||||
| 2025-08-05 | 13F | Verity Asset Management, Inc. | 54.438 | -0,44 | 772 | -0,26 | ||||
| 2025-08-14 | 13F | Wells Fargo & Company/mn | 1.005.137 | 1,62 | 14.253 | 1,91 | ||||
| 2025-08-14 | 13F | GWM Advisors LLC | 45.760 | -1,51 | 649 | -1,22 | ||||
| 2025-08-05 | 13F | Peregrine Asset Advisers, Inc. | 58.983 | 0,02 | 836 | 0,36 | ||||
| 2025-08-04 | 13F | Waterfront Wealth Inc. | 26.786 | -13,28 | 380 | -13,07 | ||||
| 2025-08-15 | 13F | Morgan Stanley | 4.565.087 | 1,25 | 64.733 | 1,53 | ||||
| 2025-07-24 | 13F | IFP Advisors, Inc | 2.439 | 2,09 | 35 | 3,03 | ||||
| 2025-06-25 | NP | VPC - Virtus Private Credit Strategy ETF | 59.263 | 4,35 | 820 | 0,61 | ||||
| 2025-07-16 | 13F | Moisand Fitzgerald Tamayo, LLC | 500 | 0,00 | 7 | 0,00 | ||||
| 2025-08-08 | 13F | Wealth Alliance | 55.701 | 1,99 | 790 | 2,20 | ||||
| 2025-05-14 | 13F | Virtus ETF Advisers LLC | 0 | -100,00 | 0 | |||||
| 2025-07-21 | 13F | Crews Bank & Trust | 1.350 | 0,00 | 19 | 0,00 | ||||
| 2025-07-25 | 13F | Atria Wealth Solutions, Inc. | 0 | -100,00 | 0 | |||||
| 2025-07-30 | 13F | Cullen/frost Bankers, Inc. | 0 | -100,00 | 0 | |||||
| 2025-08-08 | 13F | Cetera Investment Advisers | 67.743 | 13,33 | 961 | 13,61 | ||||
| 2025-08-08 | 13F | Pnc Financial Services Group, Inc. | 2.860 | 2,44 | 41 | 2,56 | ||||
| 2025-08-11 | 13F | Principal Securities, Inc. | 172.147 | -19,15 | 2.441 | -18,85 | ||||
| 2025-08-12 | 13F | Jefferies Financial Group Inc. | 145.210 | -0,59 | 2.059 | -0,29 | ||||
| 2025-08-18 | 13F | Geneos Wealth Management Inc. | 991 | 0,00 | 14 | 0,00 | ||||
| 2025-05-19 | 13F | Smith Asset Management Co., LLC | 53.006 | 0,64 | 750 | 0,67 | ||||
| 2025-08-15 | 13F | Kestra Advisory Services, LLC | 27.317 | 130,68 | 387 | 131,74 | ||||
| 2025-07-24 | 13F | Us Bancorp \de\ | 19.900 | 0,00 | 282 | 0,36 | ||||
| 2025-07-24 | 13F | Blue Zone Wealth Advisors, LLC | 309.458 | 2,60 | 4.388 | 2,91 | ||||
| 2025-08-14 | 13F | Mml Investors Services, Llc | 15.852 | 1,40 | 0 | |||||
| 2025-04-16 | 13F | Fortitude Family Office, LLC | 0 | -100,00 | 0 | |||||
| 2025-08-11 | 13F | Elequin Capital Lp | 0 | -100,00 | 0 | |||||
| 2025-07-28 | NP | PCEF - Invesco CEF Income Composite ETF This fund is a listed as child fund of Invesco Ltd. and if that institution has disclosed ownership in this security, then these positions will not be double counted when calculating total shares and total value | 316.086 | 3,54 | 4.419 | 1,63 | ||||
| 2025-07-30 | 13F | Bogart Wealth, LLC | 1.618 | 0,00 | 23 | 0,00 | ||||
| 2025-08-06 | 13F | Prospera Financial Services Inc | 14.764 | -2,35 | 209 | -1,88 | ||||
| 2025-08-13 | 13F | Virtus Investment Advisers, Inc. | 48.452 | -25,32 | 687 | -25,08 | ||||
| 2025-08-13 | 13F | Baird Financial Group, Inc. | 130.779 | 2,01 | 1.854 | 2,32 | ||||
| 2025-07-24 | 13F | Ronald Blue Trust, Inc. | 1.309 | 0,00 | 19 | 0,00 | ||||
| 2025-08-29 | NP | GraniteShares ETF Trust - GraniteShares HIPS US High Income ETF | 198.414 | 6,66 | 2.814 | 6,96 | ||||
| 2025-08-14 | 13F | Cura Wealth Advisors, Llc | 95.238 | 0,00 | 1.350 | 0,30 | ||||
| 2025-08-14 | 13F | CoreCap Advisors, LLC | 2.351 | -29,31 | 33 | -29,79 | ||||
| 2025-08-11 | 13F | Shufro Rose & Co Llc | 25.900 | 0,00 | 366 | 0,00 | ||||
| 2025-08-06 | 13F | Commonwealth Equity Services, Llc | 38.935 | 7,77 | 1 | |||||
| 2025-08-07 | 13F | Allworth Financial LP | 1.306 | 1,08 | 19 | 5,88 | ||||
| 2025-08-12 | 13F | Proequities, Inc. | 0 | 0 | ||||||
| 2025-08-14 | 13F | Stifel Financial Corp | 12.459 | 0,00 | 177 | 0,00 | ||||
| 2025-05-08 | 13F | Plante Moran Financial Advisors, LLC | 0 | -100,00 | 0 | |||||
| 2025-07-17 | 13F | Venture Visionary Partners LLC | 539.864 | 15,00 | 7.655 | 15,34 | ||||
| 2025-08-13 | 13F | Orleans Capital Management Corp/la | 40.500 | 0,00 | 574 | 0,35 | ||||
| 2025-07-17 | 13F | GraniteShares Advisors LLC | 198.414 | 6,66 | 2.814 | 6,96 | ||||
| 2025-08-13 | 13F | Guggenheim Capital Llc | 825.295 | 8,47 | 11.703 | 8,77 | ||||
| 2025-08-14 | 13F | Bank Of America Corp /de/ | 279.343 | 6,02 | 3.961 | 6,34 | ||||
| 2025-07-15 | 13F | North Star Investment Management Corp. | 500 | 0,00 | 7 | 0,00 | ||||
| 2025-08-18 | 13F | Hollencrest Capital Management | 3.500 | 0,00 | 50 | 0,00 | ||||
| 2025-07-14 | 13F | Hoey Investments, Inc | 171 | 0,00 | 2 | 0,00 | ||||
| 2025-08-06 | 13F | Ethos Financial Group, LLC | 137.197 | -13,27 | 1.945 | -13,01 | ||||
| 2025-08-14 | 13F | Cohen & Steers, Inc. | 371.801 | 0,00 | 5 | 0,00 | ||||
| 2025-07-31 | 13F | Cambridge Investment Research Advisors, Inc. | 44.338 | -1,04 | 1 | |||||
| 2025-07-24 | 13F | WMG Financial Advisors, LLC | 10.575 | 0,00 | 150 | 0,00 | ||||
| 2025-08-12 | 13F | Pathstone Holdings, LLC | 14.175 | 2,47 | 201 | 3,08 | ||||
| 2025-08-13 | 13F | Invesco Ltd. | 328.224 | -0,46 | 4.654 | -0,17 | ||||
| 2025-08-08 | 13F | ProVise Management Group, LLC | 13.818 | 0,00 | 196 | 0,00 |