Grundlæggende statistik
| Institutionelle aktier (lange) | 35.926.675 - 23,90% (ex 13D/G) - change of 8,69MM shares 31,91% MRQ |
| Institutionel værdi (lang) | $ 1.310.264 USD ($1000) |
Institutionelt ejerskab og aktionærer
Bullish (US:BLSH) har 171 institutionelle ejere og aktionærer, der har indsendt 13D/G- eller 13F-formularer til Securities Exchange Commission (SEC). Disse institutioner har i alt 35,926,675 aktier. Største aktionærer omfatter Fmr Llc, ARK Investment Management LLC, BlackRock, Inc., Sumitomo Mitsui Trust Holdings, Inc., Nikko Asset Management Americas, Inc., Invesco Ltd., Massachusetts Financial Services Co /ma/, UBS Group AG, Janus Henderson Group Plc, and Stephens Investment Management Group LLC .
Bullish (NYSE:BLSH) institutionel ejerskabsstruktur viser aktuelle positioner i virksomheden efter institutioner og fonde, samt seneste ændringer i positionsstørrelse. Større aktionærer kan omfatte individuelle investorer, investeringsforeninger, hedgefonde eller institutioner. Skema 13D angiver, at investoren besidder (eller besidder) mere end 5 % af virksomheden og har til hensigt (eller har til hensigt at) aktivt at forfølge en ændring i forretningsstrategi. Skema 13G indikerer en passiv investering på over 5%.
The share price as of April 24, 2026 is 39,95 / share. Previously, on August 13, 2025, the share price was 68,00 / share. This represents a decline of 41,25% over that period.
Fondens stemningsscore
Fund Sentiment Score (fka Ownership Accumulation Score) finder de aktier, der bliver mest købt af fonde. Det er resultatet af en sofistikeret, multi-faktor kvantitativ model, der identificerer virksomheder med de højeste niveauer af institutionel akkumulering. Scoringsmodellen bruger en kombination af den samlede stigning i oplyste ejere, ændringerne i porteføljeallokeringer i disse ejere og andre målinger. Tallet går fra 0 til 100, hvor højere tal indikerer et højere niveau af akkumulering for sine jævnaldrende, og 50 er gennemsnittet.
Opdateringsfrekvens: Dagligt
Se Ownership Explorer, som giver en liste over højest rangerende virksomheder.
AI+ Ask Fintel’s AI assistant about Bullish.
Select a question to share a public post with an AI-crafted answer.
Thinking of good questions…
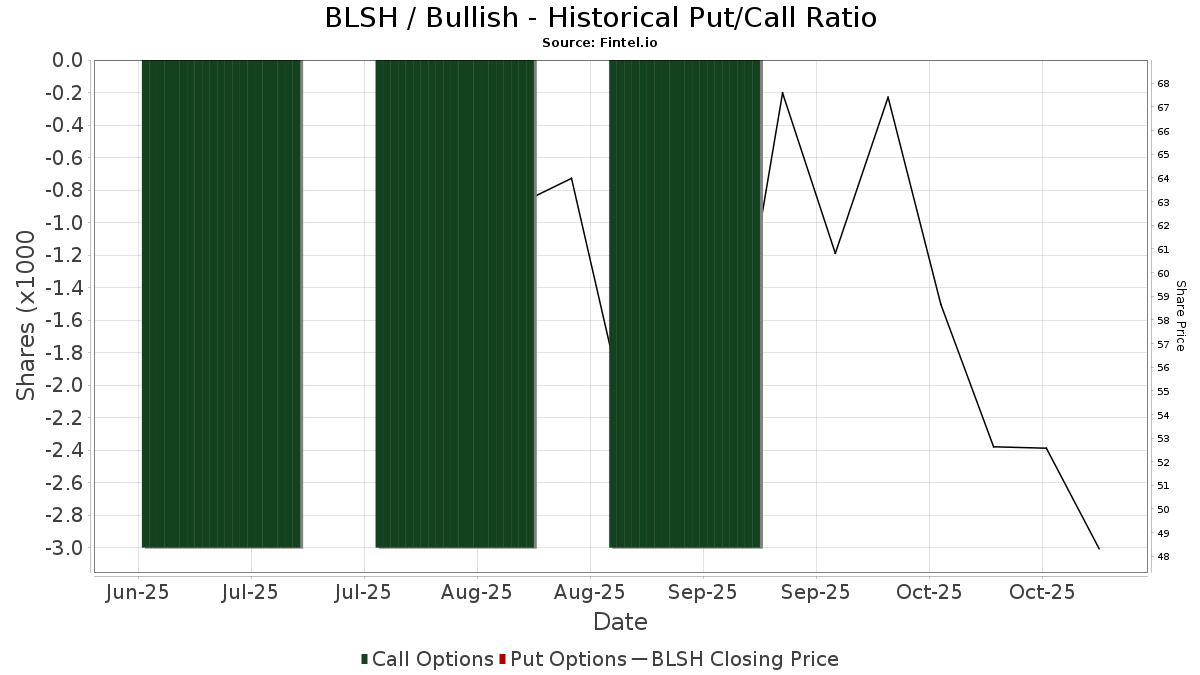
Institutionel Put/Call-forhold
Ud over at indberette standardaktie- og gældsudstedelser skal institutter med mere end 100 mill. aktiver under forvaltning også oplyse deres put- og call-optionsbeholdninger. Da salgsoptioner generelt indikerer negativ stemning, og købsoptioner indikerer positiv stemning, kan vi få en fornemmelse af den overordnede institutionelle stemning ved at plotte forholdet mellem put og kald. Diagrammet til højre viser det historiske put/call-forhold for dette instrument.
Brug af Put/Call Ratio som en indikator for investorernes stemning overvinder en af de vigtigste mangler ved at bruge totalt institutionelt ejerskab, som er, at en betydelig mængde af aktiver under forvaltning investeres passivt for at spore indekser. Passivt forvaltede fonde køber typisk ikke optioner, så indikatoren for put/call-forholdet følger mere nøje følelsen af aktivt forvaltede fonde.
13D/G-arkivering
Vi præsenterer 13D/G ansøgninger separat fra 13F ansøgninger på grund af den forskellige behandling af SEC. 13D/G-ansøgninger kan indgives af grupper af investorer (med én ledende), hvorimod 13F-ansøgninger ikke kan. Dette resulterer i situationer, hvor en investor kan indsende en 13D/G, der rapporterer én værdi for de samlede aktier (der repræsenterer alle de aktier, der ejes af investorgruppen), men derefter indsender en 13F, der rapporterer en anden værdi for de samlede aktier (der udelukkende repræsenterer deres egne) ejendomsret). Det betyder, at aktieejerskab af 13D/G-arkiver og 13F-arkiveringer ofte ikke er direkte sammenlignelige, så vi præsenterer dem separat.
Bemærk: Fra den 16. maj 2021 viser vi ikke længere ejere, der ikke har indsendt en 13D/G inden for det seneste år. Tidligere viste vi den fulde historie af 13D/G-arkiver. Generelt skal enheder, der er forpligtet til at indgive 13D/G-ansøgninger, indgive mindst årligt, før de indsender en afsluttende ansøgning. Dog forlader fonde nogle gange positioner uden at indsende en afsluttende ansøgning (dvs. de afvikler), så visning af den fulde historie resulterede nogle gange i forvirring om det nuværende ejerskab. For at undgå forvirring viser vi nu kun 'aktuelle' ejere - det vil sige - ejere, der har anmeldt inden for det seneste år.
Upgrade to unlock premium data.
| Fil dato | Form | Investor | Forrige Aktier |
Seneste Aktier |
Δ Aktier (Procent) |
Ejendomsret (Procent) |
Δ Ejerskab (Procent) |
|
|---|---|---|---|---|---|---|---|---|
| 2026-02-09 | Blumer Brendan Francis | 41,134,432 | 39,166,869 | -4.78 | 26.80 | -4.63 | ||
| 2025-11-14 | EFM Asset Management | 17,375,638 | 11.89 | |||||
| 2025-09-10 | See Alexander | 9,864,857 | 6.70 | |||||
| 2025-08-21 | Kokuei Yuan | 36,453,037 | 24.90 |
13F og NPORT arkivering
Detaljer om 13F-arkivering er gratis. Detaljer om NP-ansøgninger kræver et premium-medlemskab. Grønne rækker angiver nye positioner. Røde rækker angiver lukkede positioner. Klik på linket ikon for at se den fulde transaktionshistorik.
Opgrader
for at låse premium-data op og eksportere til Excel ![]() .
.
| Fil dato | Kilde | Investor | Type | Gennemsnitlig pris (Øst) |
Aktier | Δ Aktier (%) |
Rapporteret Værdi ($1000) |
Δ Værdi (%) |
Port Alloc (%) |
|
|---|---|---|---|---|---|---|---|---|---|---|
| 2026-02-13 | 13F | Citigroup Inc | 12.729 | 303,58 | 482 | 141,00 | ||||
| 2026-04-15 | 13F | Activest Wealth Management | 63 | 2 | ||||||
| 2026-02-17 | 13F | Lazard Asset Management Llc | 134.582 | 54,27 | 5.097 | -8,16 | ||||
| 2026-02-06 | 13F | Harvest Portfolios Group Inc. | 52.553 | 1.990 | ||||||
| 2026-02-11 | 13F | Jpmorgan Chase & Co | 163.512 | 5,45 | 6.192 | -37,22 | ||||
| 2026-02-11 | 13F | Zions Bancorporation, National Association /ut/ | 23 | 1 | ||||||
| 2026-02-13 | 13F | Lord, Abbett & Co. Llc | 0 | -100,00 | 0 | -100,00 | ||||
| 2026-02-13 | 13F | Vontobel Holding Ltd. | 4.558 | -15,72 | 173 | -50,00 | ||||
| 2026-02-17 | 13F | Steadfast Capital Management Lp | 0 | -100,00 | 0 | |||||
| 2026-02-13 | 13F | Vontobel Holding Ltd. | Call | 14.000 | 258,97 | 530 | 113,71 | |||
| 2026-04-07 | 13F | Farther Finance Advisors, LLC | 1.416 | 234,75 | 50 | 206,25 | ||||
| 2026-04-13 | 13F | IFP Advisors, Inc | 1.291 | -7,06 | 46 | -11,54 | ||||
| 2026-01-29 | 13F | Renaissance Capital LLC | 21.052 | -45,02 | 797 | -67,27 | ||||
| 2026-02-06 | 13F | Global Retirement Partners, LLC | 144 | 1.340,00 | 5 | |||||
| 2026-02-17 | 13F | Royal Bank Of Canada | 25.099 | -78,21 | 950 | -87,03 | ||||
| 2026-02-17 | 13F | Readystate Asset Management Lp | 30.021 | 20,08 | 1.137 | -28,55 | ||||
| 2026-02-11 | 13F | Simplex Trading, Llc | 0 | -100,00 | 0 | |||||
| 2026-02-17 | 13F | Sandia Investment Management LP | 10.000 | 4.900,00 | 379 | 3.050,00 | ||||
| 2026-02-17 | 13F | Tudor Investment Corp Et Al | 0 | -100,00 | 0 | -100,00 | ||||
| 2026-04-13 | 13F | Gill Capital Partners, Llc | 375 | 13 | ||||||
| 2026-04-15 | 13F | Exchange Traded Concepts, Llc | 307.777 | 131,45 | 10.997 | 118,39 | ||||
| 2026-04-24 | 13F | Strs Ohio | 767 | -3,16 | 27 | -6,90 | ||||
| 2026-02-12 | 13F | Renaissance Technologies Llc | 56.333 | 2.133 | ||||||
| 2026-02-17 | 13F | Price T Rowe Associates Inc /md/ | 15.179 | 1 | ||||||
| 2026-02-17 | 13F | Freestone Grove Partners LP | 269.015 | 79,34 | 10.188 | 6,77 | ||||
| 2026-02-17 | 13F | Russell Investments Group, Ltd. | 2.792 | 106 | ||||||
| 2026-02-13 | 13F | Soros Fund Management Llc | 108.200 | -47,29 | 4.098 | -68,62 | ||||
| 2026-02-17 | 13F | Tiger Global Management Llc | 100.000 | 0,00 | 3.787 | -40,47 | ||||
| 2026-02-11 | 13F | LPL Financial LLC | 32.200 | 61,57 | 1.219 | -3,79 | ||||
| 2026-02-13 | 13F | Sculptor Capital LP | 142.800 | 325,00 | 5.408 | 153,02 | ||||
| 2026-02-13 | 13F | Sculptor Capital LP | Put | 142.800 | 325,00 | 5.408 | 153,02 | |||
| 2026-02-13 | 13F | Marshall Wace, Llp | 0 | -100,00 | 0 | |||||
| 2026-02-13 | 13F | Quarry LP | 250 | 9 | ||||||
| 2026-01-29 | 13F | Rakuten Securities, Inc. | 736 | 28 | ||||||
| 2026-02-05 | 13F | Allworth Financial LP | 1.031 | 0,59 | 39 | -40,00 | ||||
| 2026-02-17 | 13F | Armistice Capital, Llc | 7.419 | 281 | ||||||
| 2026-02-04 | 13F | Ameritas Advisory Services, LLC | 0 | -100,00 | 0 | |||||
| 2026-04-06 | 13F | GAMMA Investing LLC | 739 | 739,77 | 26 | 766,67 | ||||
| 2026-02-13 | 13F | Verition Fund Management LLC | 0 | -100,00 | 0 | |||||
| 2026-02-17 | 13F | Advisor Group Holdings, Inc. | 1.349 | -13,75 | 51 | -47,42 | ||||
| 2026-02-17 | 13F | D. E. Shaw & Co., Inc. | 0 | -100,00 | 0 | |||||
| 2026-02-17 | 13F | State Of Wisconsin Investment Board | 0 | -100,00 | 0 | |||||
| 2026-02-11 | 13F | Winton Capital Group Ltd | 107.892 | -3,32 | 4.086 | -42,45 | ||||
| 2026-02-05 | 13F | Cambridge Investment Research Advisors, Inc. | 10.077 | 57,90 | 0 | |||||
| 2026-02-12 | 13F | Steward Partners Investment Advisory, Llc | 936 | -23,78 | 35 | -55,13 | ||||
| 2026-02-05 | 13F | Elyxium Wealth, LLC | 25 | 1 | ||||||
| 2026-02-17 | 13F | Delta Global Management LP | 23.500 | 890 | ||||||
| 2026-02-17 | 13F | Qube Research & Technologies Ltd | 0 | -100,00 | 0 | |||||
| 2026-02-13 | 13F | Healthcare Of Ontario Pension Plan Trust Fund | 0 | -100,00 | 0 | |||||
| 2026-02-02 | 13F | Benjamin Edwards Inc | 19.892 | 73,40 | 753 | 3,29 | ||||
| 2026-04-21 | 13F | Robeco Institutional Asset Management B.V. | 180.000 | 12,50 | 6.431 | 6,14 | ||||
| 2026-02-12 | 13F | Bank Of Montreal /can/ | 0 | -100,00 | 0 | |||||
| 2026-02-17 | 13F | MIRAE ASSET GLOBAL ETFS HOLDINGS Ltd. | 7.658 | 290 | ||||||
| 2026-02-17 | 13F | Blackstone Group Inc | 200.000 | 0,00 | 7.574 | -40,47 | ||||
| 2026-04-23 | 13F | TFC Financial Management | 0 | -100,00 | 0 | |||||
| 2026-02-13 | 13F | NLB Skladi, upravljanje premozenja, d.o.o. | 11.352 | 430 | ||||||
| 2026-02-17 | 13F | Weiss Asset Management LP | 0 | -100,00 | 0 | -100,00 | ||||
| 2026-02-17 | 13F | Balyasny Asset Management Llc | 333.372 | -50,64 | 12.625 | -70,62 | ||||
| 2026-02-17 | 13F | Boothbay Fund Management, Llc | 10.786 | 408 | ||||||
| 2026-04-13 | 13F | True Wealth Design, LLC | 16 | 1 | ||||||
| 2026-02-13 | 13F | Mariner, LLC | 0 | -100,00 | 0 | |||||
| 2026-02-17 | 13F | Gotham Asset Management, LLC | 51.256 | 935,27 | 1.941 | 518,15 | ||||
| 2026-02-17 | 13F | Lykos Global Management, LP | 100.000 | 3.787 | ||||||
| 2026-02-17 | 13F | Private Advisor Group, LLC | 0 | -100,00 | 0 | |||||
| 2026-01-21 | 13F | Prime Capital Investment Advisors, LLC | 0 | -100,00 | 0 | |||||
| 2026-02-10 | 13F | Bnp Paribas Arbitrage, Sa | 12.800 | 485 | ||||||
| 2026-02-17 | 13F | Philadelphia Financial Management of San Francisco, LLC | Put | 300.000 | 150,00 | 11.361 | 48,84 | |||
| 2026-02-17 | 13F | Philadelphia Financial Management of San Francisco, LLC | 125.000 | 614,29 | 4.734 | 325,25 | ||||
| 2026-04-13 | 13F | Massmutual Trust Co Fsb/adv | 14 | 0 | ||||||
| 2026-01-29 | 13F | UBS Group AG | 1.309.248 | 486,05 | 49.581 | 248,92 | ||||
| 2026-02-10 | 13F | Td Asset Management Inc | 49.104 | -12,18 | 1.860 | -47,72 | ||||
| 2026-02-12 | 13F | New York State Common Retirement Fund | 13.500 | 511 | ||||||
| 2026-04-07 | 13F | Signaturefd, Llc | 100 | 0,00 | 4 | 0,00 | ||||
| 2026-02-12 | 13F | Nuveen, LLC | 82.418 | 203,35 | 3.121 | 80,61 | ||||
| 2026-02-13 | 13F | Peak6 Llc | Call | 0 | -100,00 | 0 | ||||
| 2026-04-27 | 13F | Leonteq Securities AG | 1.881 | -32,82 | 67 | -36,79 | ||||
| 2026-02-13 | 13F | Peak6 Llc | Put | 0 | -100,00 | 0 | ||||
| 2026-02-13 | 13F | Stifel Financial Corp | 6.950 | 263 | ||||||
| 2026-02-10 | 13F | Bank of New York Mellon Corp | 75.726 | 2.868 | ||||||
| 2026-02-12 | 13F | Bank Of Montreal /can/ | Put | 0 | -100,00 | 0 | ||||
| 2026-04-13 | 13F | Global X Japan Co., Ltd. | 852 | 30 | ||||||
| 2026-02-13 | 13F | Walleye Trading LLC | Put | 37.700 | -25,35 | 1.428 | -55,57 | |||
| 2026-01-16 | 13F | FNY Investment Advisers, LLC | 0 | -100,00 | 0 | |||||
| 2026-02-13 | 13F | Walleye Trading LLC | Call | 106.900 | 44,26 | 4.048 | -14,11 | |||
| 2026-02-17 | 13F | Captrust Financial Advisors | 9.267 | 123,79 | 351 | 33,08 | ||||
| 2026-01-16 | 13F | FNY Investment Advisers, LLC | Call | 0 | -100,00 | 0 | ||||
| 2026-02-13 | 13F | Kestra Advisory Services, LLC | 1.607 | 61 | ||||||
| 2026-02-10 | 13F | KERR FINANCIAL PLANNING Corp | 75 | 0,00 | 2 | -50,00 | ||||
| 2026-01-23 | 13F | Nbt Bank N A /ny | 38 | -40,62 | 4 | -33,33 | ||||
| 2026-02-17 | 13F | Millennium Management Llc | Put | 0 | -100,00 | 0 | ||||
| 2026-02-17 | 13F | Woodline Partners LP | 0 | -100,00 | 0 | |||||
| 2026-02-17 | 13F | Parallax Volatility Advisers, L.P. | Put | 0 | -100,00 | 0 | ||||
| 2026-02-18 | 13F | Vident Advisory, LLC | 6.120 | 232 | ||||||
| 2026-02-17 | 13F | Parallax Volatility Advisers, L.P. | Call | 0 | -100,00 | 0 | ||||
| 2026-04-20 | 13F | City State Bank | 250 | 0,00 | 9 | -11,11 | ||||
| 2026-01-20 | 13F | Steel Peak Wealth Management LLC | 7.558 | 286 | ||||||
| 2026-02-02 | 13F | Avidian Wealth Solutions, LLC | 0 | -100,00 | 0 | |||||
| 2026-02-12 | 13F | Monashee Investment Management LLC | 0 | -100,00 | 0 | |||||
| 2026-02-09 | 13F | Geode Capital Management, Llc | 315.536 | 102,80 | 11.949 | 20,75 | ||||
| 2026-02-04 | 13F | Nwam Llc | 0 | -100,00 | 0 | -100,00 | ||||
| 2026-02-17 | 13F | Millennium Management Llc | 99.252 | 95,10 | 3.759 | 16,17 | ||||
| 2026-02-02 | 13F | Principal Financial Group Inc | 0 | -100,00 | 0 | |||||
| 2026-02-12 | 13F | BlackRock, Inc. | 2.797.427 | 2,05 | 105.939 | -39,24 | ||||
| 2026-02-13 | 13F | Barclays Plc | 643 | -98,13 | 24 | -98,90 | ||||
| 2026-04-07 | 13F | Estate Planners Group, LLC | 95 | 4 | ||||||
| 2026-02-10 | 13F | Goldman Sachs Group Inc | Put | 33.400 | 1.265 | |||||
| 2026-02-10 | 13F | Goldman Sachs Group Inc | 40.712 | -14,12 | 1.542 | -48,89 | ||||
| 2026-02-13 | 13F | Morgan Stanley | 163.220 | 189,74 | 6.181 | 72,51 | ||||
| 2026-02-11 | 13F | Group One Trading, L.p. | 0 | -100,00 | 0 | |||||
| 2026-02-13 | 13F | State Street Corp | 275.045 | 10.416 | ||||||
| 2026-02-11 | 13F | Cerity Partners LLC | 0 | -100,00 | 0 | |||||
| 2026-02-17 | 13F | Susquehanna International Group, Llp | Call | 746.000 | -38,18 | 28.251 | -63,19 | |||
| 2026-02-17 | 13F | LMR Partners LLP | 153.204 | 0,00 | 5.802 | -40,47 | ||||
| 2026-02-17 | 13F | Susquehanna International Group, Llp | 319.663 | 145,73 | 12.106 | 46,30 | ||||
| 2026-02-17 | 13F | Susquehanna International Group, Llp | Put | 627.800 | -10,49 | 23.775 | -46,71 | |||
| 2026-02-03 | 13F | Mitsubishi UFJ Kokusai Asset Management Co., Ltd. | 42.800 | 0,00 | 1.680 | -38,28 | ||||
| 2026-02-17 | 13F | Two Sigma Advisers, Lp | 0 | -100,00 | 0 | |||||
| 2026-01-21 | 13F | Newbridge Financial Services Group, Inc. | 4.435 | 40,13 | 168 | -16,92 | ||||
| 2026-02-13 | 13F | Arrowstreet Capital, Limited Partnership | 461.247 | 168,90 | 17.467 | 60,09 | ||||
| 2026-02-17 | 13F | Fortress Investment Group LLC | 0 | -100,00 | 0 | |||||
| 2026-04-27 | 13F | Td Private Client Wealth Llc | 5 | 0 | ||||||
| 2026-02-13 | 13F | Hudson Bay Capital Management LP | 0 | -100,00 | 0 | |||||
| 2026-02-09 | 13F | Emerald Mutual Fund Advisers Trust | 5.000 | 0,00 | 189 | -40,57 | ||||
| 2026-02-09 | 13F | Global Assets Advisory, LLC | 0 | -100,00 | 0 | |||||
| 2026-02-11 | 13F | Nikko Asset Management Americas, Inc. | 2.524.820 | 95.514 | ||||||
| 2026-02-09 | 13F | Legal & General Group Plc | 3.183 | -4,73 | 121 | -43,40 | ||||
| 2026-02-13 | 13F | Sei Investments Co | 21.341 | 275,52 | 808 | 123,82 | ||||
| 2026-02-12 | 13F | Davy Global Fund Management Ltd | 137.734 | 155,99 | 5.216 | 52,40 | ||||
| 2026-02-11 | 13F | Franklin Resources Inc | 41.467 | 3,67 | 1.570 | -38,29 | ||||
| 2026-02-12 | 13F | MetLife Investment Management, LLC | 788 | 30 | ||||||
| 2026-02-17 | 13F | Citadel Advisors Llc | Put | 321.900 | -53,00 | 12.190 | -72,02 | |||
| 2026-02-13 | 13F | Gts Securities Llc | 0 | -100,00 | 0 | |||||
| 2026-02-17 | 13F | Citadel Advisors Llc | Call | 376.000 | -76,85 | 14.239 | -86,22 | |||
| 2026-02-17 | 13F | Jones Financial Companies Lllp | 291 | 11 | ||||||
| 2026-02-12 | 13F | Penserra Capital Management LLC | 264 | 0 | ||||||
| 2026-02-13 | 13F | B & T Capital Management DBA Alpha Capital Management | 15.514 | 37,15 | 588 | -18,36 | ||||
| 2026-01-26 | 13F | Cwm, Llc | 485 | 0,00 | 0 | |||||
| 2026-02-06 | 13F | Tortoise Investment Management, LLC | Put | 0 | -100,00 | 0 | ||||
| 2026-01-23 | 13F | Sumitomo Mitsui Trust Holdings, Inc. | 2.529.313 | 75,29 | 95.785 | 4,36 | ||||
| 2026-02-17 | 13F | Northern Trust Corp | 52.649 | 1.994 | ||||||
| 2026-02-18 | 13F | EP Wealth Advisors, Inc. | 8.500 | 322 | ||||||
| 2026-02-10 | 13F | Rovida Investment Management Ltd | 200.000 | -24,26 | 7.566 | -54,96 | ||||
| 2026-02-17 | 13F | Public Employees Retirement System Of Ohio | 9.953 | 377 | ||||||
| 2026-01-29 | 13F | Vanguard Group Inc | 43.200 | 1.636 | ||||||
| 2026-02-11 | 13F | BIT Capital GmbH | 0 | -100,00 | 0 | |||||
| 2026-02-17 | 13F | Schonfeld Strategic Advisors LLC | 0 | -100,00 | 0 | |||||
| 2026-02-17 | 13F | Zimmer Partners, LP | 110.000 | 0,00 | 4.166 | -40,47 | ||||
| 2026-02-13 | 13F | Umb Bank N A/mo | 70 | 3 | ||||||
| 2026-02-18 | 13F | GWM Advisors LLC | 0 | -100,00 | 0 | |||||
| 2026-02-17 | 13F | Capital Fund Management S.a. | Call | 23.500 | 890 | |||||
| 2026-02-17 | 13F | Engineers Gate Manager LP | 0 | -100,00 | 0 | |||||
| 2026-01-14 | 13F | Tradewinds Capital Management, LLC | 0 | -100,00 | 0 | |||||
| 2026-02-13 | 13F | Scge Management, L.p. | 0 | -100,00 | 0 | |||||
| 2026-02-12 | 13F | Marex Group plc | 131.028 | 4.962 | ||||||
| 2026-02-10 | 13F | Seven Grand Managers, Llc | 150.000 | 0,00 | 5.680 | -40,47 | ||||
| 2026-02-17 | 13F | Raymond James Financial Inc | 5.364 | -53,55 | 203 | -72,34 | ||||
| 2026-02-17 | 13F | Jain Global LLC | 0 | -100,00 | 0 | |||||
| 2026-02-12 | 13F | Jane Street Group, Llc | 174.881 | -17,58 | 6.623 | -50,94 | ||||
| 2026-02-17 | 13F | Clear Street Markets Llc | 46.760 | 1.771 | ||||||
| 2026-02-12 | 13F | Jane Street Group, Llc | Put | 257.400 | -6,13 | 9.748 | -44,11 | |||
| 2025-11-14 | 13F | Wolverine Trading, Llc | 37.292 | 2.323 | ||||||
| 2025-11-14 | 13F | Wolverine Trading, Llc | Call | 132.600 | 8.261 | |||||
| 2026-02-12 | 13F | Jane Street Group, Llc | Call | 845.900 | 5,61 | 32.034 | -37,13 | |||
| 2025-11-14 | 13F | Wolverine Trading, Llc | Put | 127.300 | 7.931 | |||||
| 2026-04-22 | 13F | Janney Montgomery Scott LLC | 8.185 | -11,94 | 0 | |||||
| 2026-03-23 | 13F | J. Derek Lewis & Associates Inc. | 8.800 | 333 | ||||||
| 2026-02-17 | 13F | Nomura Holdings Inc | 34.180 | 193,42 | 1.294 | 74,86 | ||||
| 2026-02-12 | 13F | Federation des caisses Desjardins du Quebec | 4.408 | 4.308,00 | 167 | 2.666,67 | ||||
| 2026-04-24 | 13F | Root Financial Partners, LLC | 10 | 0 | ||||||
| 2026-02-17 | 13F | Advisory Services Network, LLC | 0 | -100,00 | 0 | |||||
| 2026-02-12 | 13F | Voya Investment Management Llc | 79.939 | 258,79 | 3.027 | 113,62 | ||||
| 2026-02-17 | 13F | North Reef Capital Management LP | 81.280 | 1,60 | 3.078 | -39,50 | ||||
| 2026-02-17 | 13F | Davidson Kempner Capital Management Lp | 0 | -100,00 | 0 | -100,00 | ||||
| 2026-02-13 | 13F | Alyeska Investment Group, L.P. | 623.559 | 3,93 | 23.614 | -38,13 | ||||
| 2026-02-17 | 13F | ExodusPoint Capital Management, LP | Put | 0 | -100,00 | 0 | -100,00 | |||
| 2026-02-17 | 13F | Cantor Fitzgerald, L. P. | 15.450 | 585 | ||||||
| 2026-02-17 | 13F | Cetera Investment Advisers | Call | 0 | -100,00 | 0 | ||||
| 2026-02-12 | 13F | Groupe la Francaise | 0 | -100,00 | 0 | |||||
| 2026-02-17 | 13F | Cetera Investment Advisers | 19.941 | 19,19 | 755 | -29,04 | ||||
| 2026-02-09 | 13F | Boundless Plain Holdings Ltd | 134.389 | 5.089 | ||||||
| 2026-02-11 | 13F | CenterBook Partners LP | 0 | -100,00 | 0 | -100,00 | ||||
| 2026-01-22 | 13F | Massachusetts Financial Services Co /ma/ | 1.563.985 | 7,18 | 59.228 | -36,19 | ||||
| 2026-02-13 | 13F | Smartleaf Asset Management LLC | 375 | 0,00 | 15 | -39,13 | ||||
| 2026-02-13 | 13F | Clear Street Group Inc. | 6.140 | 233 | ||||||
| 2026-01-28 | 13F | Hoey Investments, Inc | 400 | -20,00 | 15 | -51,61 | ||||
| 2026-04-24 | 13F | Luminist Capital LLC | 0 | -100,00 | 0 | |||||
| 2026-04-27 | 13F | Tsfg, Llc | 1.700 | 142,86 | 0 | |||||
| 2026-02-13 | 13F | Toroso Investments, LLC | 221.867 | -85,90 | 8.402 | -91,60 | ||||
| 2026-04-15 | 13F | Valley National Advisers Inc | 37 | 0,00 | 0 | |||||
| 2026-04-22 | 13F | Sterling Capital Management LLC | 946 | -44,02 | 34 | -48,44 | ||||
| 2026-02-13 | 13F | Toroso Investments, LLC | Put | 109.800 | -92,99 | 4.158 | -95,82 | |||
| 2026-02-13 | 13F | Toroso Investments, LLC | Call | 105.200 | 3.984 | |||||
| 2026-02-17 | 13F | California State Teachers Retirement System | 2.058 | 78 | ||||||
| 2026-02-05 | 13F | Phoenix Holdings Ltd. | 0 | -100,00 | 0 | |||||
| 2026-02-17 | 13F | North Capital, Inc. | 0 | -100,00 | 0 | |||||
| 2026-03-23 | 13F/A | Galaxy Group Investments LLC | 625.000 | 0,00 | 23.669 | -40,47 | ||||
| 2026-02-13 | 13F | MAI Capital Management | 100 | 0,00 | 4 | -50,00 | ||||
| 2026-02-13 | 13F | Walleye Capital LLC | Put | 1.000 | 38 | |||||
| 2026-02-13 | 13F | Rhumbline Advisers | 22.542 | 854 | ||||||
| 2026-02-09 | 13F | CBIZ Investment Advisory Services, LLC | 5 | 0 | ||||||
| 2026-02-10 | 13F | Norges Bank | 450.000 | 17.042 | ||||||
| 2026-04-16 | 13F | SG Americas Securities, LLC | 3.996 | 0 | ||||||
| 2026-02-12 | 13F | Ankerstar Wealth, LLC | 51 | 2 | ||||||
| 2026-02-17 | 13F | Bank Of America Corp /de/ | 46.335 | -63,32 | 1.755 | -78,17 | ||||
| 2026-02-17 | 13F | Tower Research Capital LLC (TRC) | 4.855 | 29,57 | 184 | -23,11 | ||||
| 2026-02-05 | 13F | Amalgamated Bank | 2.341 | 0 | ||||||
| 2026-04-10 | 13F | Oak Thistle LLC | 35.293 | 1.261 | ||||||
| 2026-02-17 | 13F | Two Sigma Investments, Lp | 18.824 | -96,68 | 713 | -98,03 | ||||
| 2026-04-23 | 13F | SJS Investment Consulting Inc. | 6 | 0 | ||||||
| 2026-02-10 | 13F | Envestnet Asset Management Inc | 17.246 | 9,84 | 653 | -34,57 | ||||
| 2026-02-17 | 13F | T. Rowe Price Investment Management, Inc. | 618.462 | -44,88 | 23 | -67,61 | ||||
| 2026-04-17 | 13F | IFC & Insurance Marketing, Inc. | 0 | -100,00 | 0 | |||||
| 2026-02-14 | 13F | Rockefeller Capital Management L.P. | 16.268 | 79,26 | 616 | 6,76 | ||||
| 2026-02-17 | 13F | Ameriprise Financial Inc | 0 | -100,00 | 0 | |||||
| 2026-02-17 | 13F | Janus Henderson Group Plc | 1.238.313 | 36,10 | 46.895 | -18,98 | ||||
| 2026-04-08 | 13F | Wealth Enhancement Advisory Services, Llc | 11.704 | 426 | ||||||
| 2026-02-05 | 13F | Stephens Investment Management Group LLC | 850.248 | 99,72 | 32.199 | 18,90 | ||||
| 2026-04-06 | 13F | Versant Capital Management, Inc | 21 | 1 | ||||||
| 2026-02-13 | 13F | Charles Schwab Investment Management Inc | 257.464 | 9.750 | ||||||
| 2026-02-17 | 13F | Citadel Advisors Llc | 0 | -100,00 | 0 | -100,00 | ||||
| 2026-02-12 | 13F | Wealthspire Advisors, LLC | 0 | -100,00 | 0 | |||||
| 2026-02-13 | 13F | Treasurer of the State of North Carolina | 13.850 | 1 | ||||||
| 2026-04-27 | 13F | Albion Financial Group /ut | 1.000 | 0,00 | 36 | -5,41 | ||||
| 2026-04-06 | 13F | CX Institutional | 291 | 0 | ||||||
| 2026-02-13 | 13F | 10Elms LLP | 500 | 0,00 | 19 | -41,94 | ||||
| 2026-02-13 | 13F | Walleye Capital LLC | 35.753 | 11,64 | 1.354 | -33,58 | ||||
| 2026-02-13 | 13F | Walleye Capital LLC | Call | 6.400 | 242 | |||||
| 2026-01-30 | 13F | R Squared Ltd | 6.344 | 240 | ||||||
| 2026-02-17 | 13F | Ghisallo Capital Management LLC | 110.000 | 0,00 | 4.166 | -40,47 | ||||
| 2026-02-06 | 13F | Vestmark Advisory Solutions, Inc. | 79.588 | 86,32 | 3.014 | 10,89 | ||||
| 2026-02-13 | 13F | Maltese Capital Management Llc | 0 | -100,00 | 0 | |||||
| 2026-02-12 | 13F | Principal Securities, Inc. | 0 | -100,00 | 0 | |||||
| 2026-02-17 | 13F | Alliancebernstein L.p. | 769.292 | -3,95 | 29.133 | -42,82 | ||||
| 2026-03-03 | 13F/A | Caitong International Asset Management Co., Ltd | 7 | 0 | ||||||
| 2026-02-11 | 13F | ARK Investment Management LLC | 4.821.700 | 87,13 | 182.598 | 11,40 | ||||
| 2026-02-13 | 13F | Wells Fargo & Company/mn | 32.006 | 8,54 | 1.212 | -35,36 | ||||
| 2026-02-12 | 13F | Gardner Lewis Asset Management L P | 11.635 | 441 | ||||||
| 2026-04-08 | 13F | E Fund Management (Hong Kong) Co., Ltd. | 385 | 14 | ||||||
| 2026-02-13 | 13F | Van Eck Associates Corp | 644.218 | -5,74 | 24 | -44,19 | ||||
| 2026-02-19 | 13F | Invesco Ltd. | 2.197.520 | 87,23 | 83.220 | 11,47 | ||||
| 2026-02-03 | 13F | SBI Securities Co., Ltd. | 9.069 | -36,10 | 343 | -61,97 | ||||
| 2026-02-17 | 13F | Fmr Llc | 4.966.689 | 358,54 | 188.089 | 172,99 | ||||
| 2026-02-13 | 13F | Police & Firemen's Retirement System of New Jersey | 13.649 | 517 |