Grundlæggende statistik
| Institutionelle ejere | 123 total, 122 long only, 0 short only, 1 long/short - change of 12,84% MRQ |
| Gennemsnitlig porteføljeallokering | 1.1381 % - change of -6,08% MRQ |
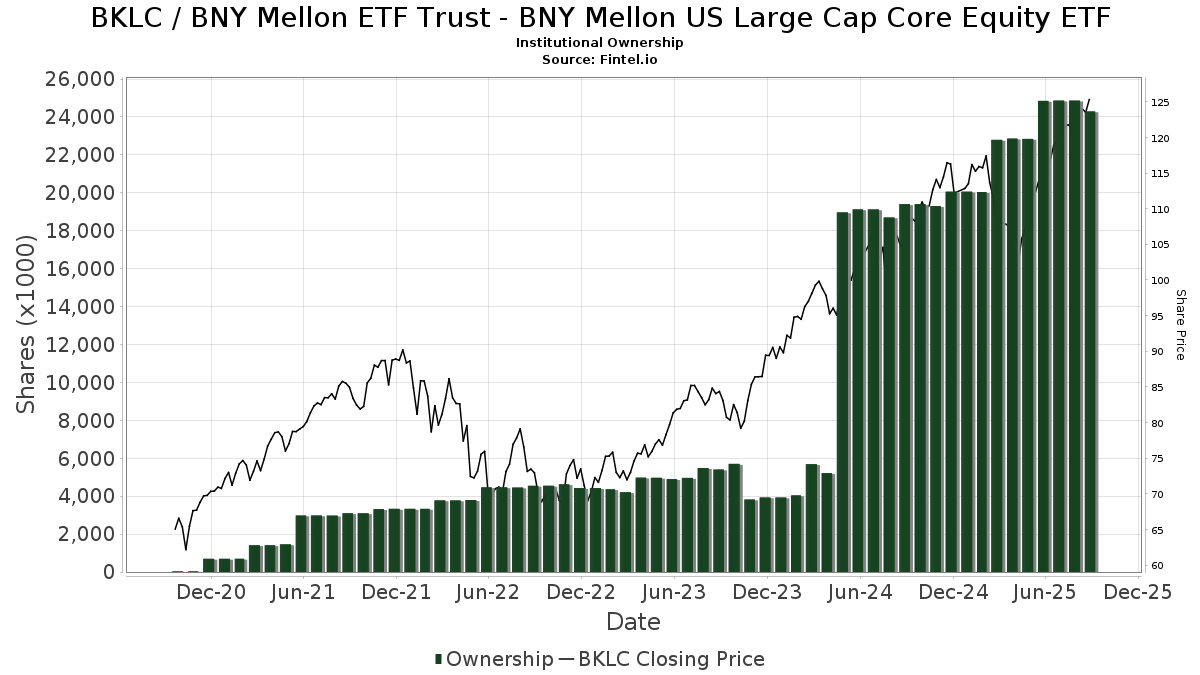
| Institutionelle aktier (lange) | 24.293.265 (ex 13D/G) - change of -0,56MM shares -2,24% MRQ |
| Institutionel værdi (lang) | $ 2.867.222 USD ($1000) |
Institutionelt ejerskab og aktionærer
BNY Mellon ETF Trust - BNY Mellon US Large Cap Core Equity ETF (US:BKLC) har 123 institutionelle ejere og aktionærer, der har indsendt 13D/G- eller 13F-formularer til Securities Exchange Commission (SEC). Disse institutioner har i alt 24,293,265 aktier. Største aktionærer omfatter RPOA Advisors, Inc., Integrated Wealth Concepts LLC, Bank of New York Mellon Corp, Sentinel Pension Advisors Inc, RAA - SMI 3Fourteen Real Asset Allocation ETF SMI 3Fourteen REAL Asset Allocation ETF, Stadion Money Management, LLC, Toroso Investments, LLC, GM Advisory Group, Inc., Ameriprise Financial Inc, and Northwestern Mutual Wealth Management Co .
BNY Mellon ETF Trust - BNY Mellon US Large Cap Core Equity ETF (ARCA:BKLC) institutionel ejerskabsstruktur viser aktuelle positioner i virksomheden efter institutioner og fonde, samt seneste ændringer i positionsstørrelse. Større aktionærer kan omfatte individuelle investorer, investeringsforeninger, hedgefonde eller institutioner. Skema 13D angiver, at investoren besidder (eller besidder) mere end 5 % af virksomheden og har til hensigt (eller har til hensigt at) aktivt at forfølge en ændring i forretningsstrategi. Skema 13G indikerer en passiv investering på over 5%.
The share price as of September 8, 2025 is 124,58 / share. Previously, on September 9, 2024, the share price was 103,86 / share. This represents an increase of 19,95% over that period.
Fondens stemningsscore
Fund Sentiment Score (fka Ownership Accumulation Score) finder de aktier, der bliver mest købt af fonde. Det er resultatet af en sofistikeret, multi-faktor kvantitativ model, der identificerer virksomheder med de højeste niveauer af institutionel akkumulering. Scoringsmodellen bruger en kombination af den samlede stigning i oplyste ejere, ændringerne i porteføljeallokeringer i disse ejere og andre målinger. Tallet går fra 0 til 100, hvor højere tal indikerer et højere niveau af akkumulering for sine jævnaldrende, og 50 er gennemsnittet.
Opdateringsfrekvens: Dagligt
Se Ownership Explorer, som giver en liste over højest rangerende virksomheder.
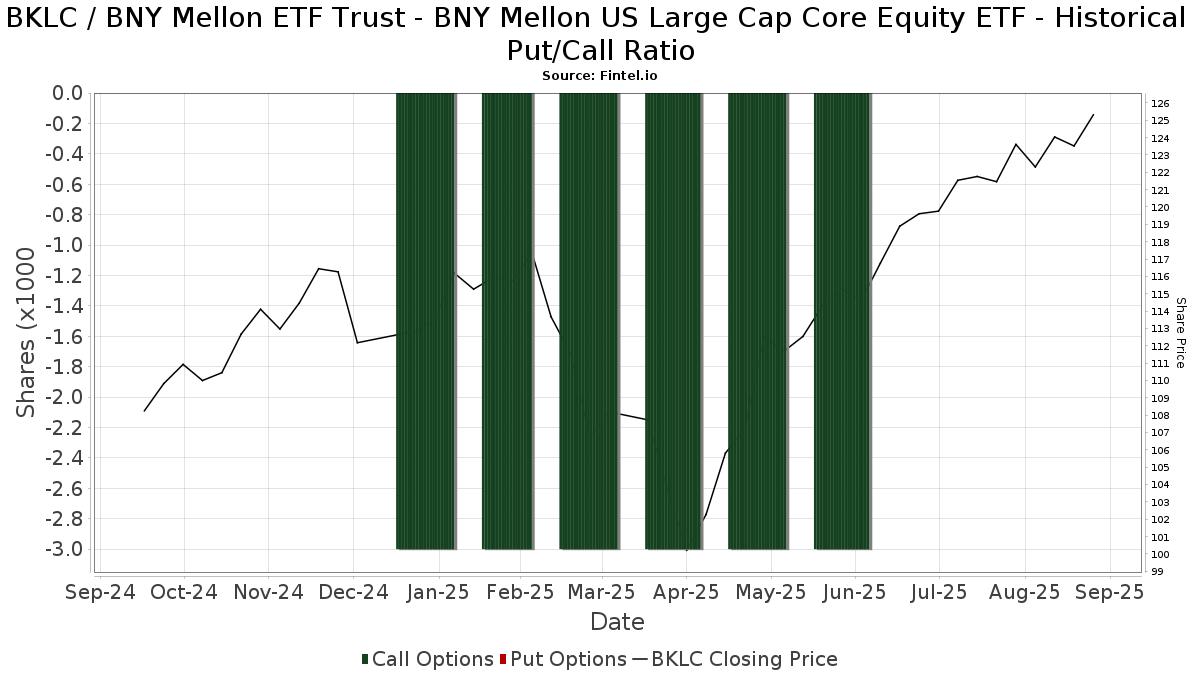
Institutionel Put/Call-forhold
Ud over at indberette standardaktie- og gældsudstedelser skal institutter med mere end 100 mill. aktiver under forvaltning også oplyse deres put- og call-optionsbeholdninger. Da salgsoptioner generelt indikerer negativ stemning, og købsoptioner indikerer positiv stemning, kan vi få en fornemmelse af den overordnede institutionelle stemning ved at plotte forholdet mellem put og kald. Diagrammet til højre viser det historiske put/call-forhold for dette instrument.
Brug af Put/Call Ratio som en indikator for investorernes stemning overvinder en af de vigtigste mangler ved at bruge totalt institutionelt ejerskab, som er, at en betydelig mængde af aktiver under forvaltning investeres passivt for at spore indekser. Passivt forvaltede fonde køber typisk ikke optioner, så indikatoren for put/call-forholdet følger mere nøje følelsen af aktivt forvaltede fonde.
13F og NPORT arkivering
Detaljer om 13F-arkivering er gratis. Detaljer om NP-ansøgninger kræver et premium-medlemskab. Grønne rækker angiver nye positioner. Røde rækker angiver lukkede positioner. Klik på linket ikon for at se den fulde transaktionshistorik.
Opgrader
for at låse premium-data op og eksportere til Excel ![]() .
.
| Fil dato | Kilde | Investor | Type | Gennemsnitlig pris (Øst) |
Aktier | Δ Aktier (%) |
Rapporteret Værdi ($1000) |
Δ Værdi (%) |
Port Alloc (%) |
|
|---|---|---|---|---|---|---|---|---|---|---|
| 2025-08-12 | 13F | Jpmorgan Chase & Co | 112.192 | 539,09 | 13.287 | 612,00 | ||||
| 2025-08-29 | NP | RAA - SMI 3Fourteen Real Asset Allocation ETF SMI 3Fourteen REAL Asset Allocation ETF | 808.422 | 8,01 | 95.741 | 20,32 | ||||
| 2025-07-09 | 13F | WealthCare Investment Partners, LLC | 2.848 | 0,00 | 342 | 22,22 | ||||
| 2025-08-12 | 13F | Quadcap Wealth Management, LLC | 5.604 | 0,11 | 664 | 11,43 | ||||
| 2025-07-25 | 13F | Concord Wealth Partners | 0 | -100,00 | 0 | |||||
| 2025-08-11 | 13F | Aptus Capital Advisors, LLC | 179.103 | 335,02 | 21.211 | 384,60 | ||||
| 2025-05-05 | 13F | Transce3nd, LLC | 0 | -100,00 | 0 | |||||
| 2025-08-14 | 13F | Mariner, LLC | 2.645 | -45,69 | 313 | -39,46 | ||||
| 2025-07-08 | 13F | Parallel Advisors, LLC | 50 | 0,00 | 6 | 0,00 | ||||
| 2025-08-04 | 13F | Assetmark, Inc | 0 | -100,00 | 0 | |||||
| 2025-08-11 | 13F | CFS Investment Advisory Services, LLC | 0 | -100,00 | 0 | |||||
| 2025-08-13 | 13F | Northwestern Mutual Wealth Management Co | 307.822 | 12,69 | 36.455 | 25,53 | ||||
| 2025-08-14 | 13F | Jane Street Group, Llc | 21.406 | 106,03 | 2.535 | 129,62 | ||||
| 2025-08-18 | 13F | Geneos Wealth Management Inc. | 1.857 | 44,51 | 220 | 61,03 | ||||
| 2025-08-08 | 13F | Cetera Investment Advisers | 56.685 | 4,20 | 6.713 | 16,08 | ||||
| 2025-08-13 | 13F | Capital Analysts, Inc. | 375 | 13,64 | 0 | |||||
| 2025-08-15 | 13F | CI Private Wealth, LLC | 2.482 | -17,46 | 294 | -8,15 | ||||
| 2025-08-05 | 13F | Bank of New York Mellon Corp | 1.798.063 | -40,91 | 212.945 | -34,18 | ||||
| 2025-08-05 | 13F | Bank Of Montreal /can/ | 5.270 | 0,00 | 624 | 11,43 | ||||
| 2025-08-12 | 13F | DiMeo Schneider & Associates, L.L.C. | 2.495 | 0,00 | 295 | 11,32 | ||||
| 2025-08-06 | 13F | Commonwealth Equity Services, Llc | 8.139 | 45,08 | 1 | |||||
| 2025-08-14 | 13F | Susquehanna International Group, Llp | 34.196 | -7,28 | 4.050 | 3,26 | ||||
| 2025-07-29 | 13F | Pinnacle Wealth Management, LLC | 4.983 | -4,65 | 590 | 6,31 | ||||
| 2025-07-16 | 13F | Wealth Group Ltd | 13.534 | 1.603 | ||||||
| 2025-07-23 | 13F | REAP Financial Group, LLC | 760 | 0,00 | 90 | 12,50 | ||||
| 2025-07-10 | 13F | Kmg Fiduciary Partners, Llc | 67.389 | 4,40 | 7.981 | 16,28 | ||||
| 2025-07-24 | 13F | Stiles Financial Services Inc | 27.469 | -22,64 | 3.254 | -13,85 | ||||
| 2025-07-29 | 13F | Crux Wealth Advisors | 60.473 | 113,31 | 7.162 | 137,59 | ||||
| 2025-07-15 | 13F | Define Financial, Llc | 1.703 | 202 | ||||||
| 2025-08-14 | 13F | Goldman Sachs Group Inc | 1.814 | 215 | ||||||
| 2025-08-01 | NP | Advisors Preferred Trust - Dynamic Alpha Macro Fund Institutional Class Shares | 89.643 | 0,00 | 10.616 | 11,40 | ||||
| 2025-08-13 | 13F | Northern Trust Corp | 1.905 | 0,00 | 226 | 11,39 | ||||
| 2025-08-11 | 13F | Goodman Financial Corp | 0 | -100,00 | 0 | |||||
| 2025-08-08 | 13F | Empower Advisory Group, LLC | 2.310 | 274 | ||||||
| 2025-08-15 | 13F | Equitable Holdings, Inc. | 56.607 | 70,43 | 6.704 | 89,83 | ||||
| 2025-08-01 | 13F | Zhang Financial LLC | 305.121 | 8,15 | 36.136 | 20,47 | ||||
| 2025-08-08 | 13F | Compass Wealth Management LLC | 0 | -100,00 | 0 | |||||
| 2025-08-14 | 13F | Raymond James Financial Inc | 4.105 | 3,45 | 486 | 15,44 | ||||
| 2025-07-10 | 13F | Wealth Enhancement Advisory Services, Llc | 2.377 | -96,94 | 285 | -96,55 | ||||
| 2025-05-13 | 13F | Neuberger Berman Group LLC | 0 | -100,00 | 0 | |||||
| 2025-07-21 | 13F | Single Point Partners, LLC | 9.037 | 1 | ||||||
| 2025-08-05 | 13F | Simplex Trading, Llc | 41 | 0 | ||||||
| 2025-07-29 | 13F | BKD Wealth Advisors, LLC | 2.079 | 246 | ||||||
| 2025-07-29 | 13F | Woodard & Co Asset Management Group Inc /adv | 230.107 | 2.868,74 | 27.252 | 3.207,16 | ||||
| 2025-08-11 | 13F | Wealthspire Advisors, LLC | 7.874 | 932 | ||||||
| 2025-04-10 | 13F | Retireful, LLC | 0 | -100,00 | 0 | |||||
| 2025-08-15 | 13F | Lantern Wealth Advisors, LLC | 5.822 | 89,52 | 690 | 100,29 | ||||
| 2025-05-15 | 13F | GWM Advisors LLC | 0 | -100,00 | 0 | |||||
| 2025-08-01 | 13F | Envestnet Asset Management Inc | 74.631 | 62,25 | 8.839 | 80,74 | ||||
| 2025-08-14 | 13F | Integrated Wealth Concepts LLC | 2.427.445 | 11,76 | 287.482 | 24,48 | ||||
| 2025-07-25 | 13F | We Are One Seven, LLC | 132.111 | -10,04 | 15.646 | 0,20 | ||||
| 2025-08-14 | 13F | Ameriprise Financial Inc | 364.511 | 5,38 | 43.169 | 17,38 | ||||
| 2025-08-12 | 13F | Proequities, Inc. | 0 | 0 | ||||||
| 2025-08-14 | 13F | CoreCap Advisors, LLC | 9 | 1 | ||||||
| 2025-04-23 | 13F | Win Advisors, Inc | 0 | -100,00 | 0 | |||||
| 2025-07-25 | 13F | Atria Wealth Solutions, Inc. | 11.060 | -16,11 | 1.327 | -5,35 | ||||
| 2025-08-12 | 13F | LPL Financial LLC | 181.577 | -45,71 | 21.504 | -39,53 | ||||
| 2025-08-14 | 13F | UBS Group AG | 78.070 | 6,25 | 9.246 | 18,36 | ||||
| 2025-08-15 | 13F | Kestra Advisory Services, LLC | 97.978 | -2,46 | 11.604 | 8,65 | ||||
| 2025-08-04 | 13F | Spire Wealth Management | 16 | 0,00 | 2 | 0,00 | ||||
| 2025-08-11 | 13F | FSA Wealth Management LLC | 316 | 37 | ||||||
| 2025-08-14 | 13F | Fort Point Capital Partners LLC | 11.735 | 0,70 | 1.390 | 12,20 | ||||
| 2025-08-13 | 13F | Flow Traders U.s. Llc | 24.868 | 58,26 | 3 | 100,00 | ||||
| 2025-07-14 | 13F | Sowell Financial Services LLC | 2.330 | 0,00 | 276 | 11,34 | ||||
| 2025-08-08 | 13F | Capital Investment Advisory Services, LLC | 3.603 | 34,79 | 427 | 50,00 | ||||
| 2025-07-03 | 13F | Collective Family Office Llc | 11.657 | 8,05 | 1.381 | 20,31 | ||||
| 2025-08-06 | 13F | First Horizon Advisors, Inc. | 364 | -11,86 | 43 | 0,00 | ||||
| 2025-08-13 | 13F | Cerity Partners LLC | 2.443 | -31,01 | 289 | -23,14 | ||||
| 2025-08-13 | 13F | First Trust Advisors Lp | 1.968 | -61,05 | 233 | -56,61 | ||||
| 2025-05-15 | 13F | DZ BANK AG Deutsche Zentral Genossenschafts Bank, Frankfurt am Main | 0 | -100,00 | 0 | |||||
| 2025-06-27 | NP | DUBS - Aptus Large Cap Enhanced Yield ETF | 57.414 | 8,79 | 6.074 | -0,30 | ||||
| 2025-09-04 | 13F/A | Advisor Group Holdings, Inc. | 163.741 | 3,74 | 19.393 | 15,55 | ||||
| 2025-07-29 | NP | EBI - Longview Advantage ETF | 0 | -100,00 | 0 | -100,00 | ||||
| 2025-08-12 | 13F | CIBC Private Wealth Group, LLC | 150 | 0,00 | 18 | 21,43 | ||||
| 2025-08-14 | 13F | Fmr Llc | 14.719 | 250,20 | 1.743 | 290,81 | ||||
| 2025-07-17 | 13F | David Kennon Inc | 18.779 | 2,96 | 2.224 | 14,65 | ||||
| 2025-07-25 | 13F | Sequoia Financial Advisors, LLC | 1.840 | 218 | ||||||
| 2025-07-15 | 13F | Retirement Income Solutions, Inc | 7.460 | 0,00 | 883 | 11,35 | ||||
| 2025-08-12 | 13F | Wealthbridge Capital Management, Llc | 140.671 | 6,33 | 16.660 | 18,43 | ||||
| 2025-05-13 | 13F | Watchman Group, Inc. | 0 | -100,00 | 0 | |||||
| 2025-08-08 | 13F | Pnc Financial Services Group, Inc. | 350 | 0,00 | 41 | 10,81 | ||||
| 2025-08-11 | 13F | Principal Securities, Inc. | 4.229 | -0,94 | 501 | 4,60 | ||||
| 2025-07-14 | 13F | Sentinel Pension Advisors Inc | 852.649 | 2,00 | 100.979 | 13,62 | ||||
| 2025-08-15 | 13F/A | Symphony Financial, Ltd. Co. | 22.164 | 2.635 | ||||||
| 2025-08-14 | 13F | Principia Wealth Advisory, LLC | 13.521 | 1.601 | ||||||
| 2025-08-27 | 13F/A | Brinker Capital Investments, LLC | 9.230 | 1.093 | ||||||
| 2025-08-14 | 13F | Toroso Investments, LLC | 553.746 | -12,73 | 65.395 | -3,06 | ||||
| 2025-08-14 | 13F | Herold Advisors, Inc. | 14.526 | -17,23 | 1.720 | -7,77 | ||||
| 2025-07-31 | 13F | Cambridge Investment Research Advisors, Inc. | 2.337 | 16,04 | 0 | |||||
| 2025-08-08 | 13F | Cornerstone Advisors Asset Management, Inc | 14.300 | 0,00 | 1.694 | 11,38 | ||||
| 2025-08-14 | 13F | Bank Of America Corp /de/ | 6.592 | -1,36 | 781 | 9,86 | ||||
| 2025-07-29 | 13F | RPOA Advisors, Inc. | 12.726.372 | -2,40 | 1.507.184 | 8,72 | ||||
| 2025-08-04 | 13F | JDM Financial Group LLC | 235.158 | 10,22 | 27.850 | 22,78 | ||||
| 2025-08-14 | 13F | Old Mission Capital Llc | 3.009 | 356 | ||||||
| 2025-06-30 | NP | SMIDX - SMI Dynamic Allocation Fund | 8.460 | 895 | ||||||
| 2025-08-15 | 13F | Morgan Stanley | 110.223 | 275,36 | 13.054 | 318,10 | ||||
| 2025-08-13 | 13F | EverSource Wealth Advisors, LLC | 195 | 0,00 | 23 | 15,00 | ||||
| 2025-08-13 | 13F | Wills Financial Group LLC | 1.700 | -15,30 | 201 | -5,63 | ||||
| 2025-08-08 | 13F | Accredited Investors Inc. | 1.946 | 230 | ||||||
| 2025-08-14 | 13F | Royal Bank Of Canada | 5.040 | 26,16 | 597 | 40,47 | ||||
| 2025-08-14 | 13F | Hrt Financial Lp | 0 | -100,00 | 0 | |||||
| 2025-08-14 | 13F | McIlrath & Eck, LLC | 8 | 0,00 | 1 | |||||
| 2025-07-29 | 13F | ShoreHaven Wealth Partners, LLC | 4.020 | -3,55 | 476 | 7,45 | ||||
| 2025-08-07 | 13F | Wealth Forward, LLC | 20.232 | -0,08 | 2.396 | 11,34 | ||||
| 2025-07-28 | 13F | Harbour Investments, Inc. | 166 | 0,00 | 20 | 11,76 | ||||
| 2025-07-25 | 13F | Envestnet Portfolio Solutions, Inc. | 0 | -100,00 | 0 | |||||
| 2025-05-13 | 13F | Prime Capital Investment Advisors, LLC | 0 | -100,00 | 0 | |||||
| 2025-07-22 | 13F | Carolina Wealth Advisors, LLC | 894 | 106 | ||||||
| 2025-08-05 | 13F | Advisors Preferred, LLC | 89.643 | 0,00 | 10.607 | 10,57 | ||||
| 2025-07-22 | 13F | Duncan Williams Asset Management, LLC | 3.152 | 373 | ||||||
| 2025-07-25 | 13F | Concurrent Investment Advisors, LLC | 16.918 | 7,36 | 2.004 | 19,58 | ||||
| 2025-08-01 | 13F | Transcend Wealth Collective, Llc | 2.010 | 0,00 | 238 | 11,74 | ||||
| 2025-05-14 | 13F | Hill Investment Group Partners, LLC | 0 | -100,00 | 0 | |||||
| 2025-08-05 | 13F | Key FInancial Inc | 139 | 0,00 | 16 | 14,29 | ||||
| 2025-08-14 | 13F | Mercer Global Advisors Inc /adv | 6.421 | 0,34 | 760 | 11,76 | ||||
| 2025-08-14 | 13F | Mml Investors Services, Llc | 12.712 | 81,70 | 2 | |||||
| 2025-08-04 | 13F | Creekmur Asset Management LLC | 276 | 33 | ||||||
| 2025-07-24 | 13F | IFP Advisors, Inc | 63.259 | 139,90 | 7.492 | 167,25 | ||||
| 2025-07-22 | 13F | Kickstand Ventures, Llc. | 3.152 | -5,15 | 373 | 5,67 | ||||
| 2025-08-11 | 13F | HighTower Advisors, LLC | 3.556 | 0,28 | 421 | 11,67 | ||||
| 2025-08-12 | 13F | Insigneo Advisory Services, Llc | 7.869 | -0,54 | 932 | 10,70 | ||||
| 2025-07-17 | 13F | One Wealth Advisors, LLC | 3.347 | 19,62 | 396 | 33,33 | ||||
| 2025-08-14 | 13F | Betterment LLC | 4.120 | -30,63 | 0 | |||||
| 2025-08-14 | 13F | Stadion Money Management, LLC | 728.410 | -6,40 | 86.027 | 3,97 | ||||
| 2025-07-29 | 13F | Stratos Wealth Partners, LTD. | 14.746 | -46,78 | 1.746 | -40,73 | ||||
| 2025-08-12 | 13F | Global Retirement Partners, LLC | 617 | 26,43 | 73 | 35,19 | ||||
| 2025-08-04 | 13F | Mayflower Financial Advisors, LLC | 4.248 | 5,78 | 503 | 18,08 | ||||
| 2025-08-07 | 13F | BOK Financial Private Wealth, Inc. | 1.905 | 0,00 | 226 | 11,39 | ||||
| 2025-06-30 | NP | SMILX - SMI 50/40/10 Fund | 2.470 | 261 | ||||||
| 2025-08-01 | 13F | Belvedere Trading LLC | Call | 3.600 | 9,09 | 426 | 21,71 | |||
| 2025-07-17 | 13F | Clear Point Advisors Inc. | 3.058 | 12,55 | 362 | 25,69 | ||||
| 2025-08-01 | 13F | Belvedere Trading LLC | Put | 100 | 12 | |||||
| 2025-04-29 | 13F | Resources Investment Advisors, LLC. | 0 | -100,00 | 0 | |||||
| 2025-08-05 | 13F | Sigma Planning Corp | 14.876 | 1.762 | ||||||
| 2025-08-13 | 13F | GM Advisory Group, Inc. | 452.842 | 8,46 | 53.630 | 20,81 | ||||
| 2025-08-14 | 13F | Dean, Jacobson Financial Services, LLC | 3.646 | 432 | ||||||
| 2025-08-12 | 13F | Steward Partners Investment Advisory, Llc | 5.323 | 4,03 | 630 | 15,81 | ||||
| 2025-08-13 | 13F | M&t Bank Corp | 2.492 | -68,12 | 295 | -64,50 | ||||
| 2025-08-14 | 13F | Wells Fargo & Company/mn | 1.958 | -53,15 | 232 | -47,97 | ||||
| 2025-08-11 | 13F | Trajan Wealth LLC | 0 | -100,00 | 0 | |||||
| 2025-05-09 | 13F | Belvedere Trading LLC | 0 | -100,00 | 0 | -100,00 | ||||
| 2025-07-31 | 13F | GenTrust, LLC | 35.370 | 842,95 | 4.189 | 952,26 | ||||
| 2025-08-19 | 13F | Advisory Services Network, LLC | 16.022 | 1.951 | ||||||
| 2025-07-14 | 13F | Park Avenue Securities Llc | 10.768 | 1 | ||||||
| 2025-08-14 | 13F | Two Sigma Investments, Lp | 90.600 | 10.730 | ||||||
| 2025-05-02 | 13F | Wealthfront Advisers Llc | 0 | -100,00 | 0 | -100,00 |