Grundlæggende statistik
| Institutionelle ejere | 255 total, 250 long only, 2 short only, 3 long/short - change of 5,81% MRQ |
| Gennemsnitlig porteføljeallokering | 0.1582 % - change of -21,17% MRQ |
| Institutionelle aktier (lange) | 50.685.873 (ex 13D/G) - change of 6,92MM shares 15,81% MRQ |
| Institutionel værdi (lang) | $ 695.482 USD ($1000) |
Institutionelt ejerskab og aktionærer
VanEck ETF Trust - VanEck BDC Income ETF (US:BIZD) har 255 institutionelle ejere og aktionærer, der har indsendt 13D/G- eller 13F-formularer til Securities Exchange Commission (SEC). Disse institutioner har i alt 50,685,873 aktier. Største aktionærer omfatter Morgan Stanley, Bank Of America Corp /de/, Wells Fargo & Company/mn, LPL Financial LLC, Two Sigma Investments, Lp, Generali Asset Management SPA SGR, Cambridge Associates Llc /ma/ /adv, Bank Julius Baer & Co. Ltd, Zurich, Raymond James Financial Inc, and Mission Hills Financial Advisory, LLC .
VanEck ETF Trust - VanEck BDC Income ETF (ARCA:BIZD) institutionel ejerskabsstruktur viser aktuelle positioner i virksomheden efter institutioner og fonde, samt seneste ændringer i positionsstørrelse. Større aktionærer kan omfatte individuelle investorer, investeringsforeninger, hedgefonde eller institutioner. Skema 13D angiver, at investoren besidder (eller besidder) mere end 5 % af virksomheden og har til hensigt (eller har til hensigt at) aktivt at forfølge en ændring i forretningsstrategi. Skema 13G indikerer en passiv investering på over 5%.
The share price as of March 20, 2026 is 12,70 / share. Previously, on March 24, 2025, the share price was 16,96 / share. This represents a decline of 25,12% over that period.

Fondens stemningsscore
Fund Sentiment Score (fka Ownership Accumulation Score) finder de aktier, der bliver mest købt af fonde. Det er resultatet af en sofistikeret, multi-faktor kvantitativ model, der identificerer virksomheder med de højeste niveauer af institutionel akkumulering. Scoringsmodellen bruger en kombination af den samlede stigning i oplyste ejere, ændringerne i porteføljeallokeringer i disse ejere og andre målinger. Tallet går fra 0 til 100, hvor højere tal indikerer et højere niveau af akkumulering for sine jævnaldrende, og 50 er gennemsnittet.
Opdateringsfrekvens: Dagligt
Se Ownership Explorer, som giver en liste over højest rangerende virksomheder.
AI+ Ask Fintel’s AI assistant about VanEck ETF Trust - VanEck BDC Income ETF.
Select a question to share a public post with an AI-crafted answer.
Thinking of good questions…
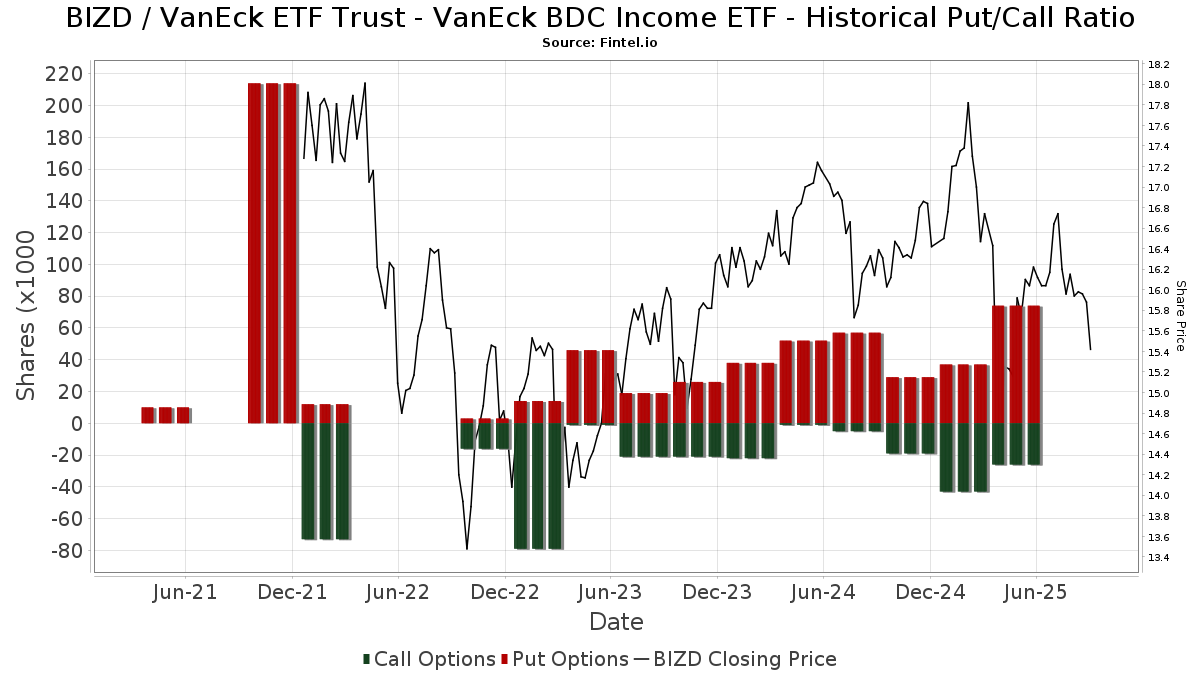
Institutionel Put/Call-forhold
Ud over at indberette standardaktie- og gældsudstedelser skal institutter med mere end 100 mill. aktiver under forvaltning også oplyse deres put- og call-optionsbeholdninger. Da salgsoptioner generelt indikerer negativ stemning, og købsoptioner indikerer positiv stemning, kan vi få en fornemmelse af den overordnede institutionelle stemning ved at plotte forholdet mellem put og kald. Diagrammet til højre viser det historiske put/call-forhold for dette instrument.
Brug af Put/Call Ratio som en indikator for investorernes stemning overvinder en af de vigtigste mangler ved at bruge totalt institutionelt ejerskab, som er, at en betydelig mængde af aktiver under forvaltning investeres passivt for at spore indekser. Passivt forvaltede fonde køber typisk ikke optioner, så indikatoren for put/call-forholdet følger mere nøje følelsen af aktivt forvaltede fonde.
13F og NPORT arkivering
Detaljer om 13F-arkivering er gratis. Detaljer om NP-ansøgninger kræver et premium-medlemskab. Grønne rækker angiver nye positioner. Røde rækker angiver lukkede positioner. Klik på linket ikon for at se den fulde transaktionshistorik.
Opgrader
for at låse premium-data op og eksportere til Excel ![]() .
.
| Fil dato | Kilde | Investor | Type | Gennemsnitlig pris (Øst) |
Aktier | Δ Aktier (%) |
Rapporteret Værdi ($1000) |
Δ Værdi (%) |
Port Alloc (%) |
|
|---|---|---|---|---|---|---|---|---|---|---|
| 2026-02-05 | 13F | Park Square Financial Group, LLC | 35 | 34,62 | 1 | |||||
| 2026-02-13 | 13F | Arkadios Wealth Advisors | 239.947 | 5,34 | 3.402 | -0,03 | ||||
| 2026-02-17 | 13F | Private Advisor Group, LLC | 117.228 | 19,95 | 1.662 | 13,84 | ||||
| 2026-01-26 | 13F | AE Wealth Management LLC | 4.509 | -13,88 | 64 | -19,23 | ||||
| 2026-02-02 | 13F | Oppenheimer & Co Inc | 242.440 | 1.589,83 | 3.438 | 1.506,07 | ||||
| 2026-01-21 | 13F | Albion Financial Group /ut | 62.289 | 32,84 | 883 | 26,14 | ||||
| 2026-02-02 | 13F | Miracle Mile Advisors, LLC | 23.630 | 335 | ||||||
| 2026-02-09 | 13F | Keating Financial Advisory Services, Inc. | 11.230 | 159 | ||||||
| 2026-02-17 | 13F | Tower Research Capital LLC (TRC) | 1.710 | 24 | ||||||
| 2026-02-13 | 13F | Wells Fargo & Company/mn | 4.413.105 | 126,07 | 62.578 | 114,57 | ||||
| 2026-02-09 | 13F | Beck Bode, LLC | 10.028 | 142 | ||||||
| 2026-02-12 | 13F | Johnson Financial Group, Inc. | 42.500 | 0,00 | 603 | -5,05 | ||||
| 2026-02-23 | 13F | Beaird Harris Wealth Management, LLC | 1.479 | -28,20 | 21 | -33,33 | ||||
| 2025-11-13 | 13F | GeoWealth Management, LLC | 0 | -100,00 | 0 | |||||
| 2026-02-03 | 13F | Denali Advisors Llc | 28.158 | 399 | ||||||
| 2025-11-06 | 13F | Ameritas Advisory Services, LLC | 0 | -100,00 | 0 | -100,00 | ||||
| 2026-01-23 | 13F | Transcend Wealth Collective, Llc | 1.088.009 | 15.428 | ||||||
| 2026-02-17 | 13F | Aqr Capital Management Llc | 0 | -100,00 | 0 | |||||
| 2025-11-13 | 13F | Bnp Paribas Arbitrage, Sa | 0 | -100,00 | 0 | |||||
| 2026-02-17 | 13F | Cambridge Associates Llc /ma/ /adv | 1.747.956 | 279,02 | 24.786 | 259,74 | ||||
| 2026-01-29 | 13F | James Investment Research Inc | 0 | -100,00 | 0 | |||||
| 2026-02-13 | 13F | MAI Capital Management | 384 | 5,79 | 5 | 0,00 | ||||
| 2026-01-26 | 13F | Cwm, Llc | 367.950 | 1.242,69 | 5 | |||||
| 2026-02-17 | 13F | Signature Equity Partners, LLC | 173 | 2 | ||||||
| 2026-02-12 | 13F | Triumph Capital Management | 14.395 | -54,28 | 204 | -56,60 | ||||
| 2026-02-13 | 13F | Kestra Advisory Services, LLC | 0 | -100,00 | 0 | |||||
| 2026-02-13 | 13F | Motiv8 Investments LLC | 1.750 | 0 | ||||||
| 2026-02-17 | 13F | D. E. Shaw & Co., Inc. | 0 | -100,00 | 0 | |||||
| 2025-11-04 | 13F | L.m. Kohn & Company | 13.384 | 0,49 | 200 | -7,87 | ||||
| 2026-02-13 | 13F | Magnolia Capital Advisors Llc | 144.911 | 14,82 | 2.055 | 8,97 | ||||
| 2026-02-17 | 13F | Quadrature Capital Ltd | 391.097 | -63,15 | 5.546 | -65,00 | ||||
| 2025-11-12 | 13F | Napa Wealth Management | 42.313 | -0,76 | 632 | -8,93 | ||||
| 2026-02-06 | 13F | Condor Capital Management | 812.485 | -4,64 | 11.521 | -9,48 | ||||
| 2026-02-13 | 13F | Van Eck Associates Corp | 356.061 | -0,30 | 5 | 0,00 | ||||
| 2026-02-09 | 13F | Harbour Investments, Inc. | 51.350 | 11,69 | 728 | 6,12 | ||||
| 2026-02-17 | 13F | FIL Ltd | 357.732 | 253,02 | 5.073 | 235,23 | ||||
| 2026-02-17 | 13F | Trexquant Investment LP | 16.536 | 20,27 | 234 | 14,15 | ||||
| 2025-10-03 | 13F | West Oak Capital, LLC | 0 | -100,00 | 0 | |||||
| 2026-02-12 | 13F | Colonial Trust Advisors | 475 | 0,00 | 7 | -14,29 | ||||
| 2026-02-12 | 13F | Tocqueville Asset Management L.p. | 125.698 | -35,23 | 1.782 | -38,53 | ||||
| 2026-02-12 | 13F | CIBC Private Wealth Group, LLC | 20.823 | -60,37 | 295 | -62,37 | ||||
| 2026-02-17 | 13F | Russell Investments Group, Ltd. | 0 | -100,00 | 0 | |||||
| 2026-02-03 | 13F | Bokf, Na | 3.200 | 0,00 | 45 | -4,26 | ||||
| 2026-02-11 | 13F | SlateStone Wealth, LLC | 32.800 | -8,89 | 0 | |||||
| 2026-02-12 | 13F | Bank Of Montreal /can/ | 6.502 | 2.410,42 | 92 | 2.966,67 | ||||
| 2026-01-30 | 13F | Delta Investment Management, LLC | 0 | -100,00 | 0 | |||||
| 2026-02-13 | 13F | Morgan Stanley | 6.353.665 | 7,55 | 90.095 | 2,08 | ||||
| 2026-02-11 | 13F | LPL Financial LLC | 2.563.691 | -6,92 | 36.353 | -11,65 | ||||
| 2026-02-17 | 13F | Captrust Financial Advisors | 91.907 | 1.303 | ||||||
| 2026-02-17 | 13F | Fountainhead AM, LLC | 6.969 | 99 | ||||||
| 2026-02-17 | 13F | Warren Averett Asset Management, LLC | 99.406 | -10,73 | 1.410 | -15,27 | ||||
| 2026-02-12 | 13F | Federation des caisses Desjardins du Quebec | 3.500 | 0,00 | 49 | -4,00 | ||||
| 2025-10-09 | 13F | Astoria Portfolio Advisors LLC. | 0 | -100,00 | 0 | -100,00 | ||||
| 2026-02-10 | 13F | Clear Harbor Asset Management, LLC | 0 | -100,00 | 0 | |||||
| 2026-01-21 | 13F | Cidel Asset Management Inc | 24.400 | 346 | ||||||
| 2026-02-03 | 13F | Anfield Capital Management, LLC | 0 | -100,00 | 0 | |||||
| 2025-10-27 | 13F | Belvedere Trading LLC | Put | 0 | -100,00 | 0 | ||||
| 2026-02-11 | 13F | Cerity Partners LLC | 268.216 | 1.300,68 | 3.803 | 1.229,72 | ||||
| 2026-02-05 | 13F | AlphaCore Capital LLC | 1.750 | 29,63 | 25 | 20,00 | ||||
| 2026-02-09 | 13F | Bleakley Financial Group, LLC | 22.008 | -7,91 | 312 | -12,61 | ||||
| 2026-01-13 | 13F | Norden Group Llc | 10.029 | 142 | ||||||
| 2026-01-29 | 13F | Kestra Private Wealth Services, Llc | 106.344 | 25,01 | 1.508 | 18,66 | ||||
| 2026-01-29 | 13F | UBS Group AG | 699.060 | -36,57 | 9.913 | -39,80 | ||||
| 2026-02-13 | 13F | Integrated Wealth Concepts LLC | 38.937 | 66,98 | 552 | 58,62 | ||||
| 2026-02-17 | 13F | Silvercrest Asset Management Group Llc | 11.976 | -7,69 | 170 | -12,44 | ||||
| 2026-02-10 | 13F | Texas Yale Capital Corp. | 26.160 | -3,68 | 371 | -8,64 | ||||
| 2026-02-03 | 13F | Emerald Investment Partners, Llc | 134 | 5,51 | 2 | 0,00 | ||||
| 2026-02-11 | 13F | Insight Advisors, LLC/ PA | 0 | -100,00 | 0 | |||||
| 2026-01-30 | 13F | Citizens National Bank Trust Department | 50 | 0,00 | 1 | |||||
| 2026-02-06 | 13F | Global Retirement Partners, LLC | 69.506 | -5,08 | 986 | -9,96 | ||||
| 2026-01-21 | 13F | Future Financial Wealth Managment LLC | 110.274 | 6,68 | 1.580 | 2,33 | ||||
| 2026-02-18 | 13F | GWM Advisors LLC | 157.894 | -55,30 | 2.239 | -57,58 | ||||
| 2025-11-13 | 13F | Parallel Advisors, LLC | 0 | -100,00 | 0 | |||||
| 2026-01-20 | 13F | AdvisorNet Financial, Inc | 8.136 | -28,42 | 115 | -31,95 | ||||
| 2026-02-17 | 13F | Ameriflex Group, Inc. | 1.075 | -50,00 | 15 | -53,12 | ||||
| 2026-02-13 | 13F | Citigroup Inc | 0 | -100,00 | 0 | |||||
| 2026-02-17 | 13F | Perennial Investment Advisors, LLC | 82.665 | -11,17 | 1.172 | -15,68 | ||||
| 2026-01-05 | 13F | GK Wealth Management LLC | 13.135 | 186 | ||||||
| 2026-01-16 | 13F | Genesis Financial Group, LLC | 29.274 | 415 | ||||||
| 2026-01-29 | 13F | Comerica Bank | 52.161 | -12,58 | 740 | -17,06 | ||||
| 2026-01-29 | 13F | Howard Wealth Management, Llc | 112.031 | -2,06 | 1.589 | -7,03 | ||||
| 2026-02-17 | 13F | Citadel Advisors Llc | Call | 219.200 | 1.667,74 | 3.108 | 1.580,00 | |||
| 2026-01-23 | 13F | Guidance Capital, Inc | 92.810 | 1,26 | 1.346 | 2,44 | ||||
| 2026-02-17 | 13F | Citadel Advisors Llc | Put | 94.800 | 10,23 | 1.344 | 4,67 | |||
| 2026-02-10 | 13F/A | Northwestern Mutual Wealth Management Co | 31.223 | -25,07 | 443 | -28,94 | ||||
| 2026-02-02 | 13F | Truist Financial Corp | 50.867 | 132,96 | 721 | 121,17 | ||||
| 2026-02-17 | 13F | IHT Wealth Management, LLC | 35.560 | 0,00 | 504 | -5,08 | ||||
| 2026-02-14 | 13F | Rockefeller Capital Management L.P. | 56.552 | 64,90 | 802 | 56,45 | ||||
| 2026-02-05 | 13F | Bessemer Group Inc | 230.555 | 0,00 | 3 | 0,00 | ||||
| 2026-01-28 | 13F | Salomon & Ludwin, LLC | 917 | 0,00 | 13 | 0,00 | ||||
| 2026-01-15 | 13F | SILVER OAK SECURITIES, Inc | 18.575 | 4,04 | 263 | -1,13 | ||||
| 2026-01-21 | 13F | Touchstone Capital, Inc. | 0 | -100,00 | 0 | |||||
| 2026-02-17 | 13F | Clark Capital Management Group, Inc. | 427.415 | 93,95 | 6.061 | 84,08 | ||||
| 2026-01-08 | 13F | Wealth Enhancement Advisory Services, Llc | 67.781 | 173,19 | 972 | 176,64 | ||||
| 2026-01-23 | 13F | First PREMIER Bank | 31.828 | -1,75 | 0 | |||||
| 2025-11-13 | 13F | Marshall Wace, Llp | 344.917 | 5.153 | ||||||
| 2026-02-06 | 13F | Cullen/frost Bankers, Inc. | 372 | 5 | ||||||
| 2026-01-16 | 13F | Oregon Pacific Wealth Management, LLC | 18.305 | -4,88 | 260 | -9,76 | ||||
| 2026-01-23 | 13F | Nbt Bank N A /ny | 14 | -6,67 | 1 | |||||
| 2026-02-10 | 13F | Pasadena Private Wealth, LLC | 50.166 | 711 | ||||||
| 2026-02-10 | 13F | Lido Advisors, LLC | 574.703 | 154,61 | 8.317 | 146,65 | ||||
| 2026-02-13 | 13F | Brown Advisory Inc | 16.584 | -46,88 | 235 | -49,57 | ||||
| 2026-01-26 | 13F | Opal Wealth Advisors, LLC | 0 | -100,00 | 0 | |||||
| 2026-01-27 | 13F | Measured Risk Portfolios, Inc. | 157.585 | 10,84 | 2.235 | 5,18 | ||||
| 2026-01-07 | 13F | IAM Advisory, LLC | 18.965 | 4,47 | 269 | -1,11 | ||||
| 2026-01-15 | 13F | Great Waters Wealth Management | 12.186 | 0,00 | 173 | -5,49 | ||||
| 2026-02-10 | 13F | Private Wealth Asset Management, LLC | 525 | 0,00 | 7 | 0,00 | ||||
| 2025-11-10 | 13F | Kovitz Investment Group Partners, LLC | 0 | -100,00 | 0 | |||||
| 2026-01-12 | 13F | DKM Wealth Management, Inc. | 22.400 | 0,00 | 318 | -5,09 | ||||
| 2026-01-29 | 13F | D.a. Davidson & Co. | 24.891 | 3,35 | 353 | -1,95 | ||||
| 2026-02-11 | 13F | Janney Montgomery Scott LLC | 168.152 | 7,27 | 2 | 0,00 | ||||
| 2026-02-14 | 13F | Whipplewood Advisors, LLC | 176 | 23,94 | 2 | 0,00 | ||||
| 2026-02-13 | 13F | Colony Group, LLC | 65.425 | 470,70 | 928 | 442,11 | ||||
| 2026-01-29 | 13F | Advisors Capital Management, LLC | 92.095 | 1.306 | ||||||
| 2025-11-14 | 13F | Van Den Berg Management I, Inc | 0 | -100,00 | 0 | |||||
| 2026-01-28 | 13F | Barrett & Company, Inc. | 2.250 | 0,00 | 32 | -6,06 | ||||
| 2026-02-03 | 13F | Indivisible Partners | 97.694 | 1.385 | ||||||
| 2025-10-27 | 13F | Concurrent Investment Advisors, LLC | 0 | -100,00 | 0 | -100,00 | ||||
| 2025-11-12 | 13F | CIBC Bancorp USA Inc. | 52.541 | 785 | ||||||
| 2025-11-14 | 13F | L2 Asset Management, LLC | 0 | -100,00 | 0 | |||||
| 2026-01-05 | 13F | Noble Wealth Management PBC | 6.250 | 89 | ||||||
| 2026-02-12 | 13F | BRYN MAWR TRUST Co | 0 | -100,00 | 0 | -100,00 | ||||
| 2026-02-02 | 13F | Mission Hills Financial Advisory, LLC | 1.212.252 | 8,03 | 17.190 | 2,53 | ||||
| 2026-01-15 | 13F | Highline Wealth Partners Llc | 300 | 0,00 | 4 | 0,00 | ||||
| 2026-02-06 | 13F | CFO4Life Group, LLC | 32.548 | -21,85 | 462 | -25,88 | ||||
| 2026-02-13 | 13F | Change Path, LLC | 58.427 | -40,29 | 828 | -43,33 | ||||
| 2026-02-17 | 13F | Advisory Services Network, LLC | 12.854 | -1,47 | 182 | -6,19 | ||||
| 2026-01-14 | 13F | Wealthcare Advisory Partners LLC | 59.253 | 13,07 | 840 | 7,42 | ||||
| 2026-01-27 | 13F | Sterling Group Wealth Management, LLC | 26.059 | 5,03 | 370 | -0,27 | ||||
| 2026-02-10 | 13F | Bridges Investment Management Inc | 0 | -100,00 | 0 | |||||
| 2026-02-13 | 13F | Pathstone Holdings, LLC | 17.794 | 252 | ||||||
| 2025-10-29 | 13F | Attessa Capital LLC | 0 | -100,00 | 0 | |||||
| 2026-02-12 | 13F | Andina Capital Management, LLC | 49.943 | 27,04 | 708 | 20,61 | ||||
| 2026-01-21 | 13F | Flagship Harbor Advisors, Llc | 13.454 | -16,60 | 191 | -20,83 | ||||
| 2026-02-13 | 13F | Centiva Capital, LP | Call | 44.500 | 631 | |||||
| 2026-02-17 | 13F | Mercer Global Advisors Inc /adv | 10.432 | 148 | ||||||
| 2026-02-13 | 13F | Mariner, LLC | 309.085 | 1,36 | 4.383 | -3,80 | ||||
| 2026-02-09 | 13F | Sterling Investment Advisors, Ltd. | 337.425 | 4.785 | ||||||
| 2026-02-17 | 13F | Crawford Fund Management, LLC | Put | 11.000 | 156 | |||||
| 2026-02-03 | 13F | Garner Asset Management Corp | 48.500 | 688 | ||||||
| 2026-02-13 | 13F | Ieq Capital, Llc | 0 | -100,00 | 0 | |||||
| 2026-02-05 | 13F | Allworth Financial LP | 13.300 | 0,00 | 189 | -5,05 | ||||
| 2026-02-11 | 13F | Simplex Trading, Llc | 36.768 | 521 | ||||||
| 2026-02-11 | 13F | J.Safra Asset Management Corp | 216.113 | 17,54 | 3.064 | 11,58 | ||||
| 2026-02-10 | 13F | Black Swift Group, LLC | 170.507 | 2.418 | ||||||
| 2025-11-12 | 13F | Group One Trading, L.p. | 0 | -100,00 | 0 | |||||
| 2026-01-26 | 13F | Discipline Wealth Solutions, LLC | 43.218 | 23,82 | 613 | 17,47 | ||||
| 2026-02-17 | 13F | Cetera Investment Advisers | 239.859 | -19,01 | 3.401 | -23,12 | ||||
| 2026-02-03 | 13F | Apeiron RIA LLC | 18.193 | 2,99 | 250 | 2,04 | ||||
| 2026-01-30 | 13F | Us Bancorp \de\ | 13.067 | 185 | ||||||
| 2026-02-12 | 13F | Summit Financial, LLC | 18.692 | -6,08 | 265 | -10,77 | ||||
| 2026-01-20 | 13F | Wealthcare Capital Management Llc | 11.011 | 156 | ||||||
| 2025-10-20 | 13F | Shilanski & Associates, Inc. | 207.821 | 2,35 | 3.105 | -6,08 | ||||
| 2026-02-11 | 13F | Real Talk Capital, LLC | 49.273 | 15,43 | 699 | 9,58 | ||||
| 2026-01-23 | 13F | Farther Finance Advisors, LLC | 96.165 | -28,56 | 1.364 | -32,22 | ||||
| 2026-02-05 | 13F | Tucker Asset Management Llc | 0 | -100,00 | 0 | |||||
| 2026-01-23 | 13F | Aspect Partners, LLC | 969 | 5,67 | 14 | 0,00 | ||||
| 2026-02-09 | 13F | Cary Street Partner Investment Advisory Llc | 1.800 | 26 | ||||||
| 2026-02-10 | 13F | Goldman Sachs Group Inc | 69.267 | 435,13 | 982 | 408,81 | ||||
| 2026-02-12 | 13F | Principal Securities, Inc. | 30.060 | 101,83 | 426 | 91,89 | ||||
| 2026-02-13 | 13F | Cynosure Management, Llc | 42.692 | -75,35 | 605 | -76,60 | ||||
| 2026-02-17 | 13F | Equitable Holdings, Inc. | 289.992 | 1,06 | 4.112 | -4,08 | ||||
| 2026-02-12 | 13F | Wedbush Securities Inc | 140.306 | 4,31 | 2 | -50,00 | ||||
| 2026-02-17 | 13F | Bank Of America Corp /de/ | 5.829.897 | -5,68 | 82.668 | -10,48 | ||||
| 2026-02-12 | 13F | Advisors Asset Management, Inc. | 39.063 | 20,70 | 554 | 14,49 | ||||
| 2026-02-13 | 13F | Beacon Financial Advisory LLC | 25.073 | -0,41 | 356 | -5,59 | ||||
| 2026-02-13 | 13F | Ausdal Financial Partners, Inc. | 10.138 | -55,91 | 144 | -58,31 | ||||
| 2026-02-13 | 13F | Bard Associates Inc | 749.444 | 12,06 | 10.627 | 6,37 | ||||
| 2026-02-03 | 13F | Grimes & Company, Inc. | 30.475 | 432 | ||||||
| 2026-02-18 | 13F | Beacon Pointe Advisors, LLC | 95.716 | -39,48 | 1.357 | -42,55 | ||||
| 2026-03-06 | 13F | Hsbc Holdings Plc | 50.000 | 710 | ||||||
| 2026-02-13 | 13F | Maia Wealth LLC | 71.845 | 191,42 | 978 | 179,94 | ||||
| 2025-12-16 | 13F | Garde Capital, Inc. | 0 | -100,00 | 0 | |||||
| 2026-02-19 | 13F | CI Private Wealth, LLC | 10.966 | -56,01 | 155 | -58,33 | ||||
| 2026-02-06 | 13F | Larson Financial Group LLC | 21.341 | -1,45 | 303 | -6,50 | ||||
| 2026-02-05 | 13F | Pacitti Group Inc. | 62.797 | 3,67 | 890 | -1,55 | ||||
| 2026-02-04 | 13F | Money Concepts Capital Corp | 0 | -100,00 | 0 | |||||
| 2026-01-14 | 13F | Spire Wealth Management | 57.886 | -39,32 | 821 | -42,46 | ||||
| 2026-01-28 | 13F | Milestone Asset Management, Llc | 0 | -100,00 | 0 | |||||
| 2026-01-16 | 13F | Ronald Blue Trust, Inc. | 175 | -7,89 | 2 | 0,00 | ||||
| 2026-02-05 | 13F | Everstar Asset Management, LLC | 24.360 | 1,42 | 345 | -3,63 | ||||
| 2026-02-06 | 13F | Cascade Financial Partners, LLC | 17.576 | 2,63 | 249 | -2,35 | ||||
| 2026-02-09 | 13F | Putnam Fl Investment Management Co | 0 | -100,00 | 0 | |||||
| 2026-02-06 | 13F | Hexagon Capital Partners LLC | 13.393 | -1,64 | 190 | -6,90 | ||||
| 2026-02-06 | 13F | Pnc Financial Services Group, Inc. | 250 | 0,00 | 4 | 0,00 | ||||
| 2026-02-02 | 13F | CX Institutional | 0 | -100,00 | 0 | |||||
| 2026-02-17 | 13F | Balyasny Asset Management Llc | 87.160 | 1.236 | ||||||
| 2025-11-05 | 13F | Axim Planning & Wealth | 0 | -100,00 | 0 | |||||
| 2026-02-05 | 13F | Sherman Asset Management, Inc. | 3.508 | 0,00 | 50 | -5,77 | ||||
| 2026-01-15 | 13F | Adams Asset Advisors, LLC | 76.171 | -0,38 | 1.080 | -5,43 | ||||
| 2026-01-21 | 13F | Capital Investment Advisory Services, LLC | 11.153 | 18,49 | 158 | 12,86 | ||||
| 2026-02-05 | 13F | Hicks Capital Management Llc | 10.000 | 142 | ||||||
| 2026-02-13 | 13F | Cordoba Advisory Partners LLC | 73.243 | 1.039 | ||||||
| 2026-01-23 | 13F | U.S. Capital Wealth Advisors, LLC | 0 | -100,00 | 0 | |||||
| 2026-01-12 | 13F | Amplius Wealth Advisors, LLC | 104.326 | 1.479 | ||||||
| 2026-02-17 | 13F | Fmr Llc | 73 | -93,26 | 1 | -93,75 | ||||
| 2026-01-28 | 13F | Kingswood Wealth Advisors, Llc | 149.751 | 4,31 | 2.123 | -0,98 | ||||
| 2026-02-17 | 13F | Advisor Group Holdings, Inc. | 182.895 | -68,73 | 2.593 | -71,91 | ||||
| 2026-02-17 | 13F | Blair William & Co/il | 1.188 | 17 | ||||||
| 2026-01-06 | 13F | Ransom Advisory, Ltd | 400 | 6 | ||||||
| 2026-02-13 | 13F | Visionary Wealth Advisors | 31.959 | -20,52 | 453 | -24,50 | ||||
| 2026-02-17 | 13F | Qube Research & Technologies Ltd | 231 | -5,33 | 3 | 0,00 | ||||
| 2026-02-04 | 13F | Shade Tree Advisors LLC | 31.607 | 448 | ||||||
| 2026-02-13 | 13F | Centaurus Financial, Inc. | 140.766 | 13,93 | 2 | 0,00 | ||||
| 2026-02-13 | 13F | Aptus Capital Advisors, LLC | 200 | 0,00 | 3 | 0,00 | ||||
| 2026-02-17 | 13F | Cape Investment Advisory, Inc. | 2.000 | 28 | ||||||
| 2026-01-07 | 13F | Aventura Private Wealth, LLC | 908 | 2,83 | 13 | -7,69 | ||||
| 2026-02-13 | 13F | Parkside Financial Bank & Trust | 0 | -100,00 | 0 | |||||
| 2026-02-26 | 13F | Anchor Investment Management, LLC | 11.429 | -8,78 | 162 | -13,37 | ||||
| 2026-02-02 | 13F | Alpha Wealth Funds, LLC | 176.061 | 153,57 | 2.497 | 140,69 | ||||
| 2026-02-03 | 13F | We Are One Seven, LLC | 355.603 | 100,69 | 5.042 | 90,48 | ||||
| 2026-02-12 | 13F | Barings Llc | 0 | -100,00 | 0 | |||||
| 2026-02-17 | 13F | Wiley Bros.-aintree Capital, Llc | 10.132 | 144 | ||||||
| 2026-02-17 | 13F | Creative Planning | 67.600 | -8,86 | 959 | -13,54 | ||||
| 2025-11-03 | 13F | Townsquare Capital Llc | 0 | -100,00 | 0 | |||||
| 2026-01-08 | 13F | Maridea Wealth Management LLC | 0 | -100,00 | 0 | |||||
| 2026-02-03 | 13F | Generali Asset Management SPA SGR | 2.200.000 | 0,00 | 31.196 | -5,09 | ||||
| 2026-02-04 | 13F | Pensionmark Financial Group, Llc | 43.221 | 34,57 | 606 | 26,51 | ||||
| 2026-02-09 | 13F | Cary Street Partners Financial Llc | 46.192 | 114,07 | 655 | 103,11 | ||||
| 2026-02-17 | 13F | Hilltop Holdings Inc. | 34.766 | -91,84 | 493 | -92,27 | ||||
| 2026-02-13 | 13F | Stifel Financial Corp | 397.534 | -0,01 | 5.637 | -5,09 | ||||
| 2026-03-04 | 13F | SHP Wealth Management | 31.745 | 450 | ||||||
| 2026-01-08 | 13F | Financial Management Network Inc | 166.362 | -10,80 | 2.372 | -11,16 | ||||
| 2026-02-20 | 13F | Sunbelt Securities, Inc. | 0 | -100,00 | 0 | |||||
| 2026-01-28 | 13F | WMG Financial Advisors, LLC | 95.150 | 19,01 | 1.349 | 12,98 | ||||
| 2026-01-26 | 13F | Private Trust Co Na | 6.408 | 52,57 | 91 | 45,16 | ||||
| 2026-01-30 | 13F | Samalin Investment Counsel, LLC | 130.370 | -10,73 | 1.849 | -15,27 | ||||
| 2026-02-10 | 13F | CIBC World Markets Inc. | 52.320 | 742 | ||||||
| 2026-02-06 | 13F | EverSource Wealth Advisors, LLC | 3.250 | 0,00 | 46 | -4,17 | ||||
| 2026-02-17 | 13F | Royal Bank Of Canada | 493.267 | -4,48 | 6.995 | -9,33 | ||||
| 2026-02-12 | 13F | Commonwealth Equity Services, Llc | 281.555 | -21,36 | 3.992 | 79.740,00 | ||||
| 2025-10-17 | 13F | Sowell Financial Services LLC | 0 | -100,00 | 0 | |||||
| 2026-01-05 | 13F | Park Avenue Securities Llc | 37.509 | -62,16 | 1 | -100,00 | ||||
| 2026-02-17 | 13F | Raymond James Financial Inc | 1.402.794 | 205,16 | 19.892 | 189,66 | ||||
| 2026-02-13 | 13F | Mml Investors Services, Llc | 72.133 | 15,37 | 1.023 | 9,42 | ||||
| 2026-01-21 | 13F | Kentucky Trust Co | 500 | 0,00 | 7 | 0,00 | ||||
| 2026-01-21 | 13F | Naviter Wealth, LLC | 549.513 | 63,11 | 7.792 | 54,82 | ||||
| 2026-02-04 | 13F | Atlantic Union Bankshares Corp | 1.400 | 0,00 | 20 | -5,00 | ||||
| 2026-02-12 | 13F | Brinker Capital Investments, LLC | 66.754 | -2,59 | 947 | -7,53 | ||||
| 2025-11-12 | 13F | Creekmur Asset Management LLC | 4 | 0,00 | 0 | |||||
| 2026-02-06 | 13F | Creative Financial Designs Inc /adv | 1.200 | 0,00 | 17 | 0,00 | ||||
| 2026-02-10 | 13F | Moors & Cabot, Inc. | 0 | -100,00 | 0 | |||||
| 2026-02-03 | 13F | International Assets Investment Management, Llc | 159.727 | -3,08 | 2.265 | -11,18 | ||||
| 2026-02-17 | 13F | Point72 Asset Management, L.P. | Put | 50.000 | 709 | |||||
| 2026-02-02 | 13F | Cornerstone Planning Group LLC | 165 | 275,00 | 2 | -33,33 | ||||
| 2026-02-13 | 13F | Barclays Plc | 0 | -100,00 | 0 | |||||
| 2026-02-11 | 13F | Next Capital Management LLC | 46.000 | 652 | ||||||
| 2026-01-23 | 13F | Gibbs Wealth Management | 68.506 | -9,56 | 982 | -13,17 | ||||
| 2026-02-11 | 13F | J.w. Cole Advisors, Inc. | 158.328 | -0,51 | 2.245 | -5,55 | ||||
| 2026-02-06 | 13F | IFP Advisors, Inc | 5.207 | 2,78 | 74 | -2,67 | ||||
| 2026-01-12 | 13F | Sax Wealth Advisors, Llc | 113.305 | -7,32 | 1.607 | -12,05 | ||||
| 2026-02-12 | 13F | Steward Partners Investment Advisory, Llc | 189.002 | -44,03 | 2.680 | -46,87 | ||||
| 2026-02-12 | 13F | Kovack Advisors, Inc. | 10.206 | 17 | ||||||
| 2026-01-21 | 13F | Sound Income Strategies, LLC | 134.980 | 3.239,44 | 1.961 | 3.465,45 | ||||
| 2025-10-29 | 13F | Capital Advisory Group Advisory Services, LLC | 0 | -100,00 | 0 | |||||
| 2026-02-17 | 13F | Susquehanna International Group, Llp | 202.873 | 311,26 | 2.877 | 290,76 | ||||
| 2026-02-09 | 13F | Valtinson Bruner Financial Planning LLC | 14.775 | 1,16 | 210 | -4,13 | ||||
| 2026-02-17 | 13F | Susquehanna International Group, Llp | Put | 20.200 | 286 | |||||
| 2026-02-02 | 13F/A | Fortress Wealth Group, LLC | 14.932 | 209 | ||||||
| 2026-01-23 | 13F | Sage Mountain Advisors LLC | 9.154 | -56,00 | 130 | -58,39 | ||||
| 2026-01-15 | 13F | Investment Partners Asset Management, Inc. | 94.373 | -11,50 | 1.338 | -16,01 | ||||
| 2026-02-05 | 13F | Cambridge Investment Research Advisors, Inc. | 167.931 | 16,32 | 2 | 0,00 | ||||
| 2026-02-13 | 13F | Bayview Asset Management, Llc | Put | 400.000 | 5.672 | |||||
| 2026-02-05 | 13F | Stephens Inc /ar/ | 10.075 | -28,42 | 143 | -32,38 | ||||
| 2026-02-13 | 13F | Bayview Asset Management, Llc | 274.000 | 3.885 | ||||||
| 2026-01-21 | 13F | Newbridge Financial Services Group, Inc. | 508 | 5,83 | 7 | 0,00 | ||||
| 2026-02-12 | 13F | Haven Private, LLC | 471.720 | -23,13 | 6.689 | -27,04 | ||||
| 2026-02-11 | 13F | Jpmorgan Chase & Co | 3.406 | -90,02 | 48 | -90,57 | ||||
| 2026-02-10 | 13F | Baker Avenue Asset Management, LP | 115.140 | 558,47 | 1.633 | 525,29 | ||||
| 2026-02-17 | 13F | Two Sigma Investments, Lp | 2.252.200 | 6.447,09 | 31.936 | 6.125,34 | ||||
| 2026-02-05 | 13F | Stonebridge Financial Planning Group, LLC | 108.435 | -19,46 | 1.538 | -23,57 | ||||
| 2026-02-09 | 13F | Jefferies Financial Group Inc. | 63.213 | 38,02 | 896 | 30,99 | ||||
| 2026-01-13 | 13F | CoreCap Advisors, LLC | 3.322 | -8,91 | 47 | -12,96 | ||||
| 2026-02-11 | 13F | GFS Advisors, LLC | 135.100 | 1.916 | ||||||
| 2026-01-20 | 13F | Stratos Wealth Partners, LTD. | 107.364 | -20,51 | 1.522 | -24,54 | ||||
| 2026-02-06 | 13F | Morling Financial Advisors, LLC | 28.700 | 407 | ||||||
| 2026-01-29 | 13F | Sanctuary Advisors, LLC | 29.087 | 412 | ||||||
| 2026-01-21 | 13F | Register Financial Advisors LLC | 6.151 | -69,01 | 87 | -70,61 | ||||
| 2026-01-22 | 13F | Glass Jacobson Investment Advisors llc | 398 | 0,00 | 6 | 0,00 | ||||
| 2026-02-10 | 13F | B&l Asset Management Llc | 18.563 | 0,00 | 263 | -5,05 | ||||
| 2026-01-20 | 13F | Ntv Asset Management Llc | 0 | -100,00 | 0 | |||||
| 2026-02-13 | 13F | Bay Colony Advisory Group, Inc d/b/a Bay Colony Advisors | 0 | -100,00 | 0 | -100,00 | ||||
| 2026-02-10 | 13F | Envestnet Asset Management Inc | 292.443 | -28,50 | 4.147 | -32,14 | ||||
| 2026-02-10 | 13F | Foundations Investment Advisors, LLC | 0 | -100,00 | 0 | |||||
| 2026-02-12 | 13F | Hollencrest Capital Management | 5.885 | 0,00 | 83 | -4,60 | ||||
| 2026-01-23 | 13F | Assetmark, Inc | 71 | -77,95 | 1 | -75,00 | ||||
| 2026-02-13 | 13F | Financial Network Wealth Advisors LLC | 4.236 | -1,42 | 60 | -6,25 | ||||
| 2025-10-27 | 13F | Gill Capital Partners, Llc | 0 | -100,00 | 0 | -100,00 | ||||
| 2026-01-28 | 13F | HB Wealth Management, LLC | 20.680 | 1,89 | 293 | -3,30 | ||||
| 2026-01-26 | 13F | Consolidated Portfolio Review Corp | 0 | -100,00 | 0 | |||||
| 2026-02-06 | 13F | HighTower Advisors, LLC | 128.443 | 17,01 | 1.821 | 11,10 | ||||
| 2026-02-17 | 13F | Graham Capital Management, L.P. | 100.000 | 1.418 | ||||||
| 2025-11-14 | 13F | Strategic Wealth Partners, Ltd. | 168 | 3 | ||||||
| 2026-03-16 | 13F | Osbon Capital Management Llc | 1.237 | 18 | ||||||
| 2026-01-23 | 13F | Webster Bank, N. A. | 3.456 | 0,00 | 49 | -3,92 | ||||
| 2026-02-03 | 13F | Koshinski Asset Management, Inc. | 10.190 | 0,00 | 144 | -5,26 | ||||
| 2026-02-12 | 13F | Proficio Capital Partners LLC | 49.330 | 699 | ||||||
| 2026-02-17 | 13F | MGB Wealth Management, LLC | 0 | -100,00 | 0 | |||||
| 2026-02-05 | 13F | Bank Julius Baer & Co. Ltd, Zurich | 1.671.197 | 6,02 | 23.698 | 0,62 | ||||
| 2026-02-05 | 13F | L & S Advisors Inc | 14.224 | 202 | ||||||
| 2025-10-31 | 13F | Whittier Trust Co Of Nevada Inc | 0 | -100,00 | 0 | |||||
| 2026-02-11 | 13F | Symphony Financial, Ltd. Co. | 26.647 | -6,75 | 377 | -11,29 | ||||
| 2026-01-30 | 13F | Caldwell Securities, Inc | 100 | 1 | ||||||
| 2026-02-12 | 13F | Jane Street Group, Llc | 13.978 | -81,78 | 198 | -82,72 | ||||
| 2026-02-13 | 13F | Wealth Alliance | 101.774 | 4,87 | 1.443 | -0,41 | ||||
| 2026-01-28 | 13F | Geneos Wealth Management Inc. | 3.122 | 3,93 | 44 | 0,00 | ||||
| 2025-10-31 | 13F | NWF Advisory Services Inc. | 0 | -100,00 | 0 | |||||
| 2026-01-16 | 13F | PFS Partners, LLC | 589 | 0,00 | 8 | 0,00 | ||||
| 2026-01-02 | 13F | Global Wealth Strategies & Associates | 3.541 | 50 | ||||||
| 2026-02-13 | 13F | SRS Capital Advisors, Inc. | 4.437 | 0,00 | 63 | -6,06 | ||||
| 2026-02-09 | 13F | Endowment Wealth Management, Inc. | 34.270 | 9,63 | 486 | 3,85 |