Grundlæggende statistik
| Institutionelle ejere | 171 total, 171 long only, 0 short only, 0 long/short - change of 6,83% MRQ |
| Gennemsnitlig porteføljeallokering | 0.2729 % - change of -17,89% MRQ |
| Institutionelle aktier (lange) | 16.173.039 (ex 13D/G) - change of -0,12MM shares -0,72% MRQ |
| Institutionel værdi (lang) | $ 679.707 USD ($1000) |
Institutionelt ejerskab og aktionærer
GraniteShares Gold Trust (US:BAR) har 171 institutionelle ejere og aktionærer, der har indsendt 13D/G- eller 13F-formularer til Securities Exchange Commission (SEC). Disse institutioner har i alt 16,173,039 aktier. Største aktionærer omfatter Bank Of America Corp /de/, Richard Bernstein Advisors LLC, Bank of New York Mellon Corp, Envestnet Asset Management Inc, Royal Bank Of Canada, LPL Financial LLC, Rockefeller Capital Management L.P., Advyzon Investment Management, LLC, Brandywine Oak Private Wealth Llc, and Ausdal Financial Partners, Inc. .
GraniteShares Gold Trust (ARCA:BAR) institutionel ejerskabsstruktur viser aktuelle positioner i virksomheden efter institutioner og fonde, samt seneste ændringer i positionsstørrelse. Større aktionærer kan omfatte individuelle investorer, investeringsforeninger, hedgefonde eller institutioner. Skema 13D angiver, at investoren besidder (eller besidder) mere end 5 % af virksomheden og har til hensigt (eller har til hensigt at) aktivt at forfølge en ændring i forretningsstrategi. Skema 13G indikerer en passiv investering på over 5%.
The share price as of March 13, 2026 is 49,40 / share. Previously, on March 14, 2025, the share price was 29,45 / share. This represents an increase of 67,74% over that period.

Fondens stemningsscore
Fund Sentiment Score (fka Ownership Accumulation Score) finder de aktier, der bliver mest købt af fonde. Det er resultatet af en sofistikeret, multi-faktor kvantitativ model, der identificerer virksomheder med de højeste niveauer af institutionel akkumulering. Scoringsmodellen bruger en kombination af den samlede stigning i oplyste ejere, ændringerne i porteføljeallokeringer i disse ejere og andre målinger. Tallet går fra 0 til 100, hvor højere tal indikerer et højere niveau af akkumulering for sine jævnaldrende, og 50 er gennemsnittet.
Opdateringsfrekvens: Dagligt
Se Ownership Explorer, som giver en liste over højest rangerende virksomheder.
AI+ Ask Fintel’s AI assistant about GraniteShares Gold Trust.
Select a question to share a public post with an AI-crafted answer.
Thinking of good questions…
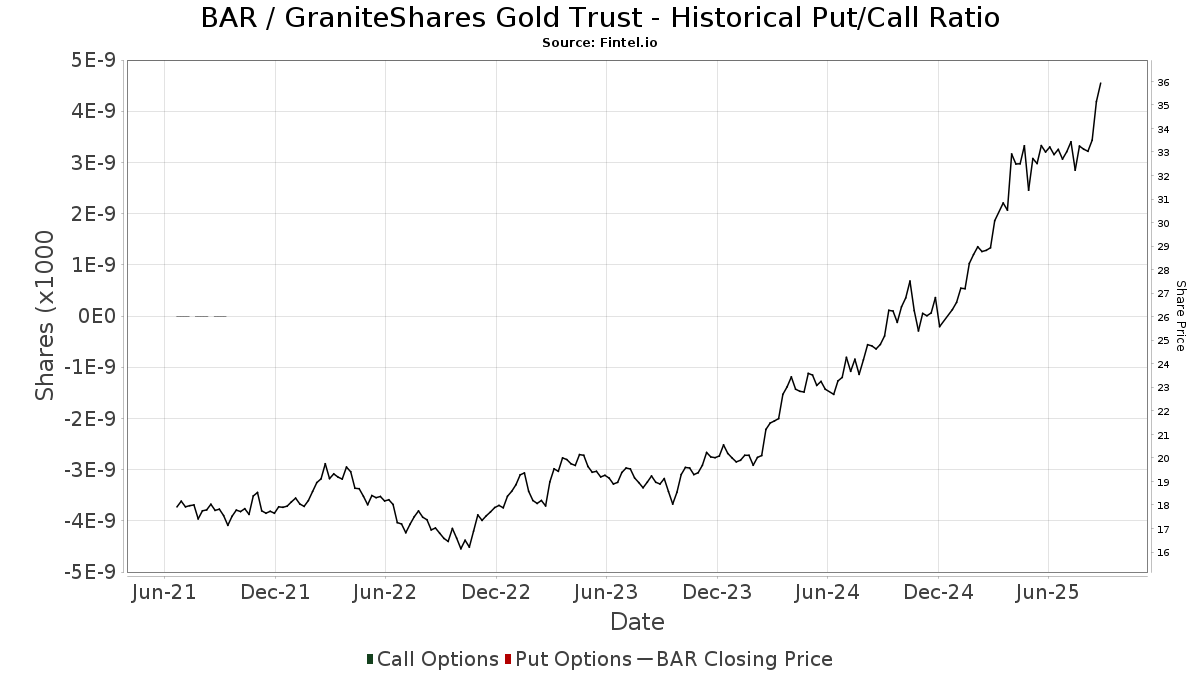
Institutionel Put/Call-forhold
Ud over at indberette standardaktie- og gældsudstedelser skal institutter med mere end 100 mill. aktiver under forvaltning også oplyse deres put- og call-optionsbeholdninger. Da salgsoptioner generelt indikerer negativ stemning, og købsoptioner indikerer positiv stemning, kan vi få en fornemmelse af den overordnede institutionelle stemning ved at plotte forholdet mellem put og kald. Diagrammet til højre viser det historiske put/call-forhold for dette instrument.
Brug af Put/Call Ratio som en indikator for investorernes stemning overvinder en af de vigtigste mangler ved at bruge totalt institutionelt ejerskab, som er, at en betydelig mængde af aktiver under forvaltning investeres passivt for at spore indekser. Passivt forvaltede fonde køber typisk ikke optioner, så indikatoren for put/call-forholdet følger mere nøje følelsen af aktivt forvaltede fonde.
13F og NPORT arkivering
Detaljer om 13F-arkivering er gratis. Detaljer om NP-ansøgninger kræver et premium-medlemskab. Grønne rækker angiver nye positioner. Røde rækker angiver lukkede positioner. Klik på linket ikon for at se den fulde transaktionshistorik.
Opgrader
for at låse premium-data op og eksportere til Excel ![]() .
.
| Fil dato | Kilde | Investor | Type | Gennemsnitlig pris (Øst) |
Aktier | Δ Aktier (%) |
Rapporteret Værdi ($1000) |
Δ Værdi (%) |
Port Alloc (%) |
|
|---|---|---|---|---|---|---|---|---|---|---|
| 2026-02-02 | 13F | Truist Financial Corp | 8.938 | -14,01 | 380 | -4,05 | ||||
| 2026-01-13 | 13F | FSA Investment Group, LLC | 58.404 | 1,02 | 2.482 | 12,57 | ||||
| 2026-02-13 | 13F | Beacon Financial Advisory LLC | 11.633 | 0,61 | 494 | 12,27 | ||||
| 2026-01-16 | 13F | Ronald Blue Trust, Inc. | 9.205 | 0,77 | 391 | 12,68 | ||||
| 2026-02-10 | 13F | Clear Point Advisors Inc. | 90.971 | -2,83 | 3.865 | 8,48 | ||||
| 2026-01-26 | 13F | Cwm, Llc | 8.144 | -2,68 | 0 | |||||
| 2026-02-13 | 13F | Aptus Capital Advisors, LLC | 33.992 | -0,13 | 1.444 | 11,51 | ||||
| 2026-02-17 | 13F | Citadel Advisors Llc | 0 | -100,00 | 0 | |||||
| 2026-02-12 | 13F | Renaissance Technologies Llc | 100.700 | 15,09 | 4.279 | 28,47 | ||||
| 2026-02-10 | 13F | Eq Llc | 27.178 | -0,96 | 1.155 | 10,54 | ||||
| 2026-01-12 | 13F | Evanson Asset Management, LLC | 11.083 | -9,19 | 471 | 1,29 | ||||
| 2026-02-13 | 13F | Denver Wealth Management, Inc. | 14.241 | 0,00 | 605 | 11,62 | ||||
| 2026-01-13 | 13F | CoreCap Advisors, LLC | 1.246 | 0,00 | 53 | 10,64 | ||||
| 2026-01-27 | 13F | Semus Wealth Partners LLC | 32.844 | -0,16 | 1.396 | 11,42 | ||||
| 2026-01-29 | 13F | Comprehensive Financial Consultants Institutional, Inc. | 8.687 | 0,00 | 369 | 11,82 | ||||
| 2026-02-03 | 13F | We Are One Seven, LLC | 17.389 | -37,60 | 739 | -30,38 | ||||
| 2026-02-05 | 13F | Castle Rock Wealth Management, LLC | 6.979 | 0,79 | 337 | 28,63 | ||||
| 2026-02-13 | 13F | Mml Investors Services, Llc | 271.792 | 4,83 | 11.548 | 17,02 | ||||
| 2026-01-26 | 13F | Brendel Financial Advisors LLC | 148.130 | -0,63 | 6.294 | 10,95 | ||||
| 2026-02-11 | 13F | Empowered Funds, LLC | 202.754 | 66,30 | 8.615 | 85,67 | ||||
| 2026-01-15 | 13F | Frank, Rimerman Advisors LLC | 6.121 | 0,00 | 260 | 12,07 | ||||
| 2026-01-15 | 13F | Cherry Creek Investment Advisors, Inc. | 77.575 | -0,48 | 3.296 | 11,13 | ||||
| 2026-02-13 | 13F | Mill Creek Capital Advisors, LLC | 5.873 | -0,05 | 250 | 11,66 | ||||
| 2026-02-17 | 13F | Tower Research Capital LLC (TRC) | 0 | -100,00 | 0 | |||||
| 2026-01-12 | 13F | Roble, Belko & Company, Inc | 50 | 0,00 | 0 | |||||
| 2026-02-13 | 13F | Visionary Wealth Advisors | 7.863 | 0,00 | 334 | 11,71 | ||||
| 2026-01-26 | 13F | Financial Guidance Group, Inc. | 28.969 | -1,12 | 1.231 | 10,31 | ||||
| 2026-02-06 | 13F | Flynn Zito Capital Management, Llc | 11.360 | 483 | ||||||
| 2026-01-23 | 13F | Diversify Advisory Services, LLC | 0 | -100,00 | 0 | |||||
| 2026-02-13 | 13F | Glen Eagle Advisors, LLC | 9.101 | -0,82 | 387 | 10,60 | ||||
| 2026-02-14 | 13F | Rockefeller Capital Management L.P. | 463.694 | 3,07 | 19.702 | 15,08 | ||||
| 2026-02-17 | 13F | Mercer Global Advisors Inc /adv | 80.729 | -19,02 | 3.430 | -9,57 | ||||
| 2026-01-23 | 13F | Smith, Moore & Co. | 30.565 | -1,05 | 1.299 | 10,47 | ||||
| 2026-02-06 | 13F | Axxcess Wealth Management, Llc | 8.695 | 0,00 | 369 | 11,82 | ||||
| 2026-02-13 | 13F | J.E. Simmons & Co., P.C. | 8.250 | 351 | ||||||
| 2026-02-06 | 13F | GPS Wealth Strategies Group, LLC | 0 | -100,00 | 0 | |||||
| 2026-02-17 | 13F | Advisory Services Network, LLC | 0 | -100,00 | 0 | -100,00 | ||||
| 2026-02-10 | 13F | Bnp Paribas Arbitrage, Sa | 1.347 | 13.370,00 | 57 | |||||
| 2026-01-29 | 13F | UBS Group AG | 387 | 16 | ||||||
| 2026-01-26 | 13F | Whittier Trust Co Of Nevada Inc | 1.317 | 0,00 | 58 | 16,00 | ||||
| 2025-11-04 | 13F | Pineridge Advisors LLC | 4.680 | -10,94 | 178 | 4,09 | ||||
| 2025-11-06 | 13F | LexAurum Advisors, LLC | 10.351 | 6,35 | 394 | 23,97 | ||||
| 2026-01-29 | 13F | Comerica Bank | 7.449 | -9,43 | 316 | 0,96 | ||||
| 2026-02-05 | 13F | Atria Investments Llc | 17.840 | -3,26 | 758 | 8,13 | ||||
| 2026-02-17 | 13F | Rs Crum Inc. | 5.740 | 0,00 | 244 | 11,47 | ||||
| 2026-02-10 | 13F | Envestnet Asset Management Inc | 688.467 | -4,06 | 29.253 | 7,10 | ||||
| 2025-10-30 | 13F | WFA Asset Management Corp | 0 | -100,00 | 0 | -100,00 | ||||
| 2026-01-07 | 13F | Lake Street Financial Llc | 406.447 | 1,34 | 17.270 | 13,15 | ||||
| 2026-01-23 | 13F | Rsm Us Wealth Management Llc | 19.644 | 13,95 | 840 | 28,05 | ||||
| 2026-02-18 | 13F/A | Virtue Capital Management, LLC | 36.302 | 263,02 | 1.549 | 11.815,38 | ||||
| 2025-11-14 | 13F/A | Skopos Labs, Inc. | 0 | -100,00 | 0 | -100,00 | ||||
| 2026-02-17 | 13F | Captrust Financial Advisors | 140.717 | -1,57 | 5.979 | 9,91 | ||||
| 2026-01-09 | 13F | Tactive Advisors, LLC | 24.723 | 32,55 | 1.050 | 48,10 | ||||
| 2026-01-16 | 13F | Crew Capital Management, Ltd. | 12.619 | 12,09 | 536 | 25,23 | ||||
| 2026-01-23 | 13F | Freestone Capital Holdings, LLC | 17.764 | 0,00 | 755 | 11,54 | ||||
| 2026-02-12 | 13F | Federation des caisses Desjardins du Quebec | 1.637 | 0,00 | 70 | 11,29 | ||||
| 2026-01-08 | 13F | Armstrong Advisory Group, Inc | 13.944 | 7,33 | 592 | 19,84 | ||||
| 2026-02-13 | 13F | National Bank Of Canada /fi/ | 230 | 0,00 | 10 | 12,50 | ||||
| 2026-01-06 | 13F | Ehrlich Financial Group | 13.561 | -2,47 | 576 | 8,88 | ||||
| 2026-02-09 | 13F | Thrive Capital Management, LLC | 4.717 | 200 | ||||||
| 2026-02-17 | 13F | Raymond James Financial Inc | 197.144 | -0,91 | 8.377 | 10,62 | ||||
| 2026-01-26 | 13F | AE Wealth Management LLC | 67.736 | -2,66 | 2.878 | 8,69 | ||||
| 2026-02-11 | 13F | LPL Financial LLC | 520.174 | -23,42 | 22.102 | -14,51 | ||||
| 2026-02-12 | 13F | Steward Partners Investment Advisory, Llc | 164.474 | 1,52 | 6.989 | 13,33 | ||||
| 2026-02-13 | 13F | Kestra Advisory Services, LLC | 3.660 | 156 | ||||||
| 2026-01-14 | 13F | Kraft, Davis & Associates, LLC | 12.767 | 0,00 | 577 | 15,66 | ||||
| 2026-02-04 | 13F | Ballast Rock Private Wealth LLC | 6.254 | 266 | ||||||
| 2026-02-06 | 13F | Global Retirement Partners, LLC | 1.111 | 47 | ||||||
| 2025-11-14 | 13F | Hrt Financial Lp | 0 | -100,00 | 0 | |||||
| 2026-02-12 | 13F | Investor's Fiduciary Advisor Network, LLC | 13.409 | 3,60 | 1 | |||||
| 2026-02-10 | 13F | a16z Perennial Management, L.P. | 181.946 | 0,00 | 7.731 | 11,64 | ||||
| 2026-02-10 | 13F | Root Financial Partners, LLC | 189 | 0,00 | 8 | 14,29 | ||||
| 2026-02-17 | 13F | Coastal Bridge Advisors, LLC | 10.944 | 0,00 | 465 | 11,78 | ||||
| 2026-02-10 | 13F | Calton & Associates, Inc. | 4.775 | 203 | ||||||
| 2026-01-29 | 13F | China Universal Asset Management Co., Ltd. | 303.000 | 0,00 | 12.874 | 11,64 | ||||
| 2026-01-20 | 13F | Princeton Global Asset Management LLC | 67 | 3 | ||||||
| 2026-02-06 | 13F | Evoke Wealth, Llc | 10.612 | 0,00 | 451 | 11,66 | ||||
| 2026-01-15 | 13F | ALM First Financial Advisors, LLC | 233.353 | 0,00 | 9.431 | 11,64 | ||||
| 2026-02-06 | 13F | Pnc Financial Services Group, Inc. | 35 | 0,00 | 1 | 0,00 | ||||
| 2026-02-11 | 13F | Janney Montgomery Scott LLC | 10.001 | -2,70 | 0 | |||||
| 2026-01-14 | 13F | Redhawk Wealth Advisors, Inc. | 11.031 | 0,00 | 469 | 11,69 | ||||
| 2026-02-05 | 13F | Sapient Capital Llc | 5.589 | 0,00 | 239 | 13,81 | ||||
| 2026-02-12 | 13F | Jane Street Group, Llc | 0 | -100,00 | 0 | |||||
| 2026-02-12 | 13F | Commonwealth Equity Services, Llc | 100.986 | -18,09 | 4.291 | 107.150,00 | ||||
| 2026-02-05 | 13F | Cambridge Investment Research Advisors, Inc. | 59.053 | -3,66 | 3 | 0,00 | ||||
| 2026-02-04 | 13F | Pensionmark Financial Group, Llc | 5.668 | 5,26 | 231 | 12,75 | ||||
| 2026-02-20 | 13F | Sunbelt Securities, Inc. | 0 | -100,00 | 0 | |||||
| 2026-01-20 | 13F | Trust Co Of Toledo Na /oh/ | 115 | 0,00 | 5 | 0,00 | ||||
| 2026-01-29 | 13F | Concurrent Investment Advisors, LLC | 6.286 | 267 | ||||||
| 2026-02-05 | 13F | Mason & Associates Inc | 171.185 | 16,45 | 7.274 | 30,01 | ||||
| 2026-02-11 | 13F | Patron Partners Advisors, Llc | 13.872 | 14,79 | 589 | 28,32 | ||||
| 2026-01-30 | 13F | Archer Investment Corp | 923 | 0,00 | 39 | 11,43 | ||||
| 2026-01-15 | 13F | Columbus Macro, LLC | 262.670 | -3,18 | 11.161 | 8,09 | ||||
| 2026-01-22 | 13F | ETF Store, Inc. | 113.498 | -7,03 | 4.823 | 3,79 | ||||
| 2026-01-29 | 13F | Sanctuary Advisors, LLC | 51.272 | -1,53 | 2.179 | 9,94 | ||||
| 2026-02-09 | 13F | Frazier Financial Advisors, LLC | 40 | 0,00 | 2 | 0,00 | ||||
| 2026-01-20 | 13F | Signaturefd, Llc | 71 | 0,00 | 3 | 50,00 | ||||
| 2026-02-03 | 13F | Richard Bernstein Advisors LLC | 2.196.094 | -1,52 | 93.313 | 8,03 | ||||
| 2025-11-13 | 13F | Quadrature Capital Ltd | 0 | -100,00 | 0 | |||||
| 2026-01-08 | 13F | Wealth Enhancement Advisory Services, Llc | 7.991 | -1,79 | 354 | 10,66 | ||||
| 2026-01-29 | 13F | DecisionPoint Financial, LLC | 102 | 0,00 | 4 | 33,33 | ||||
| 2026-02-05 | 13F | Western Wealth Management, LLC | 7.115 | -22,37 | 302 | -13,22 | ||||
| 2026-02-12 | 13F | Hollencrest Capital Management | 890 | 0,00 | 38 | 12,12 | ||||
| 2026-01-29 | 13F | BKM Wealth Management, LLC | 26.966 | -11,18 | 1.146 | -0,87 | ||||
| 2026-02-13 | 13F | SRS Capital Advisors, Inc. | 7.235 | 19,29 | 307 | 33,48 | ||||
| 2026-02-17 | 13F | Private Advisor Group, LLC | 16.733 | -1,59 | 711 | 9,74 | ||||
| 2026-02-17 | 13F | Jones Financial Companies Lllp | 68 | 3 | ||||||
| 2026-01-21 | 13F | Leo Wealth, LLC | 23.064 | 980 | ||||||
| 2026-02-03 | 13F | SBI Securities Co., Ltd. | 312 | 89,09 | 13 | 116,67 | ||||
| 2026-02-11 | 13F | Cerity Partners LLC | 11.225 | 4,66 | 477 | 16,67 | ||||
| 2026-01-30 | 13F | Jackson Hole Capital Partners, LLC | 70.950 | -0,17 | 3.015 | 11,46 | ||||
| 2026-02-13 | 13F | Citigroup Inc | 0 | -100,00 | 0 | -100,00 | ||||
| 2026-02-17 | 13F | Fmr Llc | 3.951 | 5,75 | 168 | 17,61 | ||||
| 2026-02-10 | 13F | Bank of New York Mellon Corp | 698.687 | 264,22 | 29.687 | 306,62 | ||||
| 2026-02-17 | 13F | Advisor Group Holdings, Inc. | 292.197 | -1,86 | 12.415 | 14,02 | ||||
| 2026-01-29 | 13F | Investment Management Corp /va/ /adv | 4.926 | 209 | ||||||
| 2026-02-17 | 13F | Bank Of America Corp /de/ | 2.586.633 | -2,24 | 109.906 | 9,14 | ||||
| 2026-01-15 | 13F | Jaffetilchin Investment Partners, LLC | 16.893 | -1,02 | 718 | 10,48 | ||||
| 2026-02-06 | 13F | Vestmark Advisory Solutions, Inc. | 42.497 | 1.806 | ||||||
| 2026-01-21 | 13F | DMG Group, LLC | 23.115 | 42,40 | 982 | 59,16 | ||||
| 2026-02-13 | 13F | Change Path, LLC | 4.761 | -43,44 | 202 | -36,87 | ||||
| 2026-02-12 | 13F | Principal Securities, Inc. | 0 | -100,00 | 0 | |||||
| 2026-02-06 | 13F | HighTower Advisors, LLC | 69.087 | -7,06 | 2.936 | 3,75 | ||||
| 2026-01-21 | 13F | Sound Income Strategies, LLC | 575 | 0,00 | 26 | 13,64 | ||||
| 2026-02-10 | 13F/A | Northwestern Mutual Wealth Management Co | 19.708 | 14,53 | 837 | 27,98 | ||||
| 2026-02-17 | 13F | Ibex Wealth Advisors | 34.534 | -1,99 | 1.467 | 9,40 | ||||
| 2026-02-13 | 13F | Flow Traders U.s. Llc | 68.245 | 167,40 | 3 | |||||
| 2026-01-23 | 13F | U.S. Capital Wealth Advisors, LLC | 136.674 | -9,19 | 5.807 | 1,38 | ||||
| 2026-01-23 | 13F | HBW Advisory Services LLC | 8.733 | -12,15 | 371 | -1,85 | ||||
| 2026-02-12 | 13F | Wedbush Securities Inc | 5.908 | 0 | ||||||
| 2025-11-05 | 13F | Moloney Securities Asset Management, LLC | 7.920 | 2,19 | 301 | 19,44 | ||||
| 2025-11-12 | 13F | Kingsview Wealth Management, LLC | 0 | -100,00 | 0 | -100,00 | ||||
| 2026-02-05 | 13F | Tucker Asset Management Llc | 2.315 | 98 | ||||||
| 2026-01-23 | 13F | Farther Finance Advisors, LLC | 44.970 | -14,33 | 1.911 | -4,36 | ||||
| 2026-01-26 | 13F | Nations Financial Group Inc, /ia/ /adv | 159.045 | 3,62 | 6.758 | 15,68 | ||||
| 2026-02-13 | 13F | Advyzon Investment Management, LLC | 451.967 | 55,02 | 19.204 | 73,07 | ||||
| 2026-01-30 | 13F | ASB Consultores, LLC | 6.327 | 0,00 | 287 | 19,58 | ||||
| 2026-02-18 | 13F | Pacific Excel Wealth Advisors, Inc. | 10.604 | 526 | ||||||
| 2026-02-17 | 13F | Cetera Investment Advisers | 308.096 | -1,83 | 13.091 | 9,59 | ||||
| 2026-01-27 | 13F | Portfolio Strategies, Inc. | 11.123 | -1,68 | 473 | 9,77 | ||||
| 2026-02-09 | 13F | Huntington National Bank | 1.403 | 31,24 | ||||||
| 2025-10-15 | 13F | Defined Financial Planning LLC | 0 | -100,00 | 0 | -100,00 | ||||
| 2026-03-04 | 13F | SHP Wealth Management | 457 | 19 | ||||||
| 2026-02-17 | 13F | Creative Planning | 11.392 | -18,63 | 484 | -9,02 | ||||
| 2026-01-08 | 13F | Maridea Wealth Management LLC | 214.922 | 16,69 | 9.132 | 14,85 | ||||
| 2026-01-27 | 13F | Institute for Wealth Management, LLC. | 9.767 | 2,48 | 415 | 14,64 | ||||
| 2026-01-30 | 13F | American Financial & Tax Strategies Inc | 32.678 | -8,29 | 1.388 | 2,36 | ||||
| 2026-02-06 | 13F | IFP Advisors, Inc | 5.610 | -1,25 | 238 | 10,19 | ||||
| 2026-01-14 | 13F | Wealthcare Advisory Partners LLC | 7.366 | 6,83 | 313 | 19,08 | ||||
| 2026-02-10 | 13F | Essex Financial Services, Inc. | 15.421 | -0,39 | 655 | 11,21 | ||||
| 2026-02-05 | 13F | Financial Strategies Group, Inc. | 5.605 | -9,79 | 248 | 1,22 | ||||
| 2026-02-17 | 13F | National Asset Management, Inc. | 5.824 | 0,00 | 247 | 11,76 | ||||
| 2026-02-11 | 13F | Jpmorgan Chase & Co | 61.737 | 185,57 | 2.623 | 219,10 | ||||
| 2026-01-12 | 13F | Seacrest Wealth Management, Llc | 5.150 | -7,21 | 226 | 1,81 | ||||
| 2026-02-12 | 13F | Insigneo Advisory Services, Llc | 11.100 | 472 | ||||||
| 2026-02-03 | 13F | Brandywine Oak Private Wealth Llc | 427.952 | -2,09 | 18.184 | 9,31 | ||||
| 2026-02-13 | 13F | Ubs Asset Management Americas Inc | 433 | 18 | ||||||
| 2026-02-09 | 13F | Cypress Capital Management LLC (WY) | 485 | 0,00 | 21 | 11,11 | ||||
| 2026-01-29 | 13F | Almanack Investment Partners, LLC. | 14.645 | -15,47 | 622 | -5,61 | ||||
| 2026-02-17 | 13F | Royal Bank Of Canada | 596.903 | -13,10 | 25.363 | -2,98 | ||||
| 2026-01-09 | 13F | Inspirion Wealth Advisors, Llc | 40.445 | 15,01 | 1.719 | 88,17 | ||||
| 2026-01-15 | 13F | Clg Llc | 12.000 | 0,00 | 510 | 11,62 | ||||
| 2026-02-02 | 13F | Oppenheimer & Co Inc | 36.691 | 1.559 | ||||||
| 2026-02-17 | 13F | Susquehanna International Group, Llp | 90.692 | 80,36 | 3.854 | 101,41 | ||||
| 2026-02-19 | 13F | CI Private Wealth, LLC | 17.064 | 16,09 | 725 | 29,70 | ||||
| 2026-02-13 | 13F | Stifel Financial Corp | 200.428 | -10,22 | 8.516 | 0,22 | ||||
| 2026-02-11 | 13F | TCTC Holdings, LLC | 1.517 | 0,00 | 64 | 12,28 | ||||
| 2026-01-29 | 13F | Broadway Wealth Solutions, Inc. | 0 | -100,00 | 0 | -100,00 | ||||
| 2026-02-17 | 13F | IHT Wealth Management, LLC | 13.894 | -1,54 | 590 | 9,87 | ||||
| 2026-01-29 | 13F | Nbc Securities, Inc. | 415 | 0,00 | 18 | 13,33 | ||||
| 2026-02-12 | 13F | Mount Yale Investment Advisors, LLC | 42.497 | 0,27 | 1.806 | 11,90 | ||||
| 2026-02-13 | 13F | Ausdal Financial Partners, Inc. | 421.091 | 3,20 | 17.892 | 15,21 | ||||
| 2026-02-04 | 13F | MONECO Advisors, LLC | 5.000 | 212 | ||||||
| 2026-02-13 | 13F | Mariner, LLC | 8.073 | 343 | ||||||
| 2026-02-12 | 13F | Wealthspire Advisors, LLC | 0 | -100,00 | 0 | |||||
| 2026-02-17 | 13F | Zacks Investment Management | 5.885 | 0,00 | 250 | 12,11 | ||||
| 2026-02-09 | 13F | Harbour Investments, Inc. | 4.122 | 0,00 | 175 | 12,18 | ||||
| 2026-02-10 | 13F | Lido Advisors, LLC | 9.341 | 0,00 | 367 | 3,10 | ||||
| 2026-01-23 | 13F | Assetmark, Inc | 209 | -3,69 | 9 | 0,00 | ||||
| 2026-01-26 | 13F | Reyes Financial Architecture, Inc. | 5.483 | -4,43 | 233 | 6,42 | ||||
| 2026-01-27 | 13F | PFG Advisors | 18.352 | 0,00 | 780 | 11,60 | ||||
| 2026-02-13 | 13F | J Hagan Capital, Inc. | 8.562 | -71,77 | 364 | -68,54 | ||||
| 2026-02-13 | 13F | Wells Fargo & Company/mn | 16.075 | 28,67 | 683 | 43,79 | ||||
| 2026-02-18 | 13F | GWM Advisors LLC | 46.616 | 51,63 | 1.981 | 69,23 | ||||
| 2026-02-10 | 13F/A | Core Wealth Advisors, Llc | 73.730 | 3.133 | ||||||
| 2026-02-17 | 13F | Cambria Investment Management, L.P. | 281.487 | -8,88 | 11.960 | 1,73 | ||||
| 2026-02-11 | 13F | SOUTH STATE Corp | 464 | 20 | ||||||
| 2026-02-13 | 13F | Morgan Stanley | 66.432 | 3,36 | 2.823 | 15,37 | ||||
| 2026-01-21 | 13F | Capital Advisory Group Advisory Services, LLC | 153.843 | 45,72 | 6.537 | 62,67 |