Grundlæggende statistik
| Institutionelle ejere | 123 total, 123 long only, 0 short only, 0 long/short - change of -59,94% MRQ |
| Gennemsnitlig porteføljeallokering | 0.3257 % - change of -51,13% MRQ |
| Institutionelle aktier (lange) | 103.712.497 (ex 13D/G) - change of -64,91MM shares -38,49% MRQ |
| Institutionel værdi (lang) | $ 7.007.679 USD ($1000) |
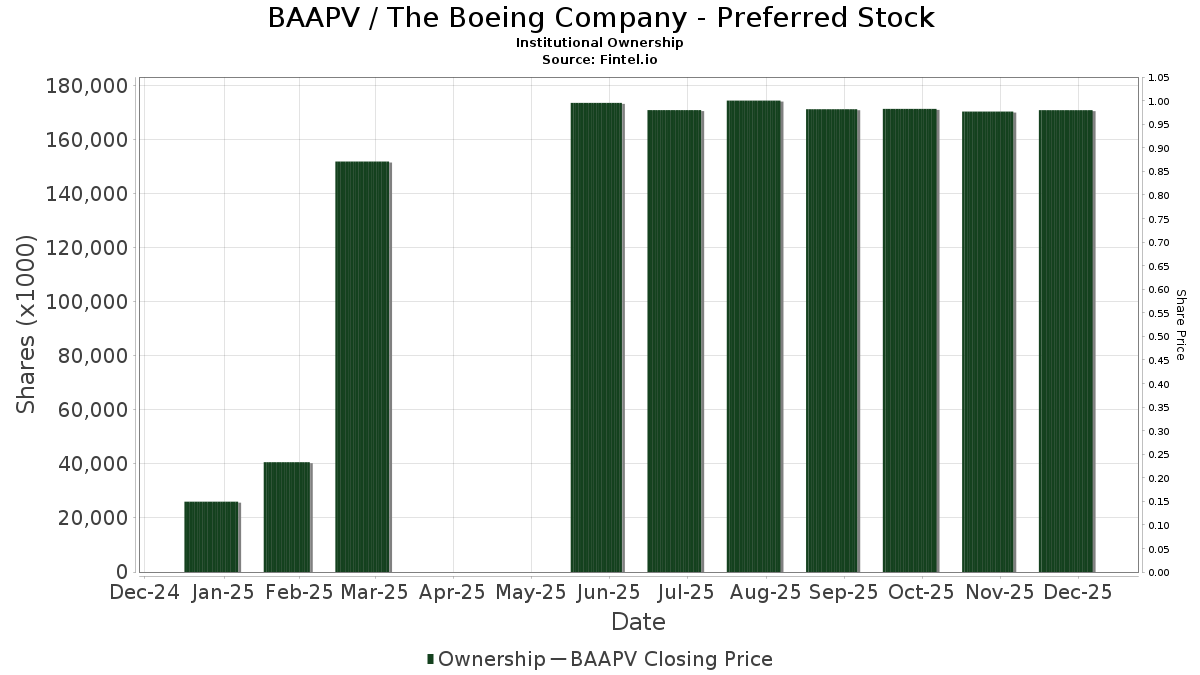
Institutionelt ejerskab og aktionærer
The Boeing Company - Preferred Stock (US:BAAPV) har 123 institutionelle ejere og aktionærer, der har indsendt 13D/G- eller 13F-formularer til Securities Exchange Commission (SEC). Disse institutioner har i alt 103,712,497 aktier. Største aktionærer omfatter Capital World Investors, Capital International Investors, BlackRock, Inc., Franklin Resources Inc, Fmr Llc, Voya Investment Management Llc, Massachusetts Financial Services Co /ma/, Calamos Advisors LLC, Van Eck Associates Corp, and King Street Capital Management, L.p. .
The Boeing Company - Preferred Stock (OTCPK:BAAPV) institutionel ejerskabsstruktur viser aktuelle positioner i virksomheden efter institutioner og fonde, samt seneste ændringer i positionsstørrelse. Større aktionærer kan omfatte individuelle investorer, investeringsforeninger, hedgefonde eller institutioner. Skema 13D angiver, at investoren besidder (eller besidder) mere end 5 % af virksomheden og har til hensigt (eller har til hensigt at) aktivt at forfølge en ændring i forretningsstrategi. Skema 13G indikerer en passiv investering på over 5%.
Fondens stemningsscore
Fund Sentiment Score (fka Ownership Accumulation Score) finder de aktier, der bliver mest købt af fonde. Det er resultatet af en sofistikeret, multi-faktor kvantitativ model, der identificerer virksomheder med de højeste niveauer af institutionel akkumulering. Scoringsmodellen bruger en kombination af den samlede stigning i oplyste ejere, ændringerne i porteføljeallokeringer i disse ejere og andre målinger. Tallet går fra 0 til 100, hvor højere tal indikerer et højere niveau af akkumulering for sine jævnaldrende, og 50 er gennemsnittet.
Opdateringsfrekvens: Dagligt
Se Ownership Explorer, som giver en liste over højest rangerende virksomheder.
AI+ Ask Fintel’s AI assistant about The Boeing Company - Preferred Stock.
Select a question to share a public post with an AI-crafted answer.
Thinking of good questions…
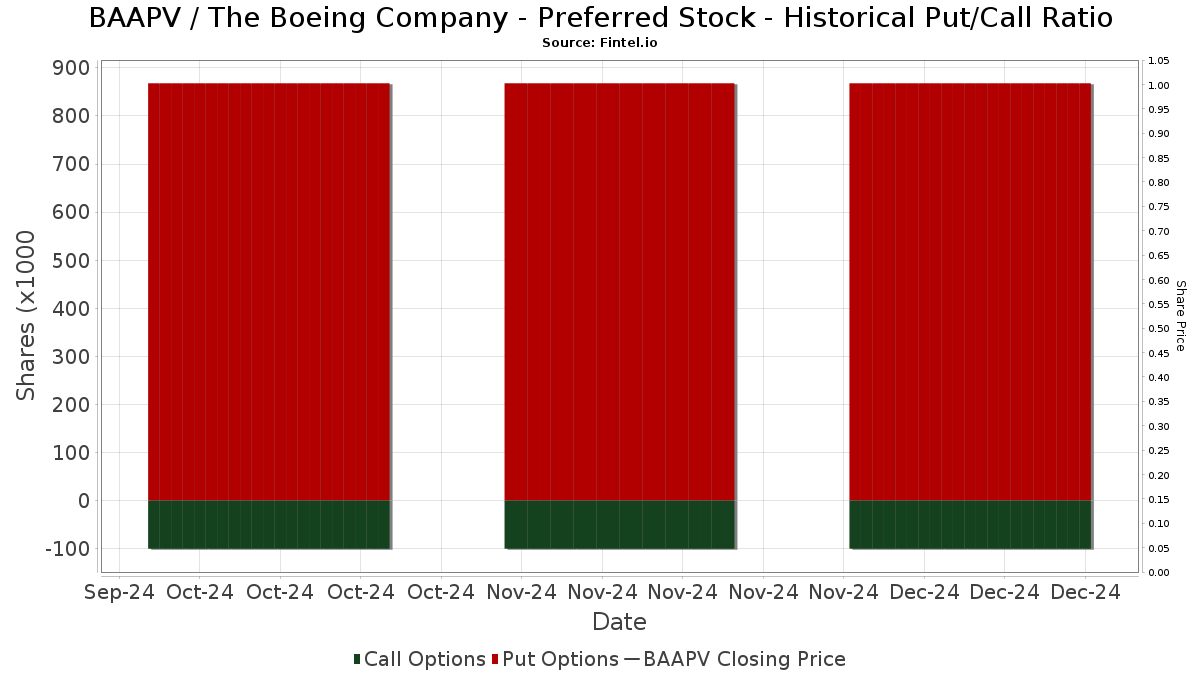
Institutionel Put/Call-forhold
Ud over at indberette standardaktie- og gældsudstedelser skal institutter med mere end 100 mill. aktiver under forvaltning også oplyse deres put- og call-optionsbeholdninger. Da salgsoptioner generelt indikerer negativ stemning, og købsoptioner indikerer positiv stemning, kan vi få en fornemmelse af den overordnede institutionelle stemning ved at plotte forholdet mellem put og kald. Diagrammet til højre viser det historiske put/call-forhold for dette instrument.
Brug af Put/Call Ratio som en indikator for investorernes stemning overvinder en af de vigtigste mangler ved at bruge totalt institutionelt ejerskab, som er, at en betydelig mængde af aktiver under forvaltning investeres passivt for at spore indekser. Passivt forvaltede fonde køber typisk ikke optioner, så indikatoren for put/call-forholdet følger mere nøje følelsen af aktivt forvaltede fonde.
13F og NPORT arkivering
Detaljer om 13F-arkivering er gratis. Detaljer om NP-ansøgninger kræver et premium-medlemskab. Grønne rækker angiver nye positioner. Røde rækker angiver lukkede positioner. Klik på linket ikon for at se den fulde transaktionshistorik.
Opgrader
for at låse premium-data op og eksportere til Excel ![]() .
.
| Fil dato | Kilde | Investor | Type | Gennemsnitlig pris (Øst) |
Aktier | Δ Aktier (%) |
Rapporteret Værdi ($1000) |
Δ Værdi (%) |
Port Alloc (%) |
|
|---|---|---|---|---|---|---|---|---|---|---|
| 2026-02-13 | 13F | Victory Capital Management Inc | 232.256 | -2,62 | 16.040 | -3,33 | ||||
| 2026-02-17 | 13F | Hotchkis & Wiley Capital Management Llc | 176.322 | 0,00 | 12.177 | -0,73 | ||||
| 2026-02-17 | 13F | Bank Of America Corp /de/ | 85.054 | -58,94 | 5.874 | -59,24 | ||||
| 2026-04-09 | 13F | Beech Hill Advisors, Inc. | 39.429 | -5,94 | 2.558 | -11,64 | ||||
| 2026-02-13 | 13F | Lord, Abbett & Co. Llc | 51 | 6,38 | ||||||
| 2026-02-17 | 13F | Hbk Investments L P | 0 | -100,00 | 0 | |||||
| 2026-02-17 | 13F | Fortress Investment Group LLC | 0 | -100,00 | 0 | |||||
| 2026-02-05 | 13F | Plante Moran Financial Advisors, LLC | 125 | 9 | ||||||
| 2026-02-17 | 13F | Mpwm Advisory Solutions, Llc | 210 | 15 | ||||||
| 2026-02-17 | 13F | Westwood Holdings Group Inc | 184.550 | 0,00 | 12.745 | -0,73 | ||||
| 2026-02-17 | 13F | Ameriprise Financial Inc | 1.149.883 | 0,04 | 79.859 | 0,03 | ||||
| 2026-04-23 | 13F | Oppenheimer Asset Management Inc. | 3.427 | 222 | ||||||
| 2026-02-11 | 13F | Capital International Investors | 10.119.545 | 0,07 | 698.856 | -0,66 | ||||
| 2026-02-17 | 13F | Cnh Partners Llc | 5.250 | -97,94 | 365 | -97,94 | ||||
| 2025-11-14 | 13F | SRS Capital Advisors, Inc. | 0 | -100,00 | 0 | -100,00 | ||||
| 2026-02-13 | 13F | Morgan Stanley | 67.300 | -32,38 | 4.648 | -32,88 | ||||
| 2026-01-29 | 13F | Advisors Capital Management, LLC | 1.197.818 | 5,10 | 82.722 | 4,33 | ||||
| 2026-04-23 | 13F | Oppenheimer & Co Inc | 4.700 | 305 | ||||||
| 2026-01-22 | 13F | Massachusetts Financial Services Co /ma/ | 3.324.380 | -1,57 | 229.582 | -2,29 | ||||
| 2026-02-13 | 13F | Sculptor Capital LP | 0 | -100,00 | 0 | |||||
| 2026-02-17 | 13F | Tower Research Capital LLC (TRC) | 587 | 41 | ||||||
| 2026-04-09 | 13F | Sanders Morris Harris Llc | 47.083 | 3.055 | ||||||
| 2026-01-29 | 13F | UBS Group AG | 42.341 | 561,58 | 2.924 | 557,08 | ||||
| 2026-02-02 | 13F | Kornitzer Capital Management Inc /ks | 110.000 | 0,00 | 7.640 | -0,01 | ||||
| 2026-02-17 | 13F | DV Trading LLC | 1.000 | 69 | ||||||
| 2025-11-14 | 13F | BlueCrest Capital Management Ltd | 119.614 | 33,00 | 8.322 | 36,08 | ||||
| 2026-02-10 | 13F | Ssi Investment Management Llc | 528.435 | -0,56 | 36.700 | -0,58 | ||||
| 2026-02-12 | 13F | Principal Securities, Inc. | 0 | -100,00 | 0 | |||||
| 2025-11-10 | 13F | Greenland Capital Management LP | 0 | -100,00 | 0 | -100,00 | ||||
| 2026-02-13 | 13F | Context Capital Management, LLC | 0 | -100,00 | 0 | |||||
| 2026-02-17 | 13F | Fmr Llc | 6.957.567 | 37,67 | 483.203 | 37,65 | ||||
| 2026-02-13 | 13F | Manufacturers Life Insurance Company, The | 0 | -100,00 | 0 | |||||
| 2026-01-29 | 13F | Mackay Shields Llc | 830.097 | -1,41 | 57.663 | -1,51 | ||||
| 2026-02-17 | 13F | Lazard Asset Management Llc | 0 | |||||||
| 2026-02-13 | 13F | State Street Corp | 1.558.399 | -1,37 | 108.652 | -1,30 | ||||
| 2026-01-23 | 13F | Diversify Advisory Services, LLC | 17.994 | 6,97 | 1.403 | 26,62 | ||||
| 2026-01-20 | 13F | Stratos Wealth Partners, LTD. | 6.125 | 0,00 | 423 | -0,94 | ||||
| 2026-02-02 | 13F | Wolverine Asset Management Llc | 0 | -100,00 | 0 | -100,00 | ||||
| 2026-02-11 | 13F | Capital World Investors | 32.909.004 | 39,94 | 2.272.696 | 38,91 | ||||
| 2026-02-12 | 13F | Voya Investment Management Llc | 6.070.225 | -4,07 | 419.210 | -4,78 | ||||
| 2026-02-17 | 13F | Private Advisor Group, LLC | 9.171 | 0,80 | 633 | 0,16 | ||||
| 2026-02-13 | 13F | Virtus ETF Advisers LLC | 80 | 0,00 | ||||||
| 2026-02-17 | 13F | Blair William & Co/il | 562 | 0,00 | 39 | -2,56 | ||||
| 2026-02-05 | 13F | Gabelli Funds Llc | 66.065 | 0,00 | 4.562 | -1,02 | ||||
| 2026-01-29 | 13F | Calamos Wealth Management LLC | 15.896 | 9,43 | 1.098 | 8,61 | ||||
| 2026-02-12 | 13F | BlackRock, Inc. | 9.643.176 | -6,68 | 665.958 | -7,36 | ||||
| 2026-02-17 | 13F | First Manhattan Co | 10.535 | 0,00 | 735 | 0,41 | ||||
| 2026-02-11 | 13F | Parallel Advisors, LLC | 1.550 | 0,00 | 107 | 0,00 | ||||
| 2026-02-17 | 13F | Agf Management Ltd | 17.000 | -46,88 | 1.174 | -47,26 | ||||
| 2026-02-10 | 13F | Waterloo Capital, L.P. | 4.247 | -6,00 | 293 | -6,69 | ||||
| 2026-02-13 | 13F | Wells Fargo & Company/mn | 109.990 | -56,72 | 7.596 | -57,05 | ||||
| 2026-02-11 | 13F | Franklin Resources Inc | 9.177.400 | 2,65 | 633.791 | 1,20 | ||||
| 2026-02-17 | 13F | Millennium Management Llc | 203.939 | -42,30 | 14.187 | -42,39 | ||||
| 2026-02-13 | 13F | Warberg Asset Management LLC | 0 | -100,00 | 0 | |||||
| 2026-02-13 | 13F | Citigroup Inc | 81.757 | -73,60 | 5.646 | -73,79 | ||||
| 2026-01-23 | 13F | Portman Square Capital LLP | 102.000 | -92,17 | 7.092 | -92,17 | ||||
| 2026-02-10 | 13F | Skaana Management L.P. | 29.778 | 2.056 | ||||||
| 2026-04-24 | 13F | Palouse Capital Management, Inc. | 35.425 | -4,97 | 2.298 | -10,72 | ||||
| 2026-01-29 | 13F | Matisse Capital | 5.900 | 407 | ||||||
| 2026-02-12 | 13F | Laffer Investments | 51.280 | -0,34 | 3.562 | -0,64 | ||||
| 2026-02-13 | 13F | Barclays Plc | 441.084 | -38,50 | 30.461 | -38,95 | ||||
| 2026-01-29 | 13F | Calamos Advisors LLC | 3.109.660 | -9,20 | 214.753 | -9,86 | ||||
| 2026-02-17 | 13F | Water Island Capital Llc | 80.000 | 0,00 | 5.525 | -0,74 | ||||
| 2026-02-06 | 13F | Global Retirement Partners, LLC | 387 | 95,45 | 27 | 100,00 | ||||
| 2026-02-17 | 13F | D. E. Shaw & Co., Inc. | 458.654 | -86,58 | 31.892 | -86,60 | ||||
| 2026-02-13 | 13F | Nicholas Investment Partners, LP | 9.949 | -27,14 | ||||||
| 2026-02-17 | 13F | Wellington Management Group Llp | 306.816 | -29,60 | 21.161 | -29,56 | ||||
| 2026-02-10 | 13F | Goldman Sachs Group Inc | 21.019 | -59,84 | 1.452 | -60,15 | ||||
| 2026-01-26 | 13F | Kiley Juergens Wealth Management, Llc | 24.525 | 23,24 | 1.694 | 22,33 | ||||
| 2026-04-07 | 13F | Farther Finance Advisors, LLC | 163 | 239,58 | 11 | 233,33 | ||||
| 2026-02-13 | 13F | Neuberger Berman Group LLC | 108.149 | 0,46 | 7.469 | -0,28 | ||||
| 2026-02-12 | 13F | Loomis Sayles & Co L P | 272.318 | 0,52 | 59.126 | 1,12 | ||||
| 2026-02-17 | 13F | Susquehanna International Group, Llp | 0 | -100,00 | 0 | |||||
| 2026-04-15 | 13F | Sarver Vrooman Wealth Advisors | 0 | -100,00 | 0 | |||||
| 2026-02-12 | 13F | Federated Hermes, Inc. | 1.934 | -0,72 | ||||||
| 2026-02-13 | 13F | Macquarie Group Ltd | 0 | -100,00 | 0 | |||||
| 2026-04-07 | 13F | CoreCap Advisors, LLC | 0 | -100,00 | 0 | |||||
| 2026-02-02 | 13F | Fifth Third Bancorp | 1.969 | -9,51 | 136 | -10,60 | ||||
| 2026-02-11 | 13F | Clearbridge Investments, LLC | 654.908 | -6,28 | 45.228 | -6,97 | ||||
| 2026-02-17 | 13F | Prosperity Bancshares Inc | 52 | 4 | ||||||
| 2025-11-12 | 13F | American Century Companies Inc | 0 | -100,00 | 0 | -100,00 | ||||
| 2026-02-05 | 13F | Thrivent Financial For Lutherans | 51 | 11,11 | ||||||
| 2025-11-14 | 13F | Sandler Capital Management | 0 | -100,00 | 0 | -100,00 | ||||
| 2026-04-17 | 13F | Brown, Lisle/cummings, Inc. | 24 | 2 | ||||||
| 2026-02-17 | 13F | Point72 Asset Management, L.P. | 50.000 | -71,43 | 3.471 | -71,54 | ||||
| 2026-01-20 | 13F | Raab & Moskowitz Asset Management LLC | 6.859 | -3,35 | 474 | -4,06 | ||||
| 2026-02-12 | 13F | Hohimer Wealth Management, Llc | 0 | -100,00 | 0 | |||||
| 2026-02-14 | 13F | Rockefeller Capital Management L.P. | 27.354 | 39,01 | 1.889 | 38,08 | ||||
| 2026-02-13 | 13F | Healthcare Of Ontario Pension Plan Trust Fund | 0 | -100,00 | 0 | |||||
| 2026-02-17 | 13F | Raymond James Financial Inc | 34.494 | 58,48 | 2.382 | 57,33 | ||||
| 2026-02-17 | 13F | Angeles Wealth Management, Llc | 5.000 | 351 | ||||||
| 2026-02-17 | 13F | Infrastructure Capital Advisors, Llc | 413.311 | 31,05 | 28.543 | 39,83 | ||||
| 2026-02-11 | 13F | Capital Research Global Investors | 0 | -100,00 | 0 | |||||
| 2026-02-13 | 13F | Van Eck Associates Corp | 2.908.190 | 3,67 | 201 | 2,56 | ||||
| 2026-02-11 | 13F | LPL Financial LLC | 19.446 | 47,21 | 1.343 | 46,03 | ||||
| 2026-02-17 | 13F | Punch & Associates Investment Management, Inc. | 106.005 | -0,22 | 7.321 | -0,95 | ||||
| 2026-02-09 | 13F | Advent Capital Management /de/ | 849.161 | 3,59 | 59.038 | 4,69 | ||||
| 2026-02-13 | 13F | Financial Sense Advisors, Inc. | 149.066 | 10.294 | ||||||
| 2026-02-17 | 13F | Janus Henderson Group Plc | 0 | -100,00 | 0 | |||||
| 2026-02-05 | 13F | Gamco Investors, Inc. Et Al | 3.500 | 242 | ||||||
| 2026-02-05 | 13F | Northwestern Mutual Wealth Management Co | 435 | 521,43 | 42 | 925,00 | ||||
| 2026-02-17 | 13F | Wiley Bros.-aintree Capital, Llc | 4.254 | -1,21 | 291 | -2,68 | ||||
| 2026-02-17 | 13F | Two Sigma Investments, Lp | 0 | -100,00 | 0 | |||||
| 2026-02-17 | 13F | Delaware Management Holdings, Inc. | 54.274 | 3.773 | ||||||
| 2026-02-17 | 13F | King Street Capital Management, L.p. | 1.706.000 | 0,35 | 118.379 | -0,09 | ||||
| 2026-02-09 | 13F | Darden Wealth Group Inc | 4.900 | 0,00 | 338 | -0,59 | ||||
| 2026-02-17 | 13F | Aequim Alternative Investments LP | 1.600.000 | -11,11 | 111.296 | -11,12 | ||||
| 2026-02-09 | 13F | Jefferies Financial Group Inc. | 43.056 | 7,54 | 2.973 | 6,75 | ||||
| 2026-02-17 | 13F | Advisor Group Holdings, Inc. | 2.054 | 356,44 | 143 | 330,30 | ||||
| 2025-11-14 | 13F | Mount Yale Investment Advisors, LLC | 0 | -100,00 | 0 | -100,00 | ||||
| 2026-04-13 | 13F | IFP Advisors, Inc | 1.484 | 127,96 | 96 | 118,18 | ||||
| 2026-02-11 | 13F | Compass Rose Asset Management, LP | 22.624 | 1.562 | ||||||
| 2026-02-17 | 13F | Kelly Lawrence W & Associates Inc/ca | 4.800 | 0,00 | 333 | 0,00 | ||||
| 2026-02-13 | 13F | Banco Santander, S.A. | 6.203 | 0,00 | 428 | -0,70 | ||||
| 2026-02-17 | 13F | Cetera Investment Advisers | 12.573 | 4,31 | 868 | 3,58 | ||||
| 2026-02-11 | 13F | Jpmorgan Chase & Co | 20.883 | -84,10 | 1.442 | -84,22 | ||||
| 2026-02-12 | 13F | Steward Partners Investment Advisory, Llc | 12.011 | 21,61 | 829 | 20,67 | ||||
| 2026-02-17 | 13F | Palisade Capital Management Llc/nj | 79.342 | -3,24 | 5.520 | -3,40 | ||||
| 2026-02-12 | 13F | Bank Of Montreal /can/ | 1.095.620 | 124,93 | 75.664 | 123,28 | ||||
| 2026-02-17 | 13F | Susquehanna Advisors Group, Inc. | 0 | -100,00 | 0 | |||||
| 2026-02-12 | 13F | Rossby Financial, LCC | 206 | -82,36 | 14 | -82,50 | ||||
| 2026-02-17 | 13F | Magnetar Financial LLC | 0 | -100,00 | 0 | |||||
| 2026-02-19 | 13F | Invesco Ltd. | 461.318 | -10,14 | 31.859 | -10,79 | ||||
| 2026-02-17 | 13F | Royal Bank Of Canada | 867 | 262,76 | ||||||
| 2026-02-13 | 13F | Jones Road Capital Management, L.p. | 52.700 | 39,79 | 3.639 | 38,79 | ||||
| 2026-02-17 | 13F | Shaolin Capital Management LLC | 0 | -100,00 | 0 | -100,00 | ||||
| 2026-02-13 | 13F | Stifel Financial Corp | 16.678 | 1.152 | ||||||
| 2026-04-13 | 13F | Bourgeon Capital Management Llc | 153.874 | 2,57 | 9.983 | -3,64 | ||||
| 2026-04-22 | 13F | Spire Wealth Management | 575 | 0,00 | 37 | -5,13 | ||||
| 2026-04-23 | 13F | Lazari Capital Management, Inc. | 28.875 | -6,17 | 1.873 | -11,86 | ||||
| 2026-02-06 | 13F | Kimelman & Baird, LLC | 300 | 0,00 | 21 | 0,00 | ||||
| 2026-02-17 | 13F | MIRAE ASSET GLOBAL ETFS HOLDINGS Ltd. | 1.531.145 | 0,39 | 105.741 | -0,35 | ||||
| 2026-02-11 | 13F | Financiere des Professionnels - Fonds d,investissement inc. | 61.598 | 0,00 | 4.254 | -0,75 | ||||
| 2025-11-07 | 13F | HighTower Advisors, LLC | 0 | -100,00 | 0 | |||||
| 2026-02-17 | 13F | Citadel Advisors Llc | 47.553 | 626,55 | 3.284 | 621,76 | ||||
| 2026-04-14 | 13F | Nbc Securities, Inc. | 0 | -100,00 | 0 | |||||
| 2026-02-17 | 13F | Summit Trail Advisors, Llc | 3.500 | 7,69 | 244 | 7,96 | ||||
| 2026-02-13 | 13F | Sei Investments Co | 20.878 | 1,27 | 1.424 | -0,77 | ||||
| 2026-02-13 | 13F | MAI Capital Management | 36 | 2 | ||||||
| 2026-04-07 | 13F | Central Pacific Bank - Trust Division | 24.125 | -16,10 | 1.565 | -21,16 | ||||
| 2026-02-04 | 13F | Oxbow Advisors, LLC | 226.779 | 2,14 | 15.661 | 1,39 | ||||
| 2026-02-05 | 13F | Td Private Client Wealth Llc | 36 | 0,00 | 2 | 0,00 | ||||
| 2026-02-11 | 13F | Capital International Sarl | 49.097 | 34,52 | 3.391 | 33,52 | ||||
| 2026-01-30 | 13F | Jennison Associates Llc | 50.000 | 0,00 | 3.453 | -0,72 | ||||
| 2026-02-12 | 13F | Jane Street Group, Llc | 53.191 | -32,05 | 3.673 | -32,56 | ||||
| 2026-04-21 | 13F | BCS Private Wealth Management, Inc. | 0 | -100,00 | 0 | |||||
| 2026-02-10 | 13F | Envestnet Asset Management Inc | 44.517 | 4,11 | 3.074 | 3,36 | ||||
| 2026-01-30 | 13F | Us Bancorp \de\ | 50 | 0,00 | 3 | 0,00 | ||||
| 2026-01-26 | 13F | Private Trust Co Na | 1.576 | 0,00 | 109 | -0,92 | ||||
| 2026-04-16 | 13F | Asset Advisors Investment Management, LLC | 6.900 | 0,00 | 448 | -6,09 | ||||
| 2026-02-13 | 13F | Colony Group, LLC | 83.047 | -1,66 | 5.735 | -2,37 | ||||
| 2026-02-17 | 13F | Modern Wealth Management, LLC | 10.215 | 0,00 | 705 | -0,70 | ||||
| 2026-01-22 | 13F | Bear Mountain Capital, Inc. | 25 | 13,64 | 2 | 0,00 | ||||
| 2026-04-08 | 13F | Wealth Enhancement Advisory Services, Llc | 36.009 | 2.397 | ||||||
| 2026-02-11 | 13F | Capital International Inc /ca/ | 273.024 | 58,26 | 18.855 | 57,10 | ||||
| 2026-02-17 | 13F/A | Uniplan Investment Counsel, Inc. | 69.169 | -0,95 | 4.777 | -1,69 | ||||
| 2026-02-12 | 13F | Nuveen, LLC | 327.910 | -0,76 | 22.645 | -1,49 | ||||
| 2026-01-29 | 13F | Comerica Bank | 573 | 21,91 | 40 | 21,88 | ||||
| 2026-02-17 | 13F | Price T Rowe Associates Inc /md/ | 167 | 0,61 |