Grundlæggende statistik
| Institutionelle ejere | 147 total, 147 long only, 0 short only, 0 long/short - change of 5,71% MRQ |
| Gennemsnitlig porteføljeallokering | 0.6255 % - change of -9,98% MRQ |
| Institutionelle aktier (lange) | 12.266.576 (ex 13D/G) - change of 0,07MM shares 0,56% MRQ |
| Institutionel værdi (lang) | $ 522.471 USD ($1000) |
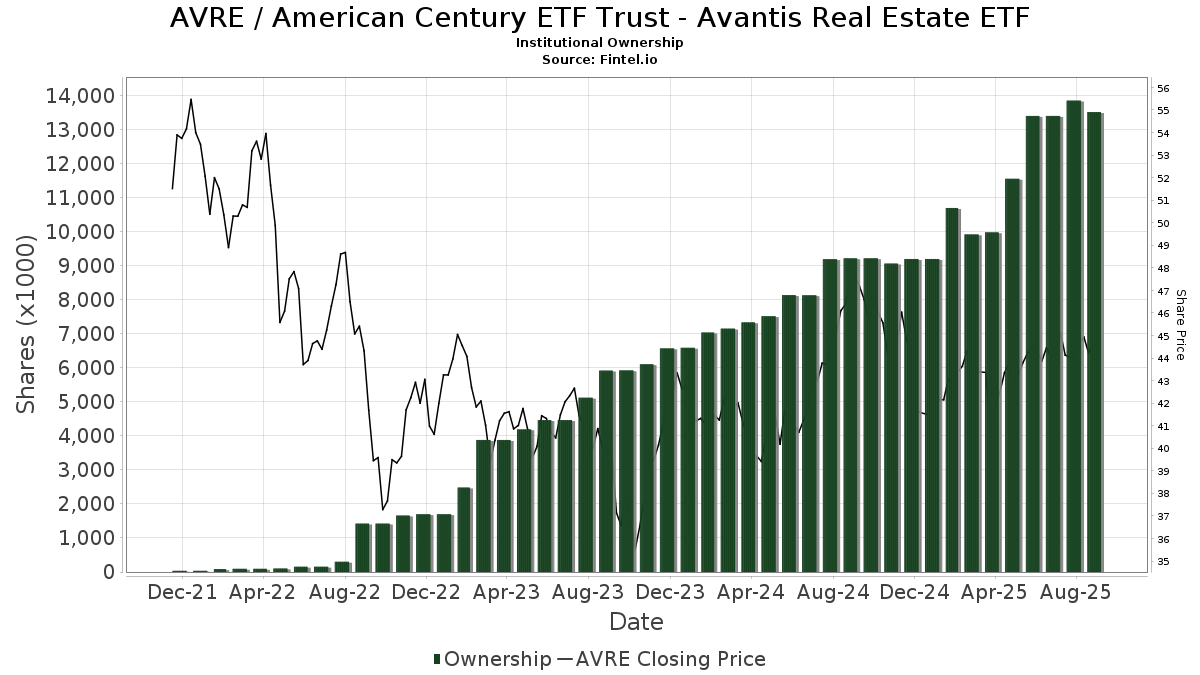
Institutionelt ejerskab og aktionærer
American Century ETF Trust - Avantis Real Estate ETF (US:AVRE) har 147 institutionelle ejere og aktionærer, der har indsendt 13D/G- eller 13F-formularer til Securities Exchange Commission (SEC). Disse institutioner har i alt 12,266,576 aktier. Største aktionærer omfatter Empowered Funds, LLC, Financial Plan, Inc., American Century Companies Inc, Hill Investment Group Partners, LLC, Quantum Financial Advisors, LLC, Nicolet Advisory Services, Llc, ShankerValleau Wealth Advisors, Inc., Sequoia Financial Advisors, LLC, BetterWealth, LLC, and Capstone Financial Advisors, Inc. .
American Century ETF Trust - Avantis Real Estate ETF (ARCA:AVRE) institutionel ejerskabsstruktur viser aktuelle positioner i virksomheden efter institutioner og fonde, samt seneste ændringer i positionsstørrelse. Større aktionærer kan omfatte individuelle investorer, investeringsforeninger, hedgefonde eller institutioner. Skema 13D angiver, at investoren besidder (eller besidder) mere end 5 % af virksomheden og har til hensigt (eller har til hensigt at) aktivt at forfølge en ændring i forretningsstrategi. Skema 13G indikerer en passiv investering på over 5%.
The share price as of February 27, 2026 is 47,56 / share. Previously, on March 3, 2025, the share price was 44,23 / share. This represents an increase of 7,52% over that period.
Fondens stemningsscore
Fund Sentiment Score (fka Ownership Accumulation Score) finder de aktier, der bliver mest købt af fonde. Det er resultatet af en sofistikeret, multi-faktor kvantitativ model, der identificerer virksomheder med de højeste niveauer af institutionel akkumulering. Scoringsmodellen bruger en kombination af den samlede stigning i oplyste ejere, ændringerne i porteføljeallokeringer i disse ejere og andre målinger. Tallet går fra 0 til 100, hvor højere tal indikerer et højere niveau af akkumulering for sine jævnaldrende, og 50 er gennemsnittet.
Opdateringsfrekvens: Dagligt
Se Ownership Explorer, som giver en liste over højest rangerende virksomheder.
AI+ Ask Fintel’s AI assistant about American Century ETF Trust - Avantis Real Estate ETF.
Select a question to share a public post with an AI-crafted answer.
Thinking of good questions…
Institutionel Put/Call-forhold
Ud over at indberette standardaktie- og gældsudstedelser skal institutter med mere end 100 mill. aktiver under forvaltning også oplyse deres put- og call-optionsbeholdninger. Da salgsoptioner generelt indikerer negativ stemning, og købsoptioner indikerer positiv stemning, kan vi få en fornemmelse af den overordnede institutionelle stemning ved at plotte forholdet mellem put og kald. Diagrammet til højre viser det historiske put/call-forhold for dette instrument.
Brug af Put/Call Ratio som en indikator for investorernes stemning overvinder en af de vigtigste mangler ved at bruge totalt institutionelt ejerskab, som er, at en betydelig mængde af aktiver under forvaltning investeres passivt for at spore indekser. Passivt forvaltede fonde køber typisk ikke optioner, så indikatoren for put/call-forholdet følger mere nøje følelsen af aktivt forvaltede fonde.
13F og NPORT arkivering
Detaljer om 13F-arkivering er gratis. Detaljer om NP-ansøgninger kræver et premium-medlemskab. Grønne rækker angiver nye positioner. Røde rækker angiver lukkede positioner. Klik på linket ikon for at se den fulde transaktionshistorik.
Opgrader
for at låse premium-data op og eksportere til Excel ![]() .
.
| Fil dato | Kilde | Investor | Type | Gennemsnitlig pris (Øst) |
Aktier | Δ Aktier (%) |
Rapporteret Værdi ($1000) |
Δ Værdi (%) |
Port Alloc (%) |
|
|---|---|---|---|---|---|---|---|---|---|---|
| 2026-02-10 | 13F | Evolution Wealth Management Inc. | 278 | 434,62 | 12 | 500,00 | ||||
| 2025-12-02 | 13F | IFP Advisors, Inc | 1 | 0,00 | 0 | |||||
| 2026-01-26 | 13F | Austin Wealth Management, LLC | 136.880 | 5,17 | 6.021 | 2,54 | ||||
| 2026-01-28 | 13F | N.E.W. Advisory Services LLC | 23 | 0,00 | 1 | 0,00 | ||||
| 2026-01-22 | 13F | Fmb Wealth Management | 7.202 | 24,17 | 314 | 21,79 | ||||
| 2026-02-10 | 13F | Cherry Tree Wealth Management, LLC | 527 | 0,00 | 23 | -4,35 | ||||
| 2026-02-13 | 13F | Aptus Capital Advisors, LLC | 48 | -74,47 | 2 | -75,00 | ||||
| 2026-02-12 | 13F | Haven Private, LLC | 22.165 | 4,23 | 965 | 2,01 | ||||
| 2026-02-09 | 13F | Rhl Group, Llc | 485 | 21 | ||||||
| 2026-01-29 | 13F | Equita Financial Network, Inc. | 208.603 | 10,79 | 9.080 | 8,43 | ||||
| 2026-02-09 | 13F | Diversified Portfolios, Inc. | 16.428 | -15,66 | 715 | -17,44 | ||||
| 2025-11-12 | 13F | Willow Creek Wealth Management Inc. | 7.345 | 6,60 | 327 | 7,24 | ||||
| 2025-11-06 | 13F | LexAurum Advisors, LLC | 221.538 | 10,97 | 9.854 | 11,79 | ||||
| 2026-01-30 | 13F | Torren Management, LLC | 4.186 | 182 | ||||||
| 2026-02-10 | 13F | Savant Capital, LLC | 22.164 | 6,11 | 965 | 3,77 | ||||
| 2026-02-13 | 13F | Kestra Advisory Services, LLC | 6.209 | 270 | ||||||
| 2026-02-17 | 13F | Cardiff Park Advisors, Llc | 51.204 | -0,42 | 2.229 | -2,58 | ||||
| 2026-01-26 | 13F | WorthPointe, LLC | 228.326 | -2,56 | 9.939 | -4,63 | ||||
| 2026-02-05 | 13F | PCG Wealth Advisors, LLC | 35.991 | 6,62 | 1.567 | 4,33 | ||||
| 2026-02-17 | 13F | Citadel Advisors Llc | 109.769 | -15,61 | 4.778 | -17,41 | ||||
| 2026-01-21 | 13F | SC&H Financial Advisors, Inc. | 29.338 | 2,17 | 1.277 | 0,00 | ||||
| 2026-02-13 | 13F | Seaside Wealth Management, Inc. | 265.645 | 12,20 | 11.564 | 9,80 | ||||
| 2026-02-17 | 13F | Hill Investment Group Partners, LLC | 442.417 | -40,33 | 19.258 | -41,61 | ||||
| 2026-02-02 | 13F | TCI Wealth Advisors, Inc. | 19.422 | 0,02 | 845 | -2,09 | ||||
| 2026-02-13 | 13F | Garrison Point Advisors, Llc | 7.942 | 3,63 | 346 | 1,47 | ||||
| 2026-02-09 | 13F | Flagstone Financial Management | 28.087 | 5,44 | 1.223 | 3,21 | ||||
| 2026-02-10 | 13F | Envestnet Asset Management Inc | 230.473 | 9,59 | 10.032 | 7,25 | ||||
| 2025-11-14 | 13F | Susquehanna International Group, Llp | 0 | -100,00 | 0 | |||||
| 2026-01-14 | 13F | Wealthcare Advisory Partners LLC | 77.517 | 5,26 | 3.374 | 3,02 | ||||
| 2026-02-10 | 13F | Hazlett, Burt & Watson, Inc. | 17 | 6,25 | 0 | |||||
| 2026-02-11 | 13F | Curio Wealth, Llc | 5.903 | 6,36 | 258 | 4,88 | ||||
| 2025-11-12 | 13F | Park Square Financial Group, LLC | 0 | -100,00 | 0 | |||||
| 2026-02-12 | 13F | Burk Holdings LLC | 64.385 | 2,62 | 2.803 | 0,43 | ||||
| 2026-02-02 | 13F | HTG Investment Advisors, Inc. | 90.972 | 20,72 | 3.960 | 18,17 | ||||
| 2026-02-17 | 13F | Aqr Capital Management Llc | 33.766 | 0,99 | 1.470 | -1,21 | ||||
| 2026-01-23 | 13F | Farther Finance Advisors, LLC | 2.013 | 749,37 | 88 | 770,00 | ||||
| 2026-02-13 | 13F | Nicolet Advisory Services, Llc | 388.797 | -18,77 | 17.127 | -18,84 | ||||
| 2026-02-12 | 13F | Commonwealth Equity Services, Llc | 45.124 | 5,59 | 1.964 | 196.300,00 | ||||
| 2026-02-13 | 13F | Resources Investment Advisors, LLC. | 84.852 | -4,23 | 3.694 | -6,29 | ||||
| 2026-02-13 | 13F | Three Arch Wealth Management LLC | 233.487 | 10.164 | ||||||
| 2026-01-30 | 13F | Valued Wealth Advisors LLC | 93.514 | 5,81 | 4.071 | 3,56 | ||||
| 2026-02-05 | 13F | HFM Investment Advisors, LLC | 66 | -4,35 | 3 | -33,33 | ||||
| 2026-02-04 | 13F | Nwam Llc | 5.385 | 7,64 | 234 | 5,41 | ||||
| 2026-02-13 | 13F | Mml Investors Services, Llc | 71.412 | 15,03 | 3.109 | 12,57 | ||||
| 2026-01-06 | 13F | Collective Family Office Llc | 107.597 | 4,14 | 4.684 | 1,92 | ||||
| 2026-01-30 | 13F | Simplicity Wealth,LLC | 111.741 | 5,93 | 4.864 | 3,69 | ||||
| 2026-01-13 | 13F | CoreCap Advisors, LLC | 23.976 | 27,07 | 1.044 | 24,31 | ||||
| 2026-01-07 | 13F | Henrickson Nauta Wealth Advisors, Inc. | 24.774 | 68,85 | 1.086 | 66,56 | ||||
| 2026-02-06 | 13F | Global Retirement Partners, LLC | 16 | 0,00 | 1 | |||||
| 2026-02-13 | 13F | Morgan Stanley | 1.258 | 91,77 | 55 | 86,21 | ||||
| 2026-02-09 | 13F | Nicolet Bankshares Inc | 190.247 | 3,01 | 8.281 | 0,80 | ||||
| 2026-02-11 | 13F | LPL Financial LLC | 257.798 | 18,31 | 11.222 | 15,78 | ||||
| 2026-01-21 | 13F | Leading Edge Financial Planning LLC | 193.932 | 28,03 | 8.442 | 25,29 | ||||
| 2026-02-13 | 13F | North Ridge Wealth Advisors, Inc. | 0 | -100,00 | 0 | |||||
| 2026-01-29 | 13F | Aprio Wealth Management, LLC | 61.257 | -0,43 | 2.667 | -2,56 | ||||
| 2026-02-11 | 13F | Pfc Capital Group, Inc. | 500 | 0,00 | 0 | |||||
| 2026-01-27 | 13F | Forum Financial Management, LP | 31.263 | -12,96 | 1.361 | -14,84 | ||||
| 2026-02-11 | 13F | Buckingham Strategic Partners | 37.016 | -94,17 | 1.611 | -94,29 | ||||
| 2026-01-23 | 13F | Creative Capital Management Investments LLC | 565 | 0,00 | 25 | -4,00 | ||||
| 2026-02-18 | 13F | Beacon Pointe Advisors, LLC | 45.588 | -1,16 | 1.984 | -3,27 | ||||
| 2026-01-28 | 13F | Financial Plan, Inc. | 600.852 | 26.155 | ||||||
| 2026-02-13 | 13F | Ariadne Wealth Management, LP | 9.433 | 13,21 | 440 | 20,55 | ||||
| 2026-02-13 | 13F | Entrewealth, Llc | 32.930 | 13,48 | 1.497 | 16,05 | ||||
| 2026-02-11 | 13F | Empowered Funds, LLC | 1.149.737 | 50.048 | ||||||
| 2026-02-10 | 13F | W.H. Cornerstone Investments Inc. | 0 | -100,00 | 0 | |||||
| 2026-01-08 | 13F | Bayshore Asset Management, Llc | 24.297 | 2,54 | 1.058 | 0,38 | ||||
| 2026-02-23 | 13F | Beaird Harris Wealth Management, LLC | 71.891 | -2,85 | 3.129 | -4,92 | ||||
| 2026-01-29 | 13F | UBS Group AG | 0 | -100,00 | 0 | |||||
| 2026-01-15 | 13F | BetterWealth, LLC | 331.488 | 4,69 | 14.430 | 2,45 | ||||
| 2026-01-21 | 13F | Apella Capital, LLC | 28.162 | 1,90 | 1.226 | -0,33 | ||||
| 2026-02-10 | 13F | Arcadia Wealth Management, Inc. | 60.082 | 10,19 | 2.615 | 7,84 | ||||
| 2026-01-30 | 13F | SOL Capital Management CO | 36.647 | -9,27 | 2 | 0,00 | ||||
| 2026-02-13 | 13F | B&D White Capital Company, LLC | 35.117 | 111,88 | 1.529 | 107,33 | ||||
| 2026-02-06 | 13F | Axxcess Wealth Management, Llc | 97.710 | 302,02 | 4.253 | 293,43 | ||||
| 2026-02-19 | 13F | CI Private Wealth, LLC | 170.079 | 5,02 | 7.404 | 2,78 | ||||
| 2026-02-13 | 13F | Satovsky Asset Management Llc | 22.140 | 1,10 | 964 | -1,13 | ||||
| 2026-01-15 | 13F | Avant Financial Advisors LLC | 15.636 | 3,94 | 681 | 1,64 | ||||
| 2026-02-06 | 13F | Tortoise Investment Management, LLC | 0 | -100,00 | 0 | |||||
| 2026-01-28 | 13F | Morton Brown Family Wealth, LLC | 9.756 | -0,50 | 425 | -2,75 | ||||
| 2026-01-26 | 13F | Quarry Hill Advisors, Llc | 144.465 | 11,34 | 6.289 | 8,96 | ||||
| 2026-02-09 | 13F | Morris Financial Concepts, Inc. | 859 | 0,00 | 37 | -2,63 | ||||
| 2026-02-11 | 13F | Endeavor Private Wealth, Inc. | 12.383 | 9,25 | 539 | 6,94 | ||||
| 2026-02-17 | 13F | Quantinno Capital Management LP | 11.697 | 17,82 | 509 | 15,42 | ||||
| 2026-01-16 | 13F | Ronald Blue Trust, Inc. | 1.291 | 0,00 | 56 | -1,75 | ||||
| 2026-02-10 | 13F | Cogent Private Wealth, Inc. | 16.057 | 699 | ||||||
| 2026-01-16 | 13F | Abacus Planning Group, Inc. | 5.727 | 1,20 | 249 | -0,80 | ||||
| 2026-01-30 | 13F | Strategic Blueprint, LLC | 136.657 | -1,90 | 5.949 | -4,00 | ||||
| 2026-02-17 | 13F | Royal Bank Of Canada | 362 | 16 | ||||||
| 2026-01-05 | 13F | Park Avenue Securities Llc | 113.430 | 12,22 | 5 | 0,00 | ||||
| 2026-02-06 | 13F | Lloyd Advisory Services, LLC. | 2.091 | 91 | ||||||
| 2026-02-10 | 13F | REAP Financial Group, LLC | 208 | 0,00 | 9 | 0,00 | ||||
| 2026-01-28 | 13F | WMG Financial Advisors, LLC | 78.759 | -5,06 | 3.428 | -7,08 | ||||
| 2026-01-21 | 13F | Signature Resources Capital Management, LLC | 6 | 0,00 | 0 | |||||
| 2026-01-26 | 13F | Prairiewood Capital, LLC | 285.537 | 11,26 | 12.429 | 8,89 | ||||
| 2026-01-26 | 13F | Pacific Life Fund Advisors LLC | 35.130 | -1,36 | 1.529 | -3,47 | ||||
| 2026-02-03 | 13F | Allegiance Financial Group Advisory Services LLC | 309.501 | 8,68 | 13.473 | 6,36 | ||||
| 2026-01-23 | 13F | Lam Group, Inc. | 103.370 | 2,54 | 4.500 | 0,33 | ||||
| 2026-01-26 | 13F | DBK Financial Counsel, LLC | 52.381 | -1,94 | 2.280 | -4,04 | ||||
| 2026-01-14 | 13F | BWM Planning, LLC | 8.367 | 0,00 | 364 | -2,15 | ||||
| 2026-02-10 | 13F/A | Northwestern Mutual Wealth Management Co | 14.973 | 2,77 | 652 | 0,46 | ||||
| 2026-01-16 | 13F | Red Lighthouse Investment Management, Llc | 56.090 | -9,85 | 2.442 | -11,78 | ||||
| 2026-01-22 | 13F | Networth Advisors, LLC | 65.504 | 2.851 | ||||||
| 2026-02-17 | 13F | GeoWealth Management, LLC | 26.038 | 10,60 | 1.133 | 8,21 | ||||
| 2026-02-06 | 13F | Magnolia Private Wealth, LLC | 6.571 | -40,00 | 286 | -41,27 | ||||
| 2026-02-17 | 13F | Bank Of America Corp /de/ | 0 | -100,00 | 0 | |||||
| 2026-01-27 | 13F | BLVD Private Wealth, LLC | 42.448 | -1,39 | 1.848 | -3,50 | ||||
| 2026-02-09 | 13F | Clune & Associates, Ltd. | 6.161 | 2,43 | 268 | 0,37 | ||||
| 2026-02-13 | 13F | Colony Group, LLC | 279.529 | -15,84 | 12.168 | -17,63 | ||||
| 2026-02-17 | 13F | Jones Financial Companies Lllp | 1.872 | 1,57 | 81 | 0,00 | ||||
| 2026-01-26 | 13F | AE Wealth Management LLC | 40.119 | 40,99 | 1.746 | 38,02 | ||||
| 2026-01-28 | 13F | Chicago Partners Investment Group LLC | 94.388 | -0,75 | 4.193 | -1,34 | ||||
| 2026-02-13 | 13F | Mariner, LLC | 13.742 | 1,77 | 598 | -0,33 | ||||
| 2026-02-17 | 13F | Capstone Financial Advisors, Inc. | 317.407 | 4,30 | 13.817 | 2,07 | ||||
| 2026-02-12 | 13F | Jane Street Group, Llc | 23.338 | -70,15 | 1.016 | -70,81 | ||||
| 2026-02-17 | 13F | Wheels Up Wealth, Inc. | 4.937 | 215 | ||||||
| 2026-01-26 | 13F | Level Financial Advisors, Inc. | 173.215 | 5,57 | 7.540 | 3,33 | ||||
| 2026-01-08 | 13F | Sentinel Wealth Management, Inc. | 119.282 | 19,41 | 5.192 | 16,86 | ||||
| 2026-02-17 | 13F | Advisor Group Holdings, Inc. | 13.345 | -47,45 | 581 | -49,21 | ||||
| 2026-02-13 | 13F | Wells Fargo & Company/mn | 451 | 65,81 | 20 | 58,33 | ||||
| 2026-02-13 | 13F | American Century Companies Inc | 470.145 | 26,18 | 20.465 | 23,48 | ||||
| 2025-11-12 | 13F | Armis Advisers, LLC | 0 | -100,00 | 0 | |||||
| 2026-01-23 | 13F | Fifth Third Securities, Inc. | 15.725 | 21,41 | 685 | 18,75 | ||||
| 2026-01-12 | 13F | Physician Wealth Solutions Inc. | 292.005 | -1,41 | 12.711 | -3,52 | ||||
| 2026-01-26 | 13F | Cwm, Llc | 129.268 | -29,08 | 6 | -37,50 | ||||
| 2026-02-05 | 13F | Allworth Financial LP | 0 | 0 | ||||||
| 2025-11-14 | 13F | Strategic Wealth Partners, Ltd. | 1.973 | 88 | ||||||
| 2026-02-05 | 13F | Avantax Planning Partners, Inc. | 6.235 | 19,97 | 271 | 17,32 | ||||
| 2026-01-28 | 13F | Global Trust Wealth Management LLC | 6.080 | 265 | ||||||
| 2026-02-13 | 13F | marrick wealth, LLC | 50.686 | 2.206 | ||||||
| 2026-02-10 | 13F | MB Generational Wealth, LLC | 20.740 | -0,33 | 903 | -2,49 | ||||
| 2026-01-06 | 13F | ShankerValleau Wealth Advisors, Inc. | 384.059 | 7,20 | 16.718 | 4,91 | ||||
| 2026-02-11 | 13F | Jpmorgan Chase & Co | 1.366 | 190,02 | 59 | 195,00 | ||||
| 2026-01-23 | 13F | Vestment Financial LLC | 152.563 | 10,15 | 6.711 | 9,10 | ||||
| 2026-01-09 | 13F | Keb Asset Management, Llc | 11.319 | 4,90 | 493 | 2,71 | ||||
| 2026-01-27 | 13F | Werba Rubin Papier Wealth Management | 0 | -100,00 | 0 | |||||
| 2026-02-04 | 13F | Dogwood Wealth Management LLC | 141 | 0,00 | 6 | 0,00 | ||||
| 2026-02-12 | 13F | Financial Engines Advisors L.L.C. | 14.497 | -9,88 | 631 | -11,75 | ||||
| 2026-02-06 | 13F | Kingdom Financial Group LLC. | 319 | 14 | ||||||
| 2026-02-02 | 13F | Cypress Point Wealth Management, LLC | 0 | -100,00 | 0 | |||||
| 2025-11-14 | 13F | Flow Traders U.s. Llc | 0 | -100,00 | 0 | |||||
| 2026-01-28 | 13F | Edge Financial Advisors LLC | 9.191 | 400 | ||||||
| 2026-01-30 | 13F | Ares Financial Consulting, LLC | 6.385 | 278 | ||||||
| 2026-01-16 | 13F | Life Planning Partners, Inc | 35.433 | 11,99 | 1.542 | 9,59 | ||||
| 2026-01-20 | 13F | Signaturefd, Llc | 1 | 0 | ||||||
| 2026-01-08 | 13F | Sprinkle Financial Consultants LLC | 38.269 | 7,20 | 1.666 | 4,91 | ||||
| 2026-02-12 | 13F | Empire Financial Management Company, LLC | 26.047 | 1.134 | ||||||
| 2026-01-12 | 13F | Evanson Asset Management, LLC | 5.875 | 0,86 | 256 | -1,54 | ||||
| 2026-02-03 | 13F | Sequoia Financial Advisors, LLC | 367.012 | 54,37 | 15.976 | 51,07 | ||||
| 2026-02-11 | 13F | O'shaughnessy Asset Management, Llc | 491 | 21 | ||||||
| 2026-02-09 | 13F | Parkshore Wealth Management, Inc. | 27.220 | -29,45 | 1.185 | -31,00 | ||||
| 2026-01-22 | 13F | Jackson Thornton Asset Management, Llc | 5.985 | 0,00 | 262 | 0,00 | ||||
| 2026-02-06 | 13F | Larson Financial Group LLC | 45 | -8,16 | 2 | -50,00 | ||||
| 2026-01-12 | 13F | Quantum Financial Advisors, LLC | 409.559 | 6,38 | 17.828 | 4,11 | ||||
| 2026-01-26 | 13F | Invariant Investment Management | 7.472 | 329 | ||||||
| 2026-02-09 | 13F | Harbour Investments, Inc. | 22 | 0,00 | 1 | |||||
| 2026-02-17 | 13F | Mercer Global Advisors Inc /adv | 27.229 | -19,75 | 1.185 | -21,47 | ||||
| 2026-02-17 | 13F | Creative Planning | 27.395 | -0,35 | 1.192 | -2,45 | ||||
| 2026-01-21 | 13F | SJS Investment Consulting Inc. | 432 | 0,00 | 19 | -5,26 | ||||
| 2026-02-09 | 13F | Poinciana Advisors Group, Llc | 14.313 | 0,00 | 623 | -2,04 |