Grundlæggende statistik
| Institutionelle aktier (lange) | 106.324.008 - 97,58% (ex 13D/G) - change of -21,32MM shares -16,70% MRQ |
| Institutionel værdi (lang) | $ 1.456.589 USD ($1000) |
Institutionelt ejerskab og aktionærer
Arlo Technologies, Inc. (US:ARLO) har 264 institutionelle ejere og aktionærer, der har indsendt 13D/G- eller 13F-formularer til Securities Exchange Commission (SEC). Disse institutioner har i alt 106,324,008 aktier. Største aktionærer omfatter BlackRock, Inc., Vanguard Group Inc, Brandes Investment Partners, Lp, Wasatch Advisors Inc, State Street Corp, Rice Hall James & Associates, Llc, Primecap Management Co/ca/, Geode Capital Management, Llc, Renaissance Technologies Llc, and Marshall Wace, Llp .
Arlo Technologies, Inc. (NYSE:ARLO) institutionel ejerskabsstruktur viser aktuelle positioner i virksomheden efter institutioner og fonde, samt seneste ændringer i positionsstørrelse. Større aktionærer kan omfatte individuelle investorer, investeringsforeninger, hedgefonde eller institutioner. Skema 13D angiver, at investoren besidder (eller besidder) mere end 5 % af virksomheden og har til hensigt (eller har til hensigt at) aktivt at forfølge en ændring i forretningsstrategi. Skema 13G indikerer en passiv investering på over 5%.
The share price as of May 1, 2026 is 14,61 / share. Previously, on May 5, 2025, the share price was 10,25 / share. This represents an increase of 42,54% over that period.

Fondens stemningsscore
Fund Sentiment Score (fka Ownership Accumulation Score) finder de aktier, der bliver mest købt af fonde. Det er resultatet af en sofistikeret, multi-faktor kvantitativ model, der identificerer virksomheder med de højeste niveauer af institutionel akkumulering. Scoringsmodellen bruger en kombination af den samlede stigning i oplyste ejere, ændringerne i porteføljeallokeringer i disse ejere og andre målinger. Tallet går fra 0 til 100, hvor højere tal indikerer et højere niveau af akkumulering for sine jævnaldrende, og 50 er gennemsnittet.
Opdateringsfrekvens: Dagligt
Se Ownership Explorer, som giver en liste over højest rangerende virksomheder.
AI+ Ask Fintel’s AI assistant about Arlo Technologies, Inc..
Select a question to share a public post with an AI-crafted answer.
Thinking of good questions…
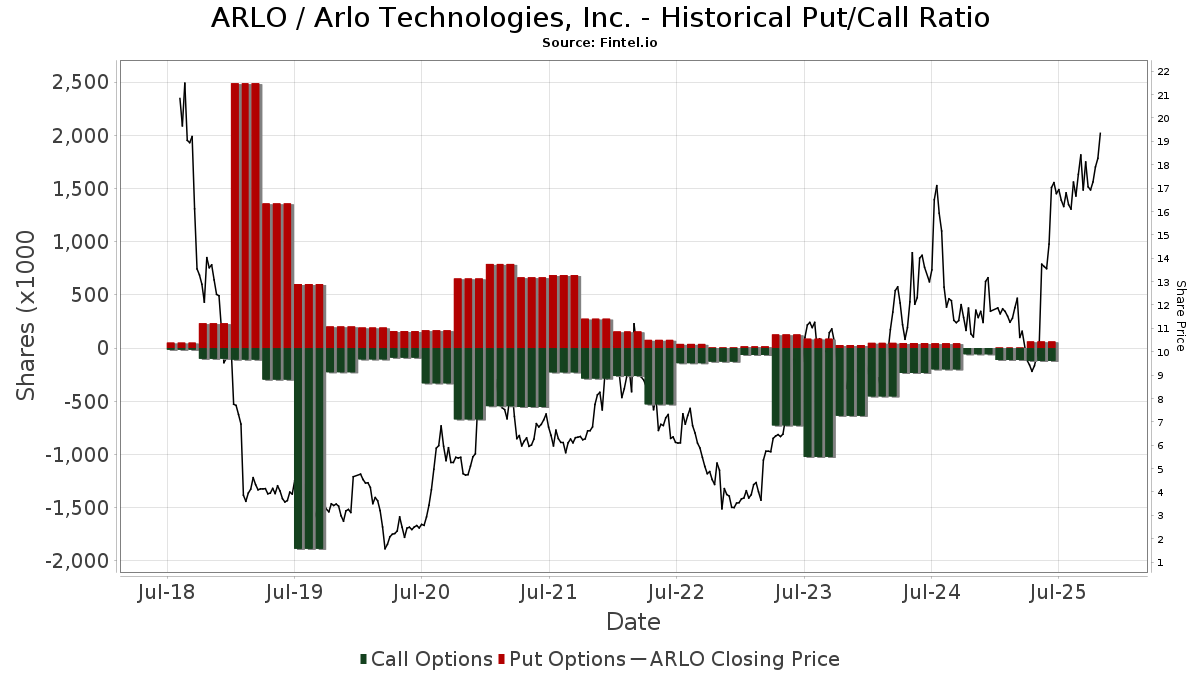
Institutionel Put/Call-forhold
Ud over at indberette standardaktie- og gældsudstedelser skal institutter med mere end 100 mill. aktiver under forvaltning også oplyse deres put- og call-optionsbeholdninger. Da salgsoptioner generelt indikerer negativ stemning, og købsoptioner indikerer positiv stemning, kan vi få en fornemmelse af den overordnede institutionelle stemning ved at plotte forholdet mellem put og kald. Diagrammet til højre viser det historiske put/call-forhold for dette instrument.
Brug af Put/Call Ratio som en indikator for investorernes stemning overvinder en af de vigtigste mangler ved at bruge totalt institutionelt ejerskab, som er, at en betydelig mængde af aktiver under forvaltning investeres passivt for at spore indekser. Passivt forvaltede fonde køber typisk ikke optioner, så indikatoren for put/call-forholdet følger mere nøje følelsen af aktivt forvaltede fonde.
13D/G-arkivering
Vi præsenterer 13D/G ansøgninger separat fra 13F ansøgninger på grund af den forskellige behandling af SEC. 13D/G-ansøgninger kan indgives af grupper af investorer (med én ledende), hvorimod 13F-ansøgninger ikke kan. Dette resulterer i situationer, hvor en investor kan indsende en 13D/G, der rapporterer én værdi for de samlede aktier (der repræsenterer alle de aktier, der ejes af investorgruppen), men derefter indsender en 13F, der rapporterer en anden værdi for de samlede aktier (der udelukkende repræsenterer deres egne) ejendomsret). Det betyder, at aktieejerskab af 13D/G-arkiver og 13F-arkiveringer ofte ikke er direkte sammenlignelige, så vi præsenterer dem separat.
Bemærk: Fra den 16. maj 2021 viser vi ikke længere ejere, der ikke har indsendt en 13D/G inden for det seneste år. Tidligere viste vi den fulde historie af 13D/G-arkiver. Generelt skal enheder, der er forpligtet til at indgive 13D/G-ansøgninger, indgive mindst årligt, før de indsender en afsluttende ansøgning. Dog forlader fonde nogle gange positioner uden at indsende en afsluttende ansøgning (dvs. de afvikler), så visning af den fulde historie resulterede nogle gange i forvirring om det nuværende ejerskab. For at undgå forvirring viser vi nu kun 'aktuelle' ejere - det vil sige - ejere, der har anmeldt inden for det seneste år.
Upgrade to unlock premium data.
| Fil dato | Form | Investor | Forrige Aktier |
Seneste Aktier |
Δ Aktier (Procent) |
Ejendomsret (Procent) |
Δ Ejerskab (Procent) |
|
|---|---|---|---|---|---|---|---|---|
| 2026-04-28 | VANGUARD PORTFOLIO MANAGEMENT LLC | 5,515,883 | 5.16 | |||||
| 2026-03-26 | VANGUARD GROUP INC | 9,556,442 | 0 | -100.00 | 0.00 | -100.00 | ||
| 2026-02-12 | BRANDES INVESTMENT PARTNERS, LP | 5,356,643 | 8,202,794 | 53.13 | 7.70 | 43.66 | ||
| 2025-11-12 | WASATCH ADVISORS INC | 5,505,467 | 5.30 | |||||
| 2025-07-18 | BlackRock, Inc. | 16,448,541 | 15,836,831 | -3.72 | 15.30 | -6.71 |
13F og NPORT arkivering
Detaljer om 13F-arkivering er gratis. Detaljer om NP-ansøgninger kræver et premium-medlemskab. Grønne rækker angiver nye positioner. Røde rækker angiver lukkede positioner. Klik på linket ikon for at se den fulde transaktionshistorik.
Opgrader
for at låse premium-data op og eksportere til Excel ![]() .
.
| Fil dato | Kilde | Investor | Type | Gennemsnitlig pris (Øst) |
Aktier | Δ Aktier (%) |
Rapporteret Værdi ($1000) |
Δ Værdi (%) |
Port Alloc (%) |
|
|---|---|---|---|---|---|---|---|---|---|---|
| 2026-02-17 | 13F | Dark Forest Capital Management Lp | 0 | -100,00 | 0 | -100,00 | ||||
| 2026-02-06 | 13F | Gsa Capital Partners Llp | 141.372 | 557,09 | 2 | |||||
| 2026-02-17 | 13F | ExodusPoint Capital Management, LP | 0 | -100,00 | 0 | -100,00 | ||||
| 2026-02-12 | 13F | Castleark Management Llc | 118.031 | -72,44 | 1.651 | -77,26 | ||||
| 2026-02-13 | 13F | Baird Financial Group, Inc. | 10.823 | 151 | ||||||
| 2026-01-26 | 13F | KBC Group NV | 4.375 | 0,00 | 0 | |||||
| 2026-02-11 | 13F | Cedar Mountain Advisors, LLC | 0 | -100,00 | 0 | |||||
| 2026-01-29 | 13F | Sanctuary Advisors, LLC | 20.429 | -2,23 | 286 | -19,49 | ||||
| 2026-02-10 | 13F | Bnp Paribas Arbitrage, Sa | 24.873 | -72,02 | 348 | -76,96 | ||||
| 2026-02-17 | 13F | Bayesian Capital Management, LP | 0 | -100,00 | 0 | |||||
| 2025-11-13 | 13F | Bank Of Montreal /can/ | 0 | -100,00 | 0 | |||||
| 2026-02-11 | 13F | Ameritas Investment Partners, Inc. | 8.310 | 116 | ||||||
| 2026-02-17 | 13F | Creative Planning | 19.089 | -18,70 | 267 | -32,75 | ||||
| 2026-02-11 | 13F | Jpmorgan Chase & Co | 490.938 | -20,07 | 6.868 | -34,02 | ||||
| 2026-01-14 | 13F | Hennion & Walsh Asset Management, Inc. | 63.739 | -29,35 | 892 | -41,73 | ||||
| 2026-01-30 | 13F/A | M&t Bank Corp | 14.708 | 206 | ||||||
| 2026-02-10 | 13F | Natixis Advisors, L.p. | 0 | -100,00 | 0 | |||||
| 2026-04-06 | 13F | Versant Capital Management, Inc | 1.244 | 0,00 | 18 | 0,00 | ||||
| 2026-02-11 | 13F | Deutsche Bank Ag\ | 82.212 | 3,49 | 1.150 | -14,56 | ||||
| 2026-04-23 | 13F | North Star Investment Management Corp. | 122 | 2 | ||||||
| 2026-02-09 | 13F | Geode Capital Management, Llc | 2.391.732 | 1,22 | 33.467 | -16,45 | ||||
| 2026-02-09 | 13F | Legal & General Group Plc | 257.697 | -5,72 | 3.605 | -22,17 | ||||
| 2026-02-12 | 13F | Wealthspire Advisors, LLC | 0 | -100,00 | 0 | |||||
| 2026-02-13 | 13F | Pinnacle Wealth Planning Services, Inc. | 483 | 7 | ||||||
| 2026-02-13 | 13F | Walleye Capital LLC | 0 | -100,00 | 0 | |||||
| 2026-02-13 | 13F | Charles Schwab Investment Management Inc | 1.028.496 | -1,36 | 14.389 | -18,59 | ||||
| 2026-05-01 | 13F | Arizona State Retirement System | 29.113 | 0,13 | 414 | 1,97 | ||||
| 2026-02-05 | 13F | Teton Advisors, LLC | 62.000 | 0,00 | 867 | -17,43 | ||||
| 2026-02-13 | 13F | State Street Corp | 4.213.741 | -1,77 | 58.950 | -18,92 | ||||
| 2026-02-11 | 13F | Group One Trading, L.p. | Put | 0 | -100,00 | 0 | -100,00 | |||
| 2025-11-14 | 13F | Petrus Trust Company, LTA | 0 | -100,00 | 0 | |||||
| 2026-02-05 | 13F | Amalgamated Bank | 30.208 | -0,25 | 0 | |||||
| 2026-02-12 | 13F | Cibc World Markets Corp | 0 | -100,00 | 0 | |||||
| 2025-11-14 | 13F | Point72 (DIFC) Ltd | 5.668 | 96 | ||||||
| 2026-02-12 | 13F | Hrt Financial Lp | 240.537 | 3 | ||||||
| 2026-04-14 | 13F | Nbc Securities, Inc. | 3.517 | 50 | ||||||
| 2026-02-17 | 13F | Jones Financial Companies Lllp | 160 | 33,33 | 2 | 0,00 | ||||
| 2026-02-12 | 13F | DRW Securities, LLC | 14.785 | -0,69 | 207 | -18,58 | ||||
| 2026-04-16 | 13F | Balboa Wealth Partners | 19.526 | 47,64 | 278 | 49,73 | ||||
| 2026-02-11 | 13F | Brandes Investment Partners, Lp | 8.198.707 | 27,57 | 114.700 | 5,30 | ||||
| 2025-11-14 | 13F | Bridgefront Capital, LLC | 0 | -100,00 | 0 | -100,00 | ||||
| 2026-02-13 | 13F | S Squared Technology, LLC | 519.767 | 0,00 | 7.272 | -17,47 | ||||
| 2026-02-10 | 13F | Rothschild Investment Llc | 108 | -28,00 | 2 | -50,00 | ||||
| 2026-02-17 | 13F | Susquehanna International Group, Llp | Put | 16.100 | -68,62 | 225 | -74,11 | |||
| 2026-02-17 | 13F | Susquehanna International Group, Llp | Call | 25.400 | -85,15 | 355 | -87,75 | |||
| 2026-02-11 | 13F | Franklin Resources Inc | 152.529 | 3,12 | 2.134 | -14,92 | ||||
| 2026-02-17 | 13F | Worth Venture Partners, LLC | 13.500 | 0,00 | 189 | -17,54 | ||||
| 2026-02-12 | 13F | Jane Street Group, Llc | Call | 14.900 | 208 | |||||
| 2026-02-13 | 13F | Formula Growth Ltd | 100.000 | 1.399 | ||||||
| 2026-02-17 | 13F | Driehaus Capital Management Llc | 1.951.869 | -21,47 | 27.307 | -35,18 | ||||
| 2026-02-13 | 13F | Morgan Stanley | 1.350.487 | -1,74 | 18.893 | -18,90 | ||||
| 2026-05-01 | 13F | Thrivent Financial For Lutherans | 70.748 | -2,86 | 1 | 0,00 | ||||
| 2026-02-13 | 13F/A | Texas Permanent School Fund | 0 | -100,00 | 0 | |||||
| 2026-02-17 | 13F | Amundi | 61.278 | -16,62 | 857 | -32,04 | ||||
| 2026-02-18 | 13F | State of Tennessee, Treasury Department | 66.071 | -0,18 | 838 | -25,25 | ||||
| 2025-11-14 | 13F | Balyasny Asset Management Llc | 0 | -100,00 | 0 | |||||
| 2026-04-16 | 13F | SG Americas Securities, LLC | 32.883 | -28,90 | 0 | |||||
| 2026-02-17 | 13F | Two Sigma Advisers, Lp | 53.826 | 130,76 | 753 | 90,63 | ||||
| 2026-02-05 | 13F | Atria Investments Llc | 29.919 | -2,71 | 419 | -19,77 | ||||
| 2026-02-03 | 13F | Orion Capital Management LLC | 34.260 | -2,00 | 479 | -19,09 | ||||
| 2026-02-13 | 13F | American Century Companies Inc | 47.962 | -2,20 | 671 | -19,37 | ||||
| 2026-02-13 | 13F | Squarepoint Ops LLC | 432.307 | 231,69 | 6.048 | 173,74 | ||||
| 2025-11-21 | 13F/A | CIBC Bancorp USA Inc. | 10.603 | 180 | ||||||
| 2026-04-21 | 13F | Wasatch Advisors Inc | 5.426.267 | 1,95 | 77.216 | 3,70 | ||||
| 2026-02-17 | 13F | State Of Wisconsin Investment Board | 31.880 | 200,30 | 446 | 149,16 | ||||
| 2026-04-30 | 13F | Private Trust Co Na | 524 | 0,00 | 7 | 0,00 | ||||
| 2026-01-26 | 13F | Cwm, Llc | 13.837 | -55,25 | 0 | |||||
| 2026-02-11 | 13F | Clearbridge Investments, LLC | 485.667 | 6.794 | ||||||
| 2026-02-17 | 13F | Manatuck Hill Partners, LLC | 17.000 | 238 | ||||||
| 2026-02-11 | 13F | Rise Advisors, LLC | 0 | -100,00 | 0 | |||||
| 2026-02-17 | 13F | Graham Capital Management, L.P. | 0 | -100,00 | 0 | |||||
| 2026-02-17 | 13F | G2 Investment Partners Management LLC | 155.000 | -73,65 | 2.168 | -78,26 | ||||
| 2026-01-29 | 13F | Teachers Retirement System Of The State Of Kentucky | 23.344 | 0,00 | 0 | |||||
| 2026-02-13 | 13F | Lord, Abbett & Co. Llc | 605.589 | -0,09 | 8 | -20,00 | ||||
| 2026-01-30 | 13F | NJ State Employees Deferred Compensation Plan | 0 | -100,00 | 0 | |||||
| 2026-02-06 | 13F | Covestor Ltd | 1.876 | 0,00 | 0 | |||||
| 2026-02-17 | 13F | Freestone Grove Partners LP | 27.791 | 389 | ||||||
| 2026-02-17 | 13F | Northern Trust Corp | 1.295.487 | 1,68 | 18.124 | -16,08 | ||||
| 2026-04-23 | 13F | Farmers & Merchants Investments Inc | 60 | 0,00 | 1 | |||||
| 2026-02-09 | 13F | Emerald Advisers, Llc | 2.059.864 | 18,77 | 28.817 | -1,97 | ||||
| 2026-02-10 | 13F | Mutual Of America Capital Management Llc | 684.307 | -2,32 | 9.573 | -19,37 | ||||
| 2026-02-13 | 13F | Landscape Capital Management, L.l.c. | 0 | -100,00 | 0 | -100,00 | ||||
| 2026-02-13 | 13F | Barclays Plc | 197.262 | 13,78 | 2.760 | -6,09 | ||||
| 2026-02-17 | 13F | Canada Pension Plan Investment Board | 12.000 | 55,84 | 168 | 28,46 | ||||
| 2026-02-13 | 13F | Marshall Wace, Llp | 2.201.600 | -13,81 | 30.800 | -28,87 | ||||
| 2025-11-14 | 13F | Virtu Financial LLC | 0 | -100,00 | 0 | |||||
| 2026-02-06 | 13F | Larson Financial Group LLC | 321 | 296,30 | 4 | 300,00 | ||||
| 2026-04-23 | 13F | SJS Investment Consulting Inc. | 23 | 360,00 | 0 | |||||
| 2026-02-10 | 13F | Axq Capital, Lp | 11.461 | -17,01 | 160 | -31,62 | ||||
| 2026-02-17 | 13F | Point72 Asset Management, L.P. | 512.957 | 7.176 | ||||||
| 2026-04-30 | 13F | Cambridge Investment Research Advisors, Inc. | 0 | -100,00 | 0 | |||||
| 2026-02-17 | 13F | Man Group plc | 500.083 | 16,29 | 6.996 | -4,02 | ||||
| 2025-11-05 | 13F | SOUTH STATE Corp | 0 | -100,00 | 0 | |||||
| 2026-02-17 | 13F | Cetera Investment Advisers | 13.596 | -3,92 | 190 | -20,50 | ||||
| 2026-02-17 | 13F | Optiver Holding B.V. | 0 | -100,00 | 0 | |||||
| 2026-02-13 | 13F | BNP Paribas Asset Management Holding S.A. | 1.558 | 41,00 | 0 | |||||
| 2026-02-17 | 13F | Citadel Advisors Llc | Put | 0 | -100,00 | 0 | ||||
| 2026-02-19 | 13F | Invesco Ltd. | 452.697 | 27,73 | 6.333 | 5,43 | ||||
| 2026-02-13 | 13F | Sei Investments Co | 72.361 | 55,44 | 1.012 | 28,26 | ||||
| 2026-04-30 | 13F | Nisa Investment Advisors, Llc | 55.808 | 0,90 | 794 | 2,72 | ||||
| 2026-02-10 | 13F | Goldman Sachs Group Inc | 613.057 | 30,38 | 8.577 | 7,60 | ||||
| 2026-02-17 | 13F | Citadel Advisors Llc | Call | 17.400 | 6,75 | 243 | -11,96 | |||
| 2026-02-17 | 13F | California State Teachers Retirement System | 99.734 | 7,98 | 1.395 | -10,86 | ||||
| 2026-02-09 | 13F | Royce & Associates Lp | 989.540 | 3,54 | 13.844 | -14,54 | ||||
| 2026-02-17 | 13F | Mercer Global Advisors Inc /adv | 0 | -100,00 | 0 | |||||
| 2026-02-17 | 13F | Janus Henderson Group Plc | 928.440 | -3,87 | 12.989 | -20,65 | ||||
| 2026-04-22 | 13F | Sterling Capital Management LLC | 661 | 0,00 | 9 | 0,00 | ||||
| 2025-11-17 | 13F | Caxton Associates Llp | 0 | -100,00 | 0 | |||||
| 2026-02-13 | 13F | Prudential Financial Inc | 98.343 | -6,25 | 1.376 | -22,67 | ||||
| 2026-02-10 | 13F | Savant Capital, LLC | 0 | -100,00 | 0 | |||||
| 2026-02-06 | 13F | Global Retirement Partners, LLC | 132 | 2 | ||||||
| 2026-02-13 | 13F | Citigroup Inc | 24.088 | -37,46 | 337 | -48,47 | ||||
| 2026-02-11 | 13F | Group One Trading, L.p. | Call | 1.300 | -69,05 | 18 | -74,65 | |||
| 2026-02-17 | 13F | D. E. Shaw & Co., Inc. | 1.756.167 | 11,78 | 24.569 | -7,74 | ||||
| 2026-02-12 | 13F | BlackRock, Inc. | 16.804.199 | 2,64 | 235.091 | -15,28 | ||||
| 2025-11-14 | 13F | Point72 Europe (London) LLP | 468 | 8 | ||||||
| 2026-02-11 | 13F | Simplex Trading, Llc | Put | 100 | 1 | |||||
| 2026-02-11 | 13F | Simplex Trading, Llc | 175 | 2 | ||||||
| 2026-01-28 | 13F | B. Metzler seel. Sohn & Co. AG | 87.349 | 14,35 | 1.222 | -5,56 | ||||
| 2026-02-13 | 13F | Quarry LP | 1.880 | -29,03 | 26 | -40,91 | ||||
| 2026-02-18 | 13F | SkyView Investment Advisors, LLC | 57.405 | -0,53 | 1 | |||||
| 2026-02-17 | 13F | Lazard Asset Management Llc | 44.895 | 0,16 | 628 | -17,26 | ||||
| 2026-02-11 | 13F | Simplex Trading, Llc | Call | 400 | -97,65 | 6 | ||||
| 2026-02-17 | 13F | Brevan Howard Capital Management LP | 19.703 | -67,61 | 276 | -73,33 | ||||
| 2026-02-09 | 13F | Harbour Investments, Inc. | 99 | 0,00 | 1 | 0,00 | ||||
| 2026-04-08 | 13F | Wealth Enhancement Advisory Services, Llc | 13.836 | 36,27 | 194 | 40,58 | ||||
| 2026-02-13 | 13F | MAI Capital Management | 107 | 24,42 | 1 | 0,00 | ||||
| 2026-02-17 | 13F | Citadel Advisors Llc | 573.656 | 426,01 | 8.025 | 334,25 | ||||
| 2026-01-29 | 13F | Comerica Bank | 25.773 | -18,13 | 361 | -32,46 | ||||
| 2026-02-17 | 13F | Raymond James Financial Inc | 365.463 | -12,20 | 5.113 | -27,54 | ||||
| 2026-02-12 | 13F | Integrated Quantitative Investments LLC | 101.338 | 279,81 | 1.418 | 213,50 | ||||
| 2026-02-10 | 13F | State of Wyoming | 35.817 | 49,01 | 501 | 23,10 | ||||
| 2026-02-10 | 13F | Envestnet Asset Management Inc | 75.172 | 27,84 | 1.052 | 5,52 | ||||
| 2026-02-13 | 13F | AWM Investment Company, Inc. | 1.172.609 | 39,99 | 16.405 | 15,55 | ||||
| 2026-02-05 | 13F | Gamco Investors, Inc. Et Al | 12.700 | 0,00 | 178 | -17,67 | ||||
| 2026-02-11 | 13F | Los Angeles Capital Management Llc | 96.691 | 0,46 | 1.830 | 12,20 | ||||
| 2026-02-12 | 13F | Paradigm Capital Management Inc/ny | 336.800 | 0,00 | 4.712 | -17,47 | ||||
| 2026-02-17 | 13F | Millennium Management Llc | 247.582 | -79,88 | 3.464 | -83,39 | ||||
| 2026-02-13 | 13F | Aigen Investment Management, Lp | 0 | -100,00 | 0 | |||||
| 2026-02-17 | 13F | PDT Partners, LLC | 75.884 | 0,00 | 1.062 | -17,50 | ||||
| 2025-11-14 | 13F | Point72 Hong Kong Ltd | 0 | -100,00 | 0 | -100,00 | ||||
| 2026-02-10 | 13F | Lido Advisors, LLC | 10.439 | 0,00 | 176 | 0,00 | ||||
| 2026-04-10 | 13F | Abound Wealth Management | 12 | 0,00 | 0 | |||||
| 2026-04-21 | 13F | PharVision Advisers, LLC | 0 | -100,00 | 0 | |||||
| 2026-04-27 | 13F | Truist Financial Corp | 29.887 | 33,94 | 425 | 36,22 | ||||
| 2025-11-10 | 13F | Options Solutions, Llc | 0 | -100,00 | 0 | |||||
| 2026-02-13 | 13F | Resources Investment Advisors, LLC. | 34.261 | -1,08 | 479 | -18,40 | ||||
| 2026-02-17 | 13F | Alliancebernstein L.p. | 354.612 | 14,77 | 4.961 | -5,25 | ||||
| 2026-02-13 | 13F | Mariner, LLC | 28.098 | 12,34 | 393 | -7,33 | ||||
| 2026-02-13 | 13F | Victory Capital Management Inc | 240.352 | 392,07 | 3.363 | 306,53 | ||||
| 2026-04-29 | 13F | Klp Kapitalforvaltning As | 31.000 | 30,25 | 441 | 32,83 | ||||
| 2026-01-23 | 13F | Guidance Capital, Inc | 42.509 | -0,36 | 592 | -28,71 | ||||
| 2026-02-13 | 13F | Great West Life Assurance Co /can/ | 87.632 | -28,38 | 1 | -50,00 | ||||
| 2026-02-11 | 13F | Group One Trading, L.p. | 1.236 | 17 | ||||||
| 2026-04-09 | 13F | Moody National Bank Trust Division | 21.881 | 311 | ||||||
| 2026-02-13 | 13F | Herald Investment Management Ltd | 1.307.000 | 2,35 | 18.285 | -15,53 | ||||
| 2026-02-17 | 13F | Magnetar Financial LLC | 13.690 | 192 | ||||||
| 2026-05-01 | 13F | Hantz Financial Services, Inc. | 2.346 | 18,66 | 0 | |||||
| 2026-02-17 | 13F | Engineers Gate Manager LP | 243.236 | -5,96 | 3.403 | -22,40 | ||||
| 2026-02-13 | 13F | Ieq Capital, Llc | 0 | -100,00 | 0 | |||||
| 2026-02-10 | 13F | Quantbot Technologies LP | 0 | -100,00 | 0 | |||||
| 2026-03-06 | 13F | Hsbc Holdings Plc | 27.870 | 9,47 | 390 | -9,32 | ||||
| 2026-04-10 | 13F/A | OP Asset Management Ltd | 444.636 | 426,14 | 6.327 | 435,28 | ||||
| 2026-02-06 | 13F | EverSource Wealth Advisors, LLC | 9.397 | 2,26 | 131 | -15,48 | ||||
| 2026-02-17 | 13F | Ameriprise Financial Inc | 186.258 | -6,23 | 2.606 | -22,61 | ||||
| 2026-04-20 | 13F | State of Alaska, Department of Revenue | 57.540 | -1,93 | 1 | |||||
| 2026-01-28 | 13F | Universal- Beteiligungs- und Servicegesellschaft mbH | 14.622 | 0,00 | 205 | -17,41 | ||||
| 2026-02-11 | 13F | Cerity Partners LLC | 0 | -100,00 | 0 | |||||
| 2026-02-13 | 13F | Peak6 Llc | 0 | -100,00 | 0 | |||||
| 2026-02-12 | 13F | Campbell & CO Investment Adviser LLC | 0 | -100,00 | 0 | |||||
| 2026-02-17 | 13F | Granahan Investment Management Inc/ma | 0 | -100,00 | 0 | |||||
| 2026-04-27 | 13F | Sound Income Strategies, LLC | 55 | 0,00 | 1 | |||||
| 2026-04-28 | 13F | Harbor Capital Advisors, Inc. | 194.994 | 63,12 | 3 | 100,00 | ||||
| 2026-02-17 | 13F | Numerai GP LLC | 28.899 | 404 | ||||||
| 2026-02-17 | 13F | Boothbay Fund Management, Llc | 44.484 | -68,22 | 622 | -73,78 | ||||
| 2026-04-28 | 13F | Whittier Trust Co | 172 | 0,00 | 2 | 0,00 | ||||
| 2026-02-10 | 13F | Connor, Clark & Lunn Investment Management Ltd. | 1.206.617 | -17,02 | 16.881 | -31,51 | ||||
| 2026-02-12 | 13F | Renaissance Technologies Llc | 2.289.759 | 24,73 | 32.034 | 2,95 | ||||
| 2026-02-17 | 13F | XTX Topco Ltd | 126.940 | 1.776 | ||||||
| 2026-02-13 | 13F | Rhumbline Advisers | 267.409 | -7,10 | 3.741 | -23,32 | ||||
| 2026-02-17 | 13F | Westwood Holdings Group Inc | 43.270 | -2,42 | 605 | -19,55 | ||||
| 2026-04-21 | 13F | Old National Bancorp /in/ | 13.238 | 17,44 | 188 | 19,75 | ||||
| 2026-01-15 | 13F | Allspring Global Investments Holdings, LLC | 54.442 | 9,58 | 762 | -9,62 | ||||
| 2026-01-29 | 13F | Vanguard Group Inc | 10.691.336 | 0,31 | 149.572 | -17,21 | ||||
| 2026-01-29 | 13F | Calamos Advisors LLC | 0 | -100,00 | 0 | |||||
| 2026-02-12 | 13F | State Board Of Administration Of Florida Retirement System | 34.165 | 0,00 | 478 | -17,62 | ||||
| 2026-02-17 | 13F | Wiley Bros.-aintree Capital, Llc | 21.275 | -3,41 | 298 | -20,38 | ||||
| 2026-04-07 | 13F/A | Round Rock Advisors, LLC | 38.355 | 53,39 | 537 | 14,29 | ||||
| 2026-02-04 | 13F | Katamaran Capital LLP | 0 | -100,00 | 0 | |||||
| 2026-02-13 | 13F | Public Sector Pension Investment Board | 0 | -100,00 | 0 | |||||
| 2026-02-10 | 13F | Intech Investment Management Llc | 71.340 | 45,44 | 998 | 20,10 | ||||
| 2026-02-11 | 13F | Parallel Advisors, LLC | 54 | 0,00 | 1 | |||||
| 2026-02-10 | 13F | Sittner & Nelson, Llc | 100 | 0,00 | 1 | 0,00 | ||||
| 2026-02-09 | 13F | Emerald Mutual Fund Advisers Trust | 1.238.321 | 26,35 | 17.324 | 4,29 | ||||
| 2026-04-06 | 13F | GAMMA Investing LLC | 6.509 | 9,34 | 93 | 10,84 | ||||
| 2026-02-13 | 13F | Divisadero Street Capital Management, LP | 320.287 | -53,69 | 4.481 | -61,78 | ||||
| 2026-02-17 | 13F | Prospect Capital Advisors, LLC | 520.250 | -2,80 | 7.278 | -19,78 | ||||
| 2026-02-17 | 13F | Pinnacle Financial Partners, Inc. | 38.287 | 536 | ||||||
| 2025-11-13 | 13F | Riggs Asset Managment Co. Inc. | 0 | -100,00 | 0 | |||||
| 2025-11-14 | 13F | Federation des caisses Desjardins du Quebec | 0 | -100,00 | 0 | |||||
| 2026-02-12 | 13F | Quadrant Capital Group Llc | 4.681 | -7,31 | 65 | -23,53 | ||||
| 2026-02-10 | 13F | Acadian Asset Management Llc | 244.440 | 27,02 | 3 | 0,00 | ||||
| 2026-02-17 | 13F | Quantinno Capital Management LP | 20.765 | 64,27 | 291 | 35,51 | ||||
| 2026-02-03 | 13F | SBI Securities Co., Ltd. | 0 | -100,00 | 0 | |||||
| 2026-02-12 | 13F | Polen Capital Management Llc | 0 | -100,00 | 0 | |||||
| 2026-02-13 | 13F | Caitong International Asset Management Co., Ltd | 632 | 20.966,67 | 9 | |||||
| 2026-02-17 | 13F | Susquehanna Portfolio Strategies, LLC | 121.767 | -21,70 | 1.704 | -35,39 | ||||
| 2026-02-10 | 13F/A | Northwestern Mutual Wealth Management Co | 110 | 0,00 | 2 | 0,00 | ||||
| 2025-11-14 | 13F | Skopos Labs, Inc. | 0 | -100,00 | 0 | |||||
| 2026-01-23 | 13F | Assetmark, Inc | 35 | 0,00 | 0 | |||||
| 2026-02-13 | 13F | Needham Investment Management Llc | 1.540.000 | 17,78 | 21.545 | -2,79 | ||||
| 2026-04-24 | 13F | Yousif Capital Management, Llc | 28.062 | -1,65 | 399 | 4,45 | ||||
| 2026-04-27 | 13F | Hunter Associates Investment Management Llc | 217.965 | 9,64 | 3 | 50,00 | ||||
| 2026-04-29 | 13F | Oregon Public Employees Retirement Fund | 24.268 | 0,00 | 345 | 1,77 | ||||
| 2026-02-13 | 13F | Parkside Financial Bank & Trust | 53 | 0,00 | 1 | |||||
| 2026-02-12 | 13F | Voya Investment Management Llc | 243.822 | -10,77 | 3.411 | -26,34 | ||||
| 2026-02-12 | 13F | Swiss National Bank | 205.700 | 2,64 | 2.878 | -15,28 | ||||
| 2026-02-17 | 13F | Trexquant Investment LP | 278.397 | -30,51 | 3.895 | -42,66 | ||||
| 2026-05-01 | 13F | Commonwealth Of Pennsylvania Public School Empls Retrmt Sys | 26.211 | -0,11 | 373 | 1,36 | ||||
| 2026-02-17 | 13F | Qube Research & Technologies Ltd | 865.810 | -5,65 | 12.113 | -22,12 | ||||
| 2026-02-13 | 13F | Manufacturers Life Insurance Company, The | 0 | -100,00 | 0 | |||||
| 2026-04-21 | 13F | Gilpin Wealth Management, Llc | 10 | -16,67 | 0 | |||||
| 2026-02-10 | 13F | Hillsdale Investment Management Inc. | 343.582 | -11,05 | 4.807 | -26,59 | ||||
| 2026-02-05 | 13F | Gabelli Funds Llc | 116.530 | 0,00 | 1.630 | -17,47 | ||||
| 2025-11-13 | 13F | Glenmede Investment Management, LP | 10.732 | 182 | ||||||
| 2026-04-21 | 13F | Hosking Partners LLP | 1.159.781 | 80,19 | 16.504 | 83,29 | ||||
| 2026-04-30 | 13F | Nuveen, LLC | 1.480.543 | 40,45 | 21.068 | 42,86 | ||||
| 2026-02-06 | 13F | Legato Capital Management LLC | 108.725 | 11,96 | 1.521 | -7,59 | ||||
| 2026-02-12 | 13F | CIBC Private Wealth Group, LLC | 27 | 1.250,00 | 0 | |||||
| 2026-02-17 | 13F | Jump Financial, LLC | 15.144 | -90,45 | 212 | -92,15 | ||||
| 2026-02-12 | 13F | Steward Partners Investment Advisory, Llc | 4.370 | -51,82 | 61 | -60,13 | ||||
| 2026-02-20 | 13F | Sunbelt Securities, Inc. | 55 | 0,00 | 1 | |||||
| 2026-02-02 | 13F | Principal Financial Group Inc | 506.470 | 0,43 | 7.086 | -17,11 | ||||
| 2026-02-17 | 13F | Capital Fund Management S.a. | 88.215 | 23,25 | 1.234 | 1,73 | ||||
| 2025-11-21 | 13F | Nebula Research & Development LLC | 0 | -100,00 | 0 | |||||
| 2026-02-10 | 13F | Globeflex Capital L P | 128.094 | 0,00 | 1.792 | -17,46 | ||||
| 2026-02-17 | 13F | Fmr Llc | 640.883 | 24,05 | 8.966 | 2,39 | ||||
| 2026-04-30 | 13F | Teacher Retirement System Of Texas | 0 | -100,00 | 0 | |||||
| 2026-01-29 | 13F | D.a. Davidson & Co. | 76.543 | -1,18 | 1.071 | -18,45 | ||||
| 2026-02-13 | 13F | Natixis | 50.000 | 0,00 | 700 | -17,47 | ||||
| 2026-02-18 | 13F | Mackenzie Financial Corp | 88.651 | 17,44 | 1.230 | -3,91 | ||||
| 2026-04-13 | 13F | Massmutual Trust Co Fsb/adv | 330 | 0,00 | 5 | 0,00 | ||||
| 2026-02-06 | 13F | Pnc Financial Services Group, Inc. | 6.116 | -8,72 | 86 | -24,78 | ||||
| 2026-02-17 | 13F | Tower Research Capital LLC (TRC) | 3.966 | -16,84 | 55 | -31,25 | ||||
| 2026-01-23 | 13F | Rsm Us Wealth Management Llc | 12.960 | 1,90 | 180 | -16,28 | ||||
| 2026-02-13 | 13F | Smartleaf Asset Management LLC | 1.709 | 5,75 | 24 | -14,81 | ||||
| 2026-02-05 | 13F | Bessemer Group Inc | 824 | 38,95 | 0 | |||||
| 2026-02-11 | 13F | Winton Capital Group Ltd | 90.715 | 15,88 | 1.269 | -4,30 | ||||
| 2026-04-13 | 13F | True Wealth Design, LLC | 0 | -100,00 | 0 | |||||
| 2026-03-11 | 13F | Leonteq Securities AG | 0 | -100,00 | 0 | |||||
| 2026-04-24 | 13F | ProShare Advisors LLC | 15.864 | -18,29 | 226 | -16,97 | ||||
| 2026-01-29 | 13F | UBS Group AG | 580.829 | 49,91 | 8.126 | 23,72 | ||||
| 2026-02-10 | 13F | Smith Group Asset Management, LLC | 49.094 | 2,50 | 687 | -15,41 | ||||
| 2026-04-13 | 13F | IFP Advisors, Inc | 254 | -32,45 | 4 | -40,00 | ||||
| 2026-02-12 | 13F | Jane Street Group, Llc | 0 | -100,00 | 0 | -100,00 | ||||
| 2026-02-14 | 13F | Rockefeller Capital Management L.P. | 48.504 | -0,20 | 679 | -17,62 | ||||
| 2026-02-13 | 13F | SRS Capital Advisors, Inc. | 0 | -100,00 | 0 | |||||
| 2026-02-17 | 13F | Capstone Investment Advisors, Llc | 31.630 | 443 | ||||||
| 2026-04-29 | 13F | Swedbank AB | 950.000 | -20,83 | 13.518 | -19,48 | ||||
| 2026-02-17 | 13F | Algert Global Llc | 234.366 | -36,21 | 3 | -50,00 | ||||
| 2026-04-07 | 13F | Farther Finance Advisors, LLC | 7.512 | -1,56 | 106 | -0,94 | ||||
| 2026-04-22 | 13F | Pictet Asset Management Holding SA | 19.558 | 19,18 | 278 | 21,40 | ||||
| 2026-04-29 | 13F | WPG Advisers, LLC | 12 | 0 | ||||||
| 2025-11-10 | 13F | Counterpoint Mutual Funds LLC | 0 | -100,00 | 0 | |||||
| 2026-02-05 | 13F | Allworth Financial LP | 1.478 | -34,46 | 21 | -47,37 | ||||
| 2026-04-29 | 13F | Police & Firemen's Retirement System of New Jersey | 28.183 | 10,03 | 401 | 12,01 | ||||
| 2026-02-17 | 13F | Price T Rowe Associates Inc /md/ | 104.695 | 4,50 | 1 | 0,00 | ||||
| 2026-04-15 | 13F | Trust Co Of Toledo Na /oh/ | 47 | 0,00 | 1 | |||||
| 2026-04-24 | 13F | Root Financial Partners, LLC | 6 | 0,00 | 0 | |||||
| 2026-02-11 | 13F | Illinois Municipal Retirement Fund | 57.115 | 2,71 | 799 | -15,18 | ||||
| 2025-11-14 | 13F | Shellback Capital, LP | 0 | -100,00 | 0 | |||||
| 2025-11-13 | 13F | O'shaughnessy Asset Management, Llc | 0 | -100,00 | 0 | |||||
| 2026-02-12 | 13F | EAM Investors, LLC | 0 | -100,00 | 0 | |||||
| 2026-02-17 | 13F | MIRAE ASSET GLOBAL ETFS HOLDINGS Ltd. | 138.805 | -1,83 | 1.942 | -18,99 | ||||
| 2026-02-13 | 13F | Essex Investment Management Co Llc | 188.919 | -2,25 | 2.643 | -19,33 | ||||
| 2026-02-17 | 13F | Russell Investments Group, Ltd. | 48.321 | -53,40 | 676 | -61,53 | ||||
| 2026-02-17 | 13F | Royal Bank Of Canada | 31.911 | 159,95 | 447 | 115,94 | ||||
| 2026-02-05 | 13F | GABELLI & Co INVESTMENT ADVISERS, INC. | 10.000 | 0,00 | 140 | -17,75 | ||||
| 2026-02-13 | 13F | Arrowstreet Capital, Limited Partnership | 1.773.335 | -5,90 | 24.809 | -22,34 | ||||
| 2026-04-22 | 13F | 1492 Capital Management LLC | 174.055 | 786,68 | 2.477 | 803,65 | ||||
| 2026-01-30 | 13F | Us Bancorp \de\ | 1.128 | 0,00 | 16 | -21,05 | ||||
| 2026-02-13 | 13F | Umb Bank N A/mo | 162 | -55,37 | 2 | -66,67 | ||||
| 2025-11-13 | 13F | Schroder Investment Management Group | 0 | -100,00 | 0 | |||||
| 2025-11-07 | 13F | Synovus Financial Corp | 38.287 | -3,28 | 649 | -3,43 | ||||
| 2026-04-07 | 13F | Signaturefd, Llc | 5.388 | 0,00 | 77 | 1,33 | ||||
| 2026-02-17 | 13F | Aqr Capital Management Llc | 461.817 | -34,02 | 6.461 | -45,55 | ||||
| 2026-02-12 | 13F | New York State Common Retirement Fund | 144.723 | 29,02 | 2.025 | 6,47 | ||||
| 2026-02-17 | 13F | Maryland State Retirement & Pension System | 15.445 | 2,52 | 216 | -15,29 | ||||
| 2026-05-01 | 13F | Fifth Third Bancorp | 27.728 | 12.857,01 | 395 | 19.600,00 | ||||
| 2026-02-17 | 13F | Susquehanna International Group, Llp | 0 | -100,00 | 0 | |||||
| 2026-02-10 | 13F | Thompson Siegel & Walmsley Llc | 90.566 | 88,82 | 1 | |||||
| 2025-11-13 | 13F | FORA Capital, LLC | 0 | -100,00 | 0 | |||||
| 2026-02-09 | 13F | Quest Partners LLC | 24.420 | 10,92 | 342 | -8,58 | ||||
| 2025-11-14 | 13F | Cubist Systematic Strategies, LLC | 607.214 | 199,93 | 10.292 | 199,80 | ||||
| 2026-04-30 | 13F | LRI Investments, LLC | 365 | 21,67 | 5 | 25,00 | ||||
| 2026-02-13 | 13F | OMERS ADMINISTRATION Corp | 0 | -100,00 | 0 | |||||
| 2025-11-06 | 13F | Bryce Point Capital, LLC | 38.357 | 650 | ||||||
| 2026-02-11 | 13F | LPL Financial LLC | 106.147 | 47,30 | 1.485 | 21,54 | ||||
| 2026-02-13 | 13F | Rice Hall James & Associates, Llc | 3.576.612 | 2,90 | 50.037 | -15,07 | ||||
| 2026-01-29 | 13F | Cornerstone Investment Partners, LLC | 20.874 | 0,06 | 292 | -17,28 | ||||
| 2026-02-17 | 13F/A | Laurion Capital Management LP | 49.023 | 686 | ||||||
| 2026-04-23 | 13F | CWM Advisors, LLC | 36.282 | 8,29 | 516 | 10,26 | ||||
| 2026-02-13 | 13F | Dynamic Technology Lab Private Ltd | 15.797 | -53,84 | 221 | -61,90 | ||||
| 2026-02-13 | 13F | Ubs Asset Management Americas Inc | 169.370 | -2,38 | 2.369 | -19,42 | ||||
| 2026-02-11 | 13F | Primecap Management Co/ca/ | 2.778.740 | -11,39 | 38.875 | -26,86 | ||||
| 2026-02-13 | 13F | Verition Fund Management LLC | 38.300 | -6,40 | 536 | -22,80 | ||||
| 2026-02-03 | 13F | F/M Investments LLC | 32.505 | 455 | ||||||
| 2026-02-17 | 13F | Bank Of America Corp /de/ | 200.371 | -50,86 | 2.803 | -59,44 | ||||
| 2026-02-17 | 13F | Susquehanna Fundamental Investments, Llc | 96.008 | 12,29 | 1.343 | -7,32 | ||||
| 2026-02-17 | 13F | Glenmede Trust Co Na | 10.924 | 153 | ||||||
| 2026-04-24 | 13F | Strs Ohio | 42.200 | -8,46 | 601 | -6,83 | ||||
| 2026-02-09 | 13F | White Pine Capital Llc | 116.533 | 239,82 | 1.630 | 180,55 | ||||
| 2026-02-17 | 13F | Tudor Investment Corp Et Al | 110.648 | -54,89 | 1.548 | -62,79 | ||||
| 2026-02-26 | 13F | TD Capital Management LLC | 132 | 0,00 | 2 | -50,00 | ||||
| 2026-04-20 | 13F | Louisiana State Employees Retirement System | 47.000 | -3,29 | 669 | -1,62 | ||||
| 2026-02-12 | 13F | Ankerstar Wealth, LLC | 28 | 0 | ||||||
| 2026-02-13 | 13F | Wells Fargo & Company/mn | 116.162 | 67,45 | 1.625 | 38,30 | ||||
| 2025-11-14 | 13F | Ardsley Advisory Partners Lp | Put | 0 | -100,00 | 0 | ||||
| 2026-01-28 | 13F | Salomon & Ludwin, LLC | 570 | -0,87 | 8 | -22,22 | ||||
| 2026-01-27 | 13F | Zurcher Kantonalbank (Zurich Cantonalbank) | 45.270 | 11,78 | 633 | -7,73 | ||||
| 2026-02-12 | 13F | Federated Hermes, Inc. | 615 | 15,82 | 9 | -11,11 | ||||
| 2026-02-09 | 13F | Hartland & Co., LLC | 9 | -95,77 | 0 | -100,00 | ||||
| 2026-02-17 | 13F | Advisor Group Holdings, Inc. | 3.963 | -22,54 | 55 | -37,50 | ||||
| 2026-04-27 | 13F | New York State Teachers Retirement System | 107.184 | -17,03 | 2 | 0,00 | ||||
| 2026-04-30 | 13F | Granite Investment Partners, LLC | 650.917 | -5,14 | 9.263 | -3,51 | ||||
| 2026-02-13 | 13F | First Trust Advisors Lp | 189.382 | -35,72 | 2.649 | -46,95 | ||||
| 2026-02-10 | 13F | Bank of New York Mellon Corp | 615.134 | -2,43 | 8.606 | -19,47 | ||||
| 2026-02-12 | 13F | MetLife Investment Management, LLC | 55.715 | -5,67 | 779 | -22,18 |
Other Listings
| DE:2VI | 11,74 € |