Grundlæggende statistik
| Institutionelle aktier (lange) | 11.230.565 - 87,88% (ex 13D/G) - change of -3,24MM shares -22,41% MRQ |
| Institutionel værdi (lang) | $ 2.202.991 USD ($1000) |
Institutionelt ejerskab og aktionærer
Alpha Metallurgical Resources, Inc. (US:AMR) har 284 institutionelle ejere og aktionærer, der har indsendt 13D/G- eller 13F-formularer til Securities Exchange Commission (SEC). Disse institutioner har i alt 11,230,565 aktier. Største aktionærer omfatter BlackRock, Inc., Vanguard Group Inc, State Street Corp, Dimensional Fund Advisors Lp, Continental General Insurance Co, Renaissance Technologies Llc, Dalal Street, LLC, Gendell Jeffrey L, American Century Companies Inc, and Systrade AG .
Alpha Metallurgical Resources, Inc. (NYSE:AMR) institutionel ejerskabsstruktur viser aktuelle positioner i virksomheden efter institutioner og fonde, samt seneste ændringer i positionsstørrelse. Større aktionærer kan omfatte individuelle investorer, investeringsforeninger, hedgefonde eller institutioner. Skema 13D angiver, at investoren besidder (eller besidder) mere end 5 % af virksomheden og har til hensigt (eller har til hensigt at) aktivt at forfølge en ændring i forretningsstrategi. Skema 13G indikerer en passiv investering på over 5%.
The share price as of April 10, 2026 is 192,52 / share. Previously, on April 14, 2025, the share price was 115,91 / share. This represents an increase of 66,09% over that period.

Fondens stemningsscore
Fund Sentiment Score (fka Ownership Accumulation Score) finder de aktier, der bliver mest købt af fonde. Det er resultatet af en sofistikeret, multi-faktor kvantitativ model, der identificerer virksomheder med de højeste niveauer af institutionel akkumulering. Scoringsmodellen bruger en kombination af den samlede stigning i oplyste ejere, ændringerne i porteføljeallokeringer i disse ejere og andre målinger. Tallet går fra 0 til 100, hvor højere tal indikerer et højere niveau af akkumulering for sine jævnaldrende, og 50 er gennemsnittet.
Opdateringsfrekvens: Dagligt
Se Ownership Explorer, som giver en liste over højest rangerende virksomheder.
AI+ Ask Fintel’s AI assistant about Alpha Metallurgical Resources, Inc..
Select a question to share a public post with an AI-crafted answer.
Thinking of good questions…
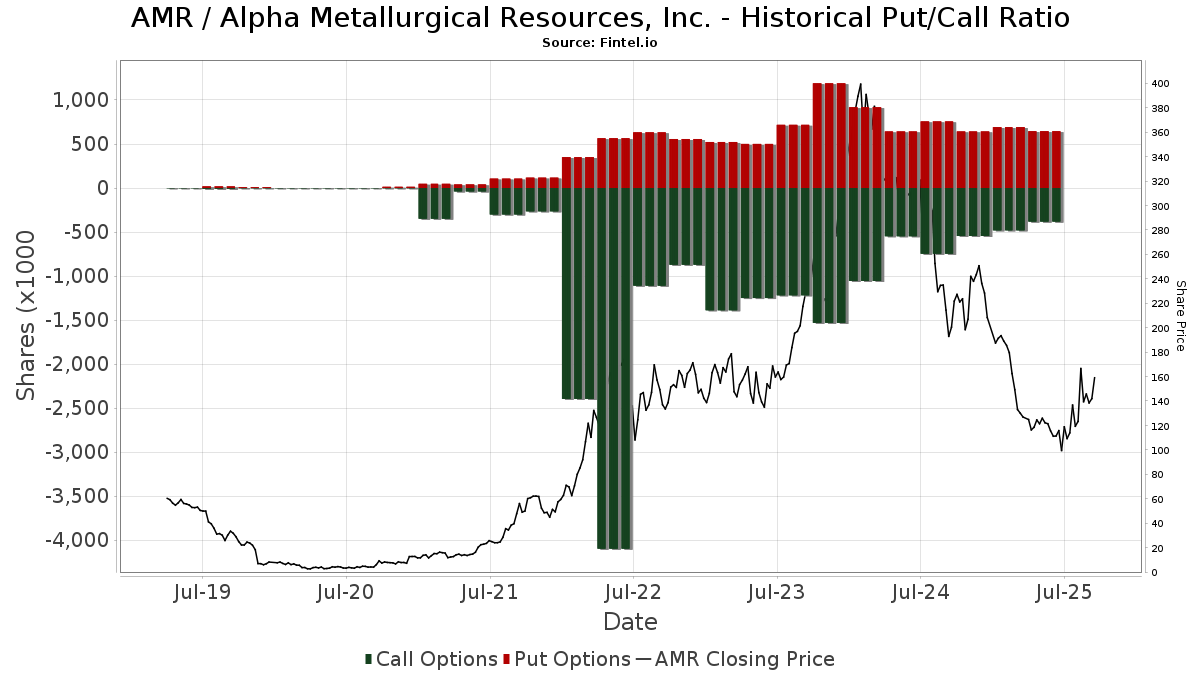
Institutionel Put/Call-forhold
Ud over at indberette standardaktie- og gældsudstedelser skal institutter med mere end 100 mill. aktiver under forvaltning også oplyse deres put- og call-optionsbeholdninger. Da salgsoptioner generelt indikerer negativ stemning, og købsoptioner indikerer positiv stemning, kan vi få en fornemmelse af den overordnede institutionelle stemning ved at plotte forholdet mellem put og kald. Diagrammet til højre viser det historiske put/call-forhold for dette instrument.
Brug af Put/Call Ratio som en indikator for investorernes stemning overvinder en af de vigtigste mangler ved at bruge totalt institutionelt ejerskab, som er, at en betydelig mængde af aktiver under forvaltning investeres passivt for at spore indekser. Passivt forvaltede fonde køber typisk ikke optioner, så indikatoren for put/call-forholdet følger mere nøje følelsen af aktivt forvaltede fonde.
13D/G-arkivering
Vi præsenterer 13D/G ansøgninger separat fra 13F ansøgninger på grund af den forskellige behandling af SEC. 13D/G-ansøgninger kan indgives af grupper af investorer (med én ledende), hvorimod 13F-ansøgninger ikke kan. Dette resulterer i situationer, hvor en investor kan indsende en 13D/G, der rapporterer én værdi for de samlede aktier (der repræsenterer alle de aktier, der ejes af investorgruppen), men derefter indsender en 13F, der rapporterer en anden værdi for de samlede aktier (der udelukkende repræsenterer deres egne) ejendomsret). Det betyder, at aktieejerskab af 13D/G-arkiver og 13F-arkiveringer ofte ikke er direkte sammenlignelige, så vi præsenterer dem separat.
Bemærk: Fra den 16. maj 2021 viser vi ikke længere ejere, der ikke har indsendt en 13D/G inden for det seneste år. Tidligere viste vi den fulde historie af 13D/G-arkiver. Generelt skal enheder, der er forpligtet til at indgive 13D/G-ansøgninger, indgive mindst årligt, før de indsender en afsluttende ansøgning. Dog forlader fonde nogle gange positioner uden at indsende en afsluttende ansøgning (dvs. de afvikler), så visning af den fulde historie resulterede nogle gange i forvirring om det nuværende ejerskab. For at undgå forvirring viser vi nu kun 'aktuelle' ejere - det vil sige - ejere, der har anmeldt inden for det seneste år.
Upgrade to unlock premium data.
| Fil dato | Form | Investor | Forrige Aktier |
Seneste Aktier |
Δ Aktier (Procent) |
Ejendomsret (Procent) |
Δ Ejerskab (Procent) |
|
|---|---|---|---|---|---|---|---|---|
| 2026-03-26 | VANGUARD GROUP INC | 1,213,584 | 0 | -100.00 | 0.00 | -100.00 | ||
| 2026-02-12 | RENAISSANCE TECHNOLOGIES LLC | 661,115 | 611,915 | -7.44 | 4.78 | -5.53 | ||
| 2025-08-11 | STATE STREET CORP | 673,084 | 865,934 | 28.65 | 6.60 | 30.18 | ||
| 2025-05-02 | Pacer Advisors, Inc. | 746,223 | 5.73 | |||||
| 2025-04-23 | BlackRock, Inc. | 2,032,768 | 1,613,492 | -20.63 | 12.40 | -18.95 |
13F og NPORT arkivering
Detaljer om 13F-arkivering er gratis. Detaljer om NP-ansøgninger kræver et premium-medlemskab. Grønne rækker angiver nye positioner. Røde rækker angiver lukkede positioner. Klik på linket ikon for at se den fulde transaktionshistorik.
Opgrader
for at låse premium-data op og eksportere til Excel ![]() .
.
| Fil dato | Kilde | Investor | Type | Gennemsnitlig pris (Øst) |
Aktier | Δ Aktier (%) |
Rapporteret Værdi ($1000) |
Δ Værdi (%) |
Port Alloc (%) |
|
|---|---|---|---|---|---|---|---|---|---|---|
| 2026-02-12 | 13F | Ankerstar Wealth, LLC | 2 | 0 | ||||||
| 2026-02-13 | 13F | Umb Bank N A/mo | 70 | 2,94 | 14 | 18,18 | ||||
| 2026-02-06 | 13F | ProShare Advisors LLC | 2.266 | 3,33 | 453 | 25,91 | ||||
| 2026-02-12 | 13F | Nuveen, LLC | 25.553 | -1,73 | 5.108 | 19,71 | ||||
| 2025-10-20 | 13F | Virginia Retirement Systems Et Al | 0 | -100,00 | 0 | |||||
| 2026-02-02 | 13F | CENTRAL TRUST Co | 20 | 0,00 | 4 | 0,00 | ||||
| 2026-01-21 | 13F | Yousif Capital Management, Llc | 3.301 | -12,65 | 769 | 23,87 | ||||
| 2026-02-12 | 13F | Jane Street Group, Llc | Put | 41.200 | -5,29 | 8.235 | 15,38 | |||
| 2026-02-12 | 13F | Jane Street Group, Llc | Call | 33.200 | 84,44 | 6.636 | 124,72 | |||
| 2026-02-17 | 13F | Wellington Management Group Llp | 44.958 | -2,41 | 8.986 | 18,88 | ||||
| 2026-02-17 | 13F | Spears Abacus Advisors LLC | 0 | -100,00 | 0 | -100,00 | ||||
| 2026-02-13 | 13F | Goehring & Rozencwajg Associates, LLC | 78.895 | 5,99 | 15.770 | 29,11 | ||||
| 2026-02-17 | 13F | Scientech Research LLC | 1.010 | 202 | ||||||
| 2026-02-17 | 13F | Tower Research Capital LLC (TRC) | 829 | 35,02 | 166 | 65,00 | ||||
| 2025-11-04 | 13F | Guerra Advisors Inc | 56 | 9 | ||||||
| 2026-02-11 | 13F | Group One Trading, L.p. | Put | 20.600 | -23,70 | 4.118 | -7,07 | |||
| 2026-02-17 | 13F | Susquehanna International Group, Llp | Put | 97.800 | -58,61 | 19.548 | -49,58 | |||
| 2026-02-17 | 13F | Susquehanna International Group, Llp | Call | 153.400 | 35,75 | 30.662 | 65,36 | |||
| 2026-02-11 | 13F | Group One Trading, L.p. | 23.481 | 98,77 | 4.693 | 142,16 | ||||
| 2026-02-11 | 13F | Group One Trading, L.p. | Call | 10.500 | -47,76 | 2.099 | -36,39 | |||
| 2026-01-28 | 13F | Salomon & Ludwin, LLC | 96 | 12,94 | 19 | 35,71 | ||||
| 2026-02-17 | 13F | Jain Global LLC | 1.709 | 342 | ||||||
| 2026-02-17 | 13F | MIRAE ASSET GLOBAL ETFS HOLDINGS Ltd. | 5.431 | -0,17 | 1.086 | 21,64 | ||||
| 2026-02-12 | 13F | Jane Street Group, Llc | 0 | -100,00 | 0 | -100,00 | ||||
| 2026-02-17 | 13F | Fmr Llc | 2.809 | 11,96 | 562 | 36,50 | ||||
| 2026-01-27 | 13F | Zurcher Kantonalbank (Zurich Cantonalbank) | 1.967 | 0,00 | 393 | 22,05 | ||||
| 2026-02-02 | 13F | Fifth Third Bancorp | 39 | 25,81 | 8 | 40,00 | ||||
| 2026-02-03 | 13F | SBI Securities Co., Ltd. | 82 | 115,79 | 16 | 166,67 | ||||
| 2026-02-10 | 13F | Quantbot Technologies LP | 8.509 | 1.701 | ||||||
| 2026-02-17 | 13F | Susquehanna International Group, Llp | 26.878 | 76,92 | 5.372 | 115,57 | ||||
| 2026-02-05 | 13F | Cambridge Investment Research Advisors, Inc. | 5.136 | 10,62 | 1 | |||||
| 2026-02-13 | 13F | Dalal Street, LLC | 543.000 | 2,07 | 108.535 | 24,33 | ||||
| 2026-02-17 | 13F | Qube Research & Technologies Ltd | 0 | -100,00 | 0 | |||||
| 2026-02-11 | 13F | J.w. Cole Advisors, Inc. | 2.478 | 495 | ||||||
| 2025-10-24 | 13F | Hemington Wealth Management | 15 | 1.400,00 | 0 | |||||
| 2026-02-04 | 13F | Oregon Public Employees Retirement Fund | 2.511 | -0,28 | 502 | 21,31 | ||||
| 2026-04-07 | 13F | Signaturefd, Llc | 98 | -10,09 | 20 | -4,76 | ||||
| 2026-02-13 | 13F | Sterling Capital Management LLC | 497 | -14,01 | 99 | 5,32 | ||||
| 2026-01-30 | 13F | Us Bancorp \de\ | 190 | 9,83 | 38 | 32,14 | ||||
| 2026-01-14 | 13F | Exchange Traded Concepts, Llc | 14.686 | -8,30 | 2.935 | 11,68 | ||||
| 2026-01-07 | 13F | Massmutual Trust Co Fsb/adv | 33 | 0,00 | 7 | 20,00 | ||||
| 2026-02-05 | 13F | Financial Strategies Group, Inc. | 6.122 | -7,13 | 1.295 | 8,10 | ||||
| 2026-02-17 | 13F | Russell Investments Group, Ltd. | 16.526 | 2,49 | 3.303 | 24,88 | ||||
| 2026-02-17 | 13F | D. E. Shaw & Co., Inc. | 156.149 | -9,14 | 31.211 | 10,67 | ||||
| 2026-02-12 | 13F | New York State Common Retirement Fund | 5.031 | -59,38 | 1.006 | -50,54 | ||||
| 2026-02-17 | 13F | Turas Capital Management LP | 3.800 | 760 | ||||||
| 2026-02-05 | 13F | HFM Investment Advisors, LLC | 1 | 0,00 | 0 | |||||
| 2026-02-17 | 13F | D. E. Shaw & Co., Inc. | Put | 55.100 | 0,00 | 11.013 | 21,81 | |||
| 2025-11-14 | 13F | CoreCommodity Management, LLC | 0 | -100,00 | 0 | |||||
| 2026-02-17 | 13F | D. E. Shaw & Co., Inc. | Call | 22.500 | 65,44 | 4.497 | 101,57 | |||
| 2026-01-15 | 13F | Nisa Investment Advisors, Llc | 190 | 9,83 | 38 | 32,14 | ||||
| 2026-02-13 | 13F | Aigen Investment Management, Lp | 1.761 | 352 | ||||||
| 2025-11-03 | 13F | Federated Hermes, Inc. | 0 | -100,00 | 0 | |||||
| 2026-02-11 | 13F | Hughes Financial Services, LLC | 4 | 0,00 | 1 | |||||
| 2026-02-09 | 13F | Atlantic Trust, LLC | 0 | -100,00 | 0 | |||||
| 2026-02-17 | 13F | Credit Agricole S A | 3.151 | 630 | ||||||
| 2026-02-13 | 13F | Wexford Capital Lp | 1.627 | 20,25 | 325 | 46,40 | ||||
| 2026-02-17 | 13F | California State Teachers Retirement System | 10.763 | 3,20 | 2.151 | 25,72 | ||||
| 2026-02-10 | 13F | Bank of New York Mellon Corp | 68.570 | -15,86 | 13.706 | 2,48 | ||||
| 2026-04-06 | 13F | GAMMA Investing LLC | 597 | 15,92 | 123 | 19,61 | ||||
| 2026-01-30 | 13F | Laurel Wealth Advisors LLC | 24 | 5 | ||||||
| 2026-02-12 | 13F | MetLife Investment Management, LLC | 6.541 | -6,06 | 1.307 | 14,45 | ||||
| 2026-02-13 | 13F | Ubs Asset Management Americas Inc | 14.876 | -3,78 | 2.973 | 17,23 | ||||
| 2026-02-17 | 13F | Tudor Investment Corp Et Al | Put | 1.800 | -65,38 | 360 | -57,91 | |||
| 2026-02-17 | 13F | Tudor Investment Corp Et Al | Call | 2.500 | -72,22 | 500 | -66,19 | |||
| 2025-11-14 | 13F | Texas Permanent School Fund | 0 | -100,00 | 0 | |||||
| 2026-01-16 | 13F | Louisiana State Employees Retirement System | 4.900 | -2,00 | 979 | 19,39 | ||||
| 2026-01-29 | 13F | Pictet Asset Management Holding SA | 1.840 | 31,15 | 368 | 59,57 | ||||
| 2026-01-26 | 13F | KBC Group NV | 473 | 0,00 | 0 | |||||
| 2026-02-04 | 13F | Bailard, Inc. | 1.204 | 241 | ||||||
| 2026-03-03 | 13F | NWF Advisory Services Inc. | 35.737 | -12,69 | 7.143 | 6,36 | ||||
| 2026-02-06 | 13F | Copia Wealth Management | 25 | 0,00 | 5 | 0,00 | ||||
| 2026-02-13 | 13F | First Trust Advisors Lp | 5.291 | -80,31 | 1.058 | -76,02 | ||||
| 2026-02-17 | 13F | Advisor Group Holdings, Inc. | 18.582 | -20,81 | 3.714 | 6,08 | ||||
| 2026-04-07 | 13F | Farther Finance Advisors, LLC | 164 | 80,22 | 33 | 77,78 | ||||
| 2025-11-07 | 13F | Sierra Ocean, Llc | 0 | -100,00 | 0 | |||||
| 2026-02-17 | 13F | Royal Bank Of Canada | 1.051 | -84,74 | 210 | -81,42 | ||||
| 2026-02-17 | 13F | Aqr Capital Management Llc | 12.672 | -49,50 | 2.533 | -38,50 | ||||
| 2026-02-09 | 13F | Malaga Cove Capital, LLC | 2.390 | -17,53 | 478 | 0,42 | ||||
| 2026-02-03 | 13F | Mitsubishi UFJ Kokusai Asset Management Co., Ltd. | 16 | 0,00 | 3 | 50,00 | ||||
| 2026-02-13 | 13F | Virtus ETF Advisers LLC | 3.443 | 2,78 | 688 | 25,32 | ||||
| 2026-02-06 | 13F | Profund Advisors Llc | 1.345 | 269 | ||||||
| 2026-02-10 | 13F | Norges Bank | 41.298 | 8.255 | ||||||
| 2026-02-19 | 13F | CI Private Wealth, LLC | 4.992 | -4,70 | 998 | 16,07 | ||||
| 2026-02-18 | 13F | EP Wealth Advisors, Inc. | 1.167 | 233 | ||||||
| 2026-02-13 | 13F | Bridgefront Capital, LLC | 1.253 | -25,64 | 250 | -9,42 | ||||
| 2026-02-11 | 13F | Contrarius Group Holdings Ltd | 58.481 | 11.689 | ||||||
| 2026-02-12 | 13F | DRW Securities, LLC | 9.280 | 1.855 | ||||||
| 2026-02-17 | 13F | Tudor Investment Corp Et Al | 52.308 | 40,01 | 10.455 | 70,55 | ||||
| 2026-01-20 | 13F | Stratos Wealth Advisors, LLC | 17.260 | 2,43 | 3.450 | 24,78 | ||||
| 2026-02-06 | 13F | Gsa Capital Partners Llp | 0 | -100,00 | 0 | |||||
| 2026-02-13 | 13F | Charles Schwab Investment Management Inc | 156.632 | -10,93 | 31.308 | 8,50 | ||||
| 2025-11-13 | 13F | Magnetar Financial LLC | 0 | -100,00 | 0 | -100,00 | ||||
| 2026-02-13 | 13F | Pinnacle Wealth Planning Services, Inc. | 513 | 103 | ||||||
| 2026-01-29 | 13F | IMC-Chicago, LLC | Put | 38.500 | 9,38 | 7.695 | 33,25 | |||
| 2026-02-12 | 13F | Towle & Co | 60.601 | -5,00 | 12.113 | 15,72 | ||||
| 2026-02-13 | 13F | Verition Fund Management LLC | 5.950 | -31,83 | 1.189 | -16,97 | ||||
| 2026-02-18 | 13F | VGI Partners Ltd | 4.888 | 977 | ||||||
| 2026-01-29 | 13F | IMC-Chicago, LLC | Call | 65.100 | 40,00 | 13.012 | 70,54 | |||
| 2025-10-28 | 13F | Campbell & CO Investment Adviser LLC | 0 | -100,00 | 0 | |||||
| 2025-11-14 | 13F | Gotham Asset Management, LLC | 0 | -100,00 | 0 | |||||
| 2026-02-06 | 13F | Tortoise Investment Management, LLC | 0 | -100,00 | 0 | |||||
| 2026-02-12 | 13F | Sprott Inc. | 1.906 | 381 | ||||||
| 2026-02-13 | 13F | Public Employees Retirement Association Of Colorado | 1.321 | 0,00 | 0 | |||||
| 2026-02-11 | 13F | Alta Fundamental Advisers LLC | 69.198 | -1,23 | 13.831 | 20,32 | ||||
| 2026-02-13 | 13F | Manufacturers Life Insurance Company, The | 0 | -100,00 | 0 | |||||
| 2026-01-14 | 13F | ORG Partners LLC | 5 | 0,00 | 1 | |||||
| 2026-02-11 | 13F | Parallel Advisors, LLC | 44 | -2,22 | 9 | 14,29 | ||||
| 2026-02-17 | 13F | Freestone Grove Partners LP | 2.164 | -59,36 | 433 | -50,52 | ||||
| 2026-01-23 | 13F | Financial Enhancement Group LLC | 0 | -100,00 | 0 | |||||
| 2026-02-17 | 13F/A | RBF Capital, LLC | 1.075 | -65,04 | 215 | -57,54 | ||||
| 2026-02-13 | 13F | Schroder Investment Management Group | 2.083 | 421 | ||||||
| 2026-01-28 | 13F | Teacher Retirement System Of Texas | 4.720 | -37,64 | 943 | -24,01 | ||||
| 2026-02-18 | 13F | State of Tennessee, Treasury Department | 2.404 | -7,32 | 504 | 18,59 | ||||
| 2026-02-11 | 13F | LPL Financial LLC | 33.681 | -2,73 | 6.732 | 18,50 | ||||
| 2026-01-29 | 13F | UBS Group AG | 32.305 | -42,88 | 6.457 | -30,42 | ||||
| 2026-02-10 | 13F | Commonwealth Of Pennsylvania Public School Empls Retrmt Sys | 2.674 | -4,26 | 534 | 16,59 | ||||
| 2026-02-06 | 13F | Covestor Ltd | 752 | -54,03 | 0 | |||||
| 2026-02-11 | 13F | Cedar Mountain Advisors, LLC | 3 | 200,00 | 1 | |||||
| 2026-02-12 | 13F | EntryPoint Capital, LLC | 0 | -100,00 | 0 | |||||
| 2026-02-13 | 13F | Continental General Insurance Co | 644.025 | 6,37 | 128.728 | 29,57 | ||||
| 2026-02-17 | 13F | Citadel Advisors Llc | Put | 104.700 | -28,19 | 20.927 | -12,53 | |||
| 2026-02-17 | 13F | Citadel Advisors Llc | 10.360 | -91,38 | 2.071 | -89,50 | ||||
| 2026-02-13 | 13F | Alamea Verwaltungs GmbH | 1.512 | -24,96 | 317 | -3,94 | ||||
| 2026-02-13 | 13F | Dynamic Technology Lab Private Ltd | 0 | -100,00 | 0 | |||||
| 2026-02-17 | 13F | Citadel Advisors Llc | Call | 107.500 | -14,21 | 21.487 | 4,51 | |||
| 2026-02-11 | 13F | Fox Run Management, L.l.c. | 5.860 | 65,35 | 1.171 | 101,55 | ||||
| 2026-01-27 | 13F | Bayforest Capital Ltd | 660 | -84,74 | 132 | -81,52 | ||||
| 2026-02-17 | 13F | Nomura Holdings Inc | 0 | -100,00 | 0 | -100,00 | ||||
| 2026-02-03 | 13F | Morse Asset Management, Inc | 14 | -6,67 | 3 | 0,00 | ||||
| 2026-02-23 | 13F | Virtu Financial LLC | 0 | -100,00 | 0 | |||||
| 2026-02-13 | 13F | Ossiam | 22.800 | 0,00 | 4.557 | 21,81 | ||||
| 2026-01-22 | 13F | Red Tortoise LLC | 20 | 0,00 | 4 | 0,00 | ||||
| 2026-02-10 | 13F | CIBC Asset Management Inc | 1.117 | 223 | ||||||
| 2025-11-14 | 13F | Cinctive Capital Management LP | 0 | -100,00 | 0 | |||||
| 2025-11-14 | 13F | Wolverine Trading, Llc | Put | 12.200 | 2.029 | |||||
| 2026-02-13 | 13F | Gts Securities Llc | 0 | -100,00 | 0 | |||||
| 2026-02-17 | 13F | Bank Of America Corp /de/ | 61.119 | -36,59 | 12.216 | -22,76 | ||||
| 2025-11-13 | 13F | Capital Fund Management S.a. | Call | 0 | -100,00 | 0 | -100,00 | |||
| 2026-02-17 | 13F | Two Sigma Advisers, Lp | 5.000 | -79,08 | 999 | -74,52 | ||||
| 2026-02-17 | 13F | State Of Wisconsin Investment Board | 8.902 | -16,54 | 1.779 | 1,66 | ||||
| 2026-02-11 | 13F | Franklin Resources Inc | 14.241 | -98,63 | 2.846 | -98,72 | ||||
| 2025-11-05 | 13F | Envestnet Asset Management Inc | 0 | -100,00 | 0 | |||||
| 2026-02-11 | 13F | X-Square Capital, LLC | 2.557 | -6,58 | 1 | |||||
| 2025-11-14 | 13F | Wolverine Trading, Llc | 9.163 | 1.524 | ||||||
| 2026-01-29 | 13F | Teachers Retirement System Of The State Of Kentucky | 2.762 | -11,30 | 1 | |||||
| 2026-02-09 | 13F | Hartland & Co., LLC | 0 | -100,00 | 0 | |||||
| 2025-11-14 | 13F | Wolverine Trading, Llc | Call | 11.100 | 1.846 | |||||
| 2026-02-13 | 13F | Kilter Group LLC | 8 | 0,00 | 2 | 0,00 | ||||
| 2026-02-17 | 13F | Schonfeld Strategic Advisors LLC | 2.248 | 449 | ||||||
| 2026-02-17 | 13F | Aquatic Capital Management LLC | 0 | -100,00 | 0 | |||||
| 2026-02-17 | 13F | Steadfast Capital Management Lp | 106.754 | 21.338 | ||||||
| 2026-04-09 | 13F | Crocodile Capital Partners GmbH | 244.119 | 19,01 | 40.999 | 0,00 | ||||
| 2026-02-13 | 13F | Walleye Trading LLC | Put | 3.900 | -54,12 | 780 | -44,12 | |||
| 2026-02-10 | 13F | State of Wyoming | 1.050 | -11,62 | 210 | 7,73 | ||||
| 2026-02-03 | 13F | Chesapeake Capital Corp /il/ | 1.494 | 299 | ||||||
| 2026-02-13 | 13F | Impala Asset Management LLC | 22.000 | 4.397 | ||||||
| 2026-02-13 | 13F | Sei Investments Co | 20.540 | 4.106 | ||||||
| 2026-02-13 | 13F | Walleye Trading LLC | Call | 13.500 | -10,00 | 2.698 | 9,63 | |||
| 2025-11-14 | 13F | Cubist Systematic Strategies, LLC | Put | 4.600 | -57,41 | 755 | -37,89 | |||
| 2026-01-21 | 13F | Unison Advisors LLC | 0 | -100,00 | 0 | |||||
| 2026-02-04 | 13F | Hosking Partners LLP | 79.313 | 5,74 | 15.853 | 28,81 | ||||
| 2026-02-13 | 13F | Walleye Trading LLC | 9.923 | 1.098,43 | 1.983 | 1.368,89 | ||||
| 2026-02-13 | 13F | Prudential Financial Inc | 28.320 | -37,69 | 5.661 | -24,11 | ||||
| 2025-11-14 | 13F | Cubist Systematic Strategies, LLC | Call | 2.400 | -78,38 | 394 | -68,51 | |||
| 2026-01-20 | 13F | Harbor Capital Advisors, Inc. | 254 | -1,55 | 0 | |||||
| 2026-02-09 | 13F | Geode Capital Management, Llc | 266.755 | -0,43 | 53.331 | 21,30 | ||||
| 2026-02-12 | 13F | Wealthspire Advisors, LLC | 0 | -100,00 | 0 | |||||
| 2026-01-28 | 13F | Legacy Capital Group California, Inc. | 1.027 | 205 | ||||||
| 2026-04-02 | 13F | Ares Financial Consulting, LLC | 210 | 42 | ||||||
| 2026-02-13 | 13F | American Century Companies Inc | 396.603 | -4,79 | 79.273 | 15,97 | ||||
| 2026-02-17 | 13F | Jones Financial Companies Lllp | 54 | 575,00 | 11 | 900,00 | ||||
| 2026-02-13 | 13F | Quarry LP | 0 | -100,00 | 0 | |||||
| 2025-12-16 | 13F | Lindenwold Advisors | 1.470 | 241 | ||||||
| 2026-02-17 | 13F | Canada Pension Plan Investment Board | 26.400 | 0,76 | 5.277 | 22,73 | ||||
| 2026-02-03 | 13F | SummerHaven Investment Management, LLC | 7.183 | 0,00 | 1.436 | 21,82 | ||||
| 2026-01-20 | 13F | AdvisorNet Financial, Inc | 122 | 0,00 | 24 | 20,00 | ||||
| 2026-02-12 | 13F | Cloud Capital Management, LLC | 0 | -100,00 | 0 | |||||
| 2026-02-13 | 13F | Morgan Stanley | 146.199 | -15,11 | 29.222 | 3,40 | ||||
| 2026-01-16 | 13F | Ronald Blue Trust, Inc. | 184 | -25,51 | 37 | -10,00 | ||||
| 2026-02-13 | 13F | Squarepoint Ops LLC | Put | 5.200 | -83,33 | 1.039 | -79,70 | |||
| 2026-02-11 | 13F | Deutsche Bank Ag\ | 10.959 | -55,96 | 2.190 | -46,36 | ||||
| 2026-02-13 | 13F | Squarepoint Ops LLC | 1.590 | -83,62 | 318 | -80,09 | ||||
| 2026-02-09 | 13F | Royce & Associates Lp | 6.335 | 0,00 | 1.266 | 21,85 | ||||
| 2026-02-09 | 13F | Legal & General Group Plc | 23.051 | 2,75 | 4.607 | 25,16 | ||||
| 2026-02-13 | 13F | Squarepoint Ops LLC | Call | 3.600 | -60,44 | 720 | -51,84 | |||
| 2026-02-09 | 13F | Huntington National Bank | 0 | -100,00 | 0 | |||||
| 2026-02-17 | 13F | Creative Planning | 5.975 | 14,86 | 1.194 | 39,98 | ||||
| 2026-01-21 | 13F | Sound Income Strategies, LLC | 22 | 5 | ||||||
| 2026-02-06 | 13F | EverSource Wealth Advisors, LLC | 88 | 18,92 | 18 | 41,67 | ||||
| 2026-02-13 | 13F | Marshall Wace, Llp | 51.018 | 10.197 | ||||||
| 2026-02-17 | 13F | Janus Henderson Group Plc | 5.465 | 0,00 | 1.094 | 21,96 | ||||
| 2026-02-13 | 13F | Wells Fargo & Company/mn | 14.029 | 52,44 | 2.804 | 85,70 | ||||
| 2026-02-06 | 13F | Global Retirement Partners, LLC | 9 | 2 | ||||||
| 2026-02-10 | 13F | Bnp Paribas Arbitrage, Sa | 3.281 | -67,83 | 656 | -60,85 | ||||
| 2026-02-12 | 13F | Federation des caisses Desjardins du Quebec | 67 | 0,00 | 13 | 30,00 | ||||
| 2026-02-17 | 13F | PDT Partners, LLC | 64.497 | 37,33 | 12.892 | 67,29 | ||||
| 2026-02-13 | 13F | State Street Corp | 826.553 | -6,12 | 165.211 | 14,35 | ||||
| 2025-11-14 | 13F | Mount Yale Investment Advisors, LLC | 0 | -100,00 | 0 | -100,00 | ||||
| 2026-02-06 | 13F | FourThought Financial Partners, LLC | 0 | -100,00 | 0 | |||||
| 2026-02-19 | 13F | Invesco Ltd. | 41.468 | -6,17 | 8.289 | 14,30 | ||||
| 2026-02-13 | 13F | Public Sector Pension Investment Board | 0 | -100,00 | 0 | |||||
| 2026-02-17 | 13F | Point72 Asset Management, L.P. | Put | 6.800 | 1.359 | |||||
| 2026-02-11 | 13F | Simplex Trading, Llc | Call | 0 | -100,00 | 0 | ||||
| 2026-02-17 | 13F | Point72 Asset Management, L.P. | Call | 6.800 | 1.359 | |||||
| 2026-04-08 | 13F | Hardin Capital Partners, LLC | 1.000 | 205 | ||||||
| 2025-12-08 | 13F | NWF Advisory Services Inc. | Call | 200 | 27 | |||||
| 2026-02-17 | 13F | Advisory Services Network, LLC | 0 | -100,00 | 0 | |||||
| 2026-02-17 | 13F | Brevan Howard Capital Management LP | 3.906 | 781 | ||||||
| 2026-02-17 | 13F | Lighthouse Investment Partners, LLC | 0 | -100,00 | 0 | |||||
| 2026-01-30 | 13F | Mitsubishi UFJ Trust & Banking Corp | 8.591 | -19,26 | 1.717 | -1,60 | ||||
| 2026-02-05 | 13F | Thrivent Financial For Lutherans | 7.422 | -6,18 | 1 | 0,00 | ||||
| 2026-02-11 | 13F | CenterBook Partners LP | 3.161 | 632 | ||||||
| 2026-02-13 | 13F | Police & Firemen's Retirement System of New Jersey | 3.245 | 0,19 | 649 | 22,03 | ||||
| 2026-02-13 | 13F | SRS Capital Advisors, Inc. | 656 | -55,68 | 131 | -45,87 | ||||
| 2026-02-11 | 13F | Picton Mahoney Asset Management | 6 | 0,00 | 1 | |||||
| 2026-02-17 | 13F | Northern Trust Corp | 104.166 | -7,32 | 20.821 | 12,89 | ||||
| 2026-02-13 | 13F | Barclays Plc | 20.756 | -38,98 | 4.149 | -25,68 | ||||
| 2025-11-14 | 13F | Centiva Capital, LP | 0 | -100,00 | 0 | |||||
| 2025-10-15 | 13F | Pacer Advisors, Inc. | 0 | -100,00 | 0 | |||||
| 2026-04-08 | 13F | Wealth Enhancement Advisory Services, Llc | 1.427 | -29,74 | 299 | -30,54 | ||||
| 2026-01-29 | 13F | Vanguard Group Inc | 1.164.290 | -1,02 | 232.718 | 20,57 | ||||
| 2026-01-30 | 13F | Oakworth Capital, Inc. | 24 | 0,00 | 5 | 33,33 | ||||
| 2026-02-06 | 13F | Envestnet Portfolio Solutions, Inc. | 3.907 | 2,04 | 781 | 24,20 | ||||
| 2026-02-06 | 13F | Leonteq Securities AG | 0 | -100,00 | 0 | |||||
| 2026-01-15 | 13F | Aquamarine Zurich AG | 0 | -100,00 | 0 | |||||
| 2026-02-13 | 13F | Resources Management Corp /ct/ /adv | 31 | 0,00 | 0 | |||||
| 2026-02-11 | 13F | Los Angeles Capital Management Llc | 145 | 23 | ||||||
| 2026-01-14 | 13F | Jfs Wealth Advisors, Llc | 7 | 75,00 | 1 | |||||
| 2025-11-21 | 13F | Bell Investment Advisors, Inc | 0 | -100,00 | 0 | |||||
| 2026-01-23 | 13F | State of Alaska, Department of Revenue | 5.975 | -0,10 | 1 | |||||
| 2026-02-17 | 13F | Cetera Investment Advisers | 2.018 | 19,13 | 403 | 45,49 | ||||
| 2025-11-10 | 13F | MAI Capital Management | 0 | -100,00 | 0 | |||||
| 2026-01-29 | 13F | Comerica Bank | 3.915 | -14,58 | 783 | 3,99 | ||||
| 2026-03-06 | 13F | Hsbc Holdings Plc | 2.570 | -28,91 | 509 | -13,58 | ||||
| 2026-02-13 | 13F | Bridgewater Associates, LP | 30.320 | 264,82 | 6.060 | 344,61 | ||||
| 2025-11-10 | 13F | Semanteon Capital Management, LP | 0 | -100,00 | 0 | |||||
| 2026-02-13 | 13F | Kestra Advisory Services, LLC | 550 | 110 | ||||||
| 2026-01-23 | 13F | Private Wealth Management Group, LLC | 31 | 0,00 | 6 | 20,00 | ||||
| 2026-02-02 | 13F | Bay Harbor Wealth Management, LLC | 1 | 0,00 | 0 | |||||
| 2025-11-13 | 13F | Fuller & Thaler Asset Management, Inc. | 0 | -100,00 | 0 | |||||
| 2026-02-17 | 13F | Price T Rowe Associates Inc /md/ | 111.526 | 1,21 | 22 | 22,22 | ||||
| 2026-02-06 | 13F | Keystone Financial Group | 0 | -100,00 | 0 | |||||
| 2026-02-11 | 13F | Winton Capital Group Ltd | 2.942 | 11,48 | 588 | 35,80 | ||||
| 2026-04-02 | 13F | Marex Group plc | 2.616 | 0,96 | 328 | -36,87 | ||||
| 2026-02-11 | 13F | Allianz Asset Management GmbH | 22.370 | 7,97 | 4.471 | 31,54 | ||||
| 2026-01-12 | 13F | Rialto Wealth Management, LLC | 1 | 0,00 | 0 | |||||
| 2026-02-10 | 13F | Connor, Clark & Lunn Investment Management Ltd. | 46.117 | 81,03 | 9.218 | 120,50 | ||||
| 2025-11-21 | 13F/A | CIBC Bancorp USA Inc. | 1.248 | 205 | ||||||
| 2026-01-27 | 13F | Financial Management Professionals, Inc. | 183 | 18,83 | 37 | 44,00 | ||||
| 2026-02-17 | 13F | Raymond James Financial Inc | 1.436 | 287 | ||||||
| 2025-10-31 | 13F | Y-Intercept (Hong Kong) Ltd | 0 | -100,00 | 0 | |||||
| 2026-02-05 | 13F | Allworth Financial LP | 42 | 10,53 | 8 | 33,33 | ||||
| 2026-02-13 | 13F | Citigroup Inc | 3.686 | -59,72 | 737 | -50,97 | ||||
| 2026-02-13 | 13F | Van Eck Associates Corp | 6.892 | 10,98 | 1 | 0,00 | ||||
| 2026-02-17 | 13F | Alliancebernstein L.p. | 13.010 | 14,02 | 2.600 | 38,89 | ||||
| 2025-11-13 | 13F/A | Cynosure Management, Llc | 3.338 | 0,00 | 548 | 45,87 | ||||
| 2026-02-13 | 13F | Oceanic Investment Management LTD | 4.266 | 853 | ||||||
| 2026-02-12 | 13F | Swiss National Bank | 21.900 | 1,86 | 4.377 | 24,10 | ||||
| 2026-02-17 | 13F | Susquehanna Portfolio Strategies, LLC | 36.254 | 0,00 | 7.246 | 21,82 | ||||
| 2026-02-12 | 13F | Voya Investment Management Llc | 7.209 | -3,01 | 1.441 | 18,13 | ||||
| 2026-01-14 | 13F | Wedge Capital Management L L P/nc | 5.104 | 6,31 | 1.020 | 29,61 | ||||
| 2026-02-18 | 13F | Vident Advisory, LLC | 2.253 | -33,68 | 450 | -19,21 | ||||
| 2025-11-13 | 13F | Jefferies Financial Group Inc. | 0 | -100,00 | 0 | |||||
| 2026-04-06 | 13F | Versant Capital Management, Inc | 113 | 3,67 | 23 | 9,52 | ||||
| 2026-02-11 | 13F | Jpmorgan Chase & Co | 98.018 | 6,85 | 19.592 | 30,16 | ||||
| 2025-11-17 | 13F | GWM Advisors LLC | 0 | -100,00 | 0 | |||||
| 2026-02-18 | 13F | First Citizens Bank & Trust Co | 4.058 | 1,81 | 811 | 24,01 | ||||
| 2026-02-13 | 13F | Victory Capital Management Inc | 1.568 | -64,19 | 313 | -56,41 | ||||
| 2026-02-17 | 13F | XTX Topco Ltd | 5.729 | 1.145 | ||||||
| 2026-04-10 | 13F | Abound Wealth Management | 0 | -100,00 | 0 | |||||
| 2026-03-03 | 13F/A | Caitong International Asset Management Co., Ltd | 71 | 36,54 | 14 | 75,00 | ||||
| 2026-02-12 | 13F | BlackRock, Inc. | 1.895.846 | 2,20 | 378.942 | 24,49 | ||||
| 2026-02-18 | 13F | Corecam AG | Call | 4.300 | 147 | |||||
| 2026-02-18 | 13F | Corecam AG | 2.185 | 437 | ||||||
| 2026-02-12 | 13F | Skopos Labs, Inc. | 3.943 | -27,26 | 810 | -9,00 | ||||
| 2026-02-17 | 13F | ExodusPoint Capital Management, LP | 0 | -100,00 | 0 | -100,00 | ||||
| 2026-02-17 | 13F | Boothbay Fund Management, Llc | 1.701 | 340 | ||||||
| 2026-02-17 | 13F | ISAM Funds (UK) Ltd | 0 | -100,00 | 0 | |||||
| 2026-02-03 | 13F | Denali Advisors Llc | 0 | -100,00 | 0 | |||||
| 2026-02-13 | 13F | JustInvest LLC | 1.134 | 227 | ||||||
| 2026-02-12 | 13F | State Board Of Administration Of Florida Retirement System | 3.405 | 0,00 | 681 | 21,86 | ||||
| 2026-04-08 | 13F | Systrade AG | 280.000 | 0,00 | 57.476 | 2,70 | ||||
| 2026-01-26 | 13F | Cwm, Llc | 274 | 11,38 | 0 | |||||
| 2026-01-28 | 13F | DekaBank Deutsche Girozentrale | 988 | 0,00 | 0 | |||||
| 2026-02-10 | 13F | Root Financial Partners, LLC | 46 | 43,75 | 9 | 80,00 | ||||
| 2026-02-10 | 13F | Mutual Of America Capital Management Llc | 1.234 | 0,49 | 247 | 22,39 | ||||
| 2026-02-05 | 13F | Bessemer Group Inc | 154 | 450,00 | 0 | |||||
| 2026-02-12 | 13F | Renaissance Technologies Llc | 611.915 | -10,78 | 122.310 | 8,69 | ||||
| 2026-02-17 | 13F | Two Sigma Investments, Lp | 3.750 | -92,43 | 750 | -90,79 | ||||
| 2026-02-09 | 13F | Ballast Asset Management, LP | 6.338 | 0,00 | 1.267 | 21,73 | ||||
| 2026-02-17 | 13F | Voloridge Investment Management, Llc | 0 | -100,00 | 0 | |||||
| 2026-02-17 | 13F | Old West Investment Management, LLC | 28.903 | 1,95 | 5.777 | 24,21 | ||||
| 2026-01-23 | 13F | Avion Wealth | 6 | 0,00 | 0 | |||||
| 2026-02-17 | 13F | Trexquant Investment LP | 15.854 | -67,82 | 3.169 | -60,81 | ||||
| 2026-02-17 | 13F | Dark Forest Capital Management Lp | 5.851 | -36,63 | 1.169 | -22,84 | ||||
| 2026-04-10 | 13F | Linden Thomas Advisory Services, LLC | 7.548 | 0,47 | 1.549 | 3,20 | ||||
| 2026-02-13 | 13F | Parkside Financial Bank & Trust | 10 | 0,00 | 2 | 0,00 | ||||
| 2026-02-13 | 13F | Kennondale Capital Management LLC | 12.312 | 29,49 | 2.461 | 57,69 | ||||
| 2026-02-17 | 13F | Ameriprise Financial Inc | 20.845 | -59,45 | 4.166 | -50,61 | ||||
| 2026-02-17 | 13F | Aster Capital Management (DIFC) Ltd | 224 | 45 | ||||||
| 2026-02-06 | 13F | Mraz, Amerine & Associates, Inc. | 26.439 | 78,98 | 5.285 | 118,08 | ||||
| 2026-02-03 | 13F | Bokf, Na | 2.143 | -12,57 | 428 | 6,47 | ||||
| 2025-11-12 | 13F | Close Asset Management Ltd | 0 | -100,00 | 0 | |||||
| 2026-02-03 | 13F | Farmers & Merchants Investments Inc | 8 | 0,00 | 2 | 0,00 | ||||
| 2026-02-09 | 13F | Hantz Financial Services, Inc. | 403 | 67,92 | 0 | |||||
| 2026-01-30 | 13F | Pekin Hardy Strauss, Inc. | 1.725 | 345 | ||||||
| 2026-02-17 | 13F | Jump Financial, LLC | 0 | -100,00 | 0 | |||||
| 2026-02-11 | 13F | Empowered Funds, LLC | 20.822 | 47,28 | 4.162 | 79,43 | ||||
| 2026-02-12 | 13F | BRYN MAWR TRUST Co | 0 | -100,00 | 0 | -100,00 | ||||
| 2026-02-13 | 13F | Rhumbline Advisers | 31.574 | -3,09 | 6.311 | 18,03 | ||||
| 2026-02-14 | 13F | Rockefeller Capital Management L.P. | 6 | -82,86 | 1 | -80,00 | ||||
| 2026-01-06 | 13F | Tucker Asset Management Llc | 0 | -100,00 | 0 | |||||
| 2026-02-17 | 13F | Quantinno Capital Management LP | 1.137 | 227 | ||||||
| 2026-02-12 | 13F | Pinnacle Holdings, LLC | 680 | -1,45 | 136 | 19,47 | ||||
| 2026-02-17 | 13F | Holocene Advisors, LP | 6.202 | 70,48 | 1.240 | 107,89 | ||||
| 2026-02-12 | 13F | Dimensional Fund Advisors Lp | 683.572 | 2,30 | 136.636 | 24,61 | ||||
| 2026-02-28 | 13F | Corecam Pte. Ltd. | 820 | 64,00 | 164 | 98,78 | ||||
| 2026-02-28 | 13F | Corecam Pte. Ltd. | Call | 21.300 | -47,54 | 730 | -10,66 | |||
| 2025-11-13 | 13F | Glenmede Investment Management, LP | 0 | -100,00 | 0 | |||||
| 2026-02-10 | 13F | Goldman Sachs Group Inc | 47.406 | 11,19 | 9.476 | 35,43 | ||||
| 2026-02-12 | 13F | South Dakota Investment Council | 3.258 | 0,00 | 1 | |||||
| 2026-01-23 | 13F | Assetmark, Inc | 2 | 0 | ||||||
| 2026-03-12 | 13F/A | Peak6 Llc | Call | 42.200 | -20,68 | 8.435 | -3,38 | |||
| 2026-01-09 | 13F | SG Americas Securities, LLC | 18.914 | 712,11 | 4 | |||||
| 2026-03-12 | 13F/A | Peak6 Llc | 8.917 | 469,05 | 1.782 | 593,39 | ||||
| 2026-01-27 | 13F | Mainstay Capital Management Llc /adv | 1.326 | 5,91 | 265 | 29,27 | ||||
| 2026-03-12 | 13F/A | Peak6 Llc | Put | 2.500 | -83,33 | 500 | -79,72 | |||
| 2026-02-11 | 13F | Gilpin Wealth Management, Llc | 1 | 0 | ||||||
| 2026-02-17 | 13F | Capstone Investment Advisors, Llc | 2.997 | 599 | ||||||
| 2026-02-12 | 13F | CIBC Private Wealth Group, LLC | 2 | 0 | ||||||
| 2026-01-28 | 13F | Geneos Wealth Management Inc. | 59 | 0,00 | 12 | 22,22 | ||||
| 2026-02-13 | 13F | Smartleaf Asset Management LLC | 219 | 23,03 | 44 | 51,72 | ||||
| 2026-02-09 | 13F | Keating Financial Advisory Services, Inc. | 7 | 1 | ||||||
| 2026-02-10 | 13F | Rothschild Investment Llc | 24 | 4,35 | 5 | 33,33 | ||||
| 2026-02-17 | 13F | Maryland State Retirement & Pension System | 1.576 | 0,00 | 315 | 22,09 | ||||
| 2026-02-11 | 13F | Simplex Trading, Llc | Put | 0 | -100,00 | 0 | ||||
| 2026-02-05 | 13F | Amalgamated Bank | 3.168 | -2,01 | 1 | |||||
| 2026-02-06 | 13F | Investment House Llc | 12.376 | 0,28 | 2.474 | 22,12 | ||||
| 2026-02-13 | 13F | Kettle Hill Capital Management, Llc | 24.127 | 4.823 | ||||||
| 2026-02-10 | 13F | Measured Wealth Private Client Group, LLC | 4 | 0,00 | 1 | |||||
| 2026-02-12 | 13F | Hrt Financial Lp | 0 | -100,00 | 0 | |||||
| 2026-02-13 | 13F | Colony Group, LLC | 1.092 | 215 | ||||||
| 2026-02-06 | 13F | Bare Financial Services, Inc | 16 | 3 | ||||||
| 2026-02-13 | 13F | BNP Paribas Asset Management Holding S.A. | 62 | 55,00 | 0 | |||||
| 2026-02-13 | 13F | Marnell Management LLC | 5.584 | 1.116 | ||||||
| 2025-10-24 | 13F | Opal Wealth Advisors, LLC | 0 | -100,00 | 0 | |||||
| 2026-02-10 | 13F | Intech Investment Management Llc | 4.965 | -14,29 | 992 | 4,42 | ||||
| 2026-02-17 | 13F | Algert Global Llc | 2.640 | -62,45 | 1 | -100,00 | ||||
| 2026-02-11 | 13F | Ameritas Investment Partners, Inc. | 978 | 195 | ||||||
| 2026-02-17 | 13F | Millennium Management Llc | 102.662 | 11,60 | 20.520 | 35,94 | ||||
| 2026-02-02 | 13F | Mutual Advisors, LLC | 7.544 | 0,01 | 1.508 | 28,04 | ||||
| 2026-02-09 | 13F | Quest Partners LLC | 3.457 | 9,23 | 691 | 32,95 | ||||
| 2026-02-02 | 13F | Principal Financial Group Inc | 51.569 | -2,74 | 10.308 | 18,47 | ||||
| 2026-02-17 | 13F | Quadrature Capital Ltd | 8.704 | 1.740 | ||||||
| 2026-02-12 | 13F | Quadrant Capital Group Llc | 122 | 11,93 | 24 | 41,18 | ||||
| 2026-02-13 | 13F | Alerus Financial Na | 28 | 0,00 | 6 | 25,00 | ||||
| 2026-01-28 | 13F | Arizona State Retirement System | 3.102 | -5,51 | 620 | 15,24 | ||||
| 2025-11-06 | 13F | REAP Financial Group, LLC | 0 | -100,00 | 0 | -100,00 | ||||
| 2026-02-12 | 13F | Advisors Asset Management, Inc. | 42 | 0,00 | 8 | 33,33 | ||||
| 2026-01-21 | 13F | SJS Investment Consulting Inc. | 1 | 0,00 | 0 | |||||
| 2026-02-17 | 13F | Optiver Holding B.V. | 0 | -100,00 | 0 | |||||
| 2026-01-15 | 13F | Fortitude Family Office, LLC | 4 | -33,33 | 1 | |||||
| 2026-02-13 | 13F | Walleye Capital LLC | Put | 6.500 | -13,33 | 1.299 | 5,61 | |||
| 2026-02-10 | 13F | Bruce G. Allen Investments, LLC | 2 | 0,00 | 0 | |||||
| 2026-02-11 | 13F | Simplex Trading, Llc | 0 | -100,00 | 0 | |||||
| 2026-02-06 | 13F | Pnc Financial Services Group, Inc. | 395 | 3,95 | 79 | 25,81 | ||||
| 2026-02-13 | 13F | Walleye Capital LLC | 1.923 | -35,27 | 384 | -21,15 | ||||
| 2026-02-13 | 13F | Walleye Capital LLC | Call | 2.900 | 61,11 | 580 | 96,27 | |||
| 2026-02-17 | 13F | LMR Partners LLP | 0 | -100,00 | 0 | |||||
| 2025-10-27 | 13F | Td Private Client Wealth Llc | 0 | -100,00 | 0 | |||||
| 2026-02-06 | 13F | Larson Financial Group LLC | 1.040 | 1,76 | 208 | 23,95 | ||||
| 2026-02-10 | 13F | Nomura Asset Management Co Ltd | 200 | 0,00 | 40 | 21,88 | ||||
| 2026-02-13 | 13F | Gendell Jeffrey L | 494.072 | 4,01 | 98.755 | 26,69 | ||||
| 2026-02-06 | 13F | IFP Advisors, Inc | 38 | 8,57 | 8 | 40,00 | ||||
| 2026-02-02 | 13F | Strs Ohio | 3.400 | -33,33 | 680 | -18,78 | ||||
| 2026-02-11 | 13F | Illinois Municipal Retirement Fund | 5.295 | -12,07 | 1.058 | 7,09 |