Grundlæggende statistik
| Institutionelle ejere | 172 total, 162 long only, 1 short only, 9 long/short - change of -1,55% MRQ |
| Gennemsnitlig porteføljeallokering | 0.7509 % - change of -34,06% MRQ |
| Institutionelle aktier (lange) | 60.533.467 (ex 13D/G) - change of 0,26MM shares 0,09% MRQ |
| Institutionel værdi (lang) | $ 1.267.570 USD ($1000) |
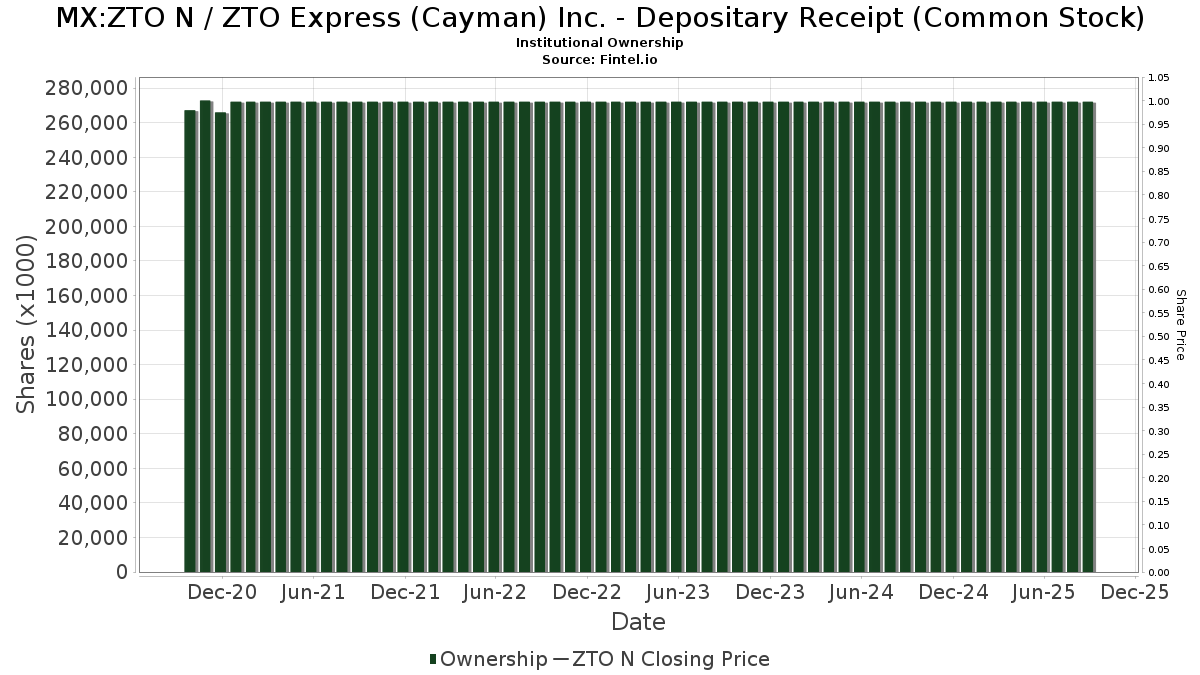
Institutionelt ejerskab og aktionærer
ZTO Express (Cayman) Inc. - Depositary Receipt (Common Stock) (MX:ZTO N) har 172 institutionelle ejere og aktionærer, der har indsendt 13D/G- eller 13F-formularer til Securities Exchange Commission (SEC). Disse institutioner har i alt 60,533,467 aktier. Største aktionærer omfatter Pzena Investment Management Llc, Temasek Holdings (Private) Ltd, Goldman Sachs Group Inc, Morgan Stanley, Serenity Capital Management Pte. Ltd., Fisher Asset Management, LLC, UBS Group AG, Platinum Investment Management Ltd, Citigroup Inc, and Todd Asset Management Llc .
ZTO Express (Cayman) Inc. - Depositary Receipt (Common Stock) (BMV:ZTO N) institutionel ejerskabsstruktur viser aktuelle positioner i virksomheden efter institutioner og fonde, samt seneste ændringer i positionsstørrelse. Større aktionærer kan omfatte individuelle investorer, investeringsforeninger, hedgefonde eller institutioner. Skema 13D angiver, at investoren besidder (eller besidder) mere end 5 % af virksomheden og har til hensigt (eller har til hensigt at) aktivt at forfølge en ændring i forretningsstrategi. Skema 13G indikerer en passiv investering på over 5%.
Fondens stemningsscore
Fund Sentiment Score (fka Ownership Accumulation Score) finder de aktier, der bliver mest købt af fonde. Det er resultatet af en sofistikeret, multi-faktor kvantitativ model, der identificerer virksomheder med de højeste niveauer af institutionel akkumulering. Scoringsmodellen bruger en kombination af den samlede stigning i oplyste ejere, ændringerne i porteføljeallokeringer i disse ejere og andre målinger. Tallet går fra 0 til 100, hvor højere tal indikerer et højere niveau af akkumulering for sine jævnaldrende, og 50 er gennemsnittet.
Opdateringsfrekvens: Dagligt
Se Ownership Explorer, som giver en liste over højest rangerende virksomheder.
AI+ Ask Fintel’s AI assistant about ZTO Express (Cayman) Inc. - Depositary Receipt (Common Stock).
Select a question to share a public post with an AI-crafted answer.
Thinking of good questions…
13F og NPORT arkivering
Detaljer om 13F-arkivering er gratis. Detaljer om NP-ansøgninger kræver et premium-medlemskab. Grønne rækker angiver nye positioner. Røde rækker angiver lukkede positioner. Klik på linket ikon for at se den fulde transaktionshistorik.
Opgrader
for at låse premium-data op og eksportere til Excel ![]() .
.
| Fil dato | Kilde | Investor | Type | Gennemsnitlig pris (Øst) |
Aktier | Δ Aktier (%) |
Rapporteret Værdi ($1000) |
Δ Værdi (%) |
Port Alloc (%) |
|
|---|---|---|---|---|---|---|---|---|---|---|
| 2026-02-13 | 13F | American Century Companies Inc | 986.025 | 0,00 | 20.598 | 8,81 | ||||
| 2026-02-13 | 13F | Wells Fargo & Company/mn | 1.951 | -9,04 | 41 | -2,44 | ||||
| 2026-02-11 | 13F | Brandes Investment Partners, Lp | 115.699 | 1,70 | 2.417 | 10,62 | ||||
| 2026-04-29 | 13F | Skopos Labs, Inc. | 38.527 | 22,24 | 970 | 45,50 | ||||
| 2026-02-13 | 13F | Pinnacle Wealth Planning Services, Inc. | 508 | 11 | ||||||
| 2026-02-13 | 13F | Marshall Wace, Llp | 128.826 | 2.691 | ||||||
| 2026-04-21 | 13F | SmartHarvest Portfolios, LLC | 10.399 | 262 | ||||||
| 2026-04-20 | 13F | Jfs Wealth Advisors, Llc | 187 | 0,00 | 5 | 33,33 | ||||
| 2026-02-19 | 13F | Invesco Ltd. | 197.679 | 32,39 | 4.130 | 44,07 | ||||
| 2026-04-21 | 13F | PDS Planning, Inc | 8.566 | 216 | ||||||
| 2025-11-13 | 13F | Connor, Clark & Lunn Investment Management Ltd. | 0 | -100,00 | 0 | -100,00 | ||||
| 2026-01-29 | 13F | Teachers Retirement System Of The State Of Kentucky | 1.077.250 | 20,28 | 23 | 29,41 | ||||
| 2026-04-27 | 13F | Qrg Capital Management, Inc. | 25.944 | 653 | ||||||
| 2026-02-09 | 13F | Legal & General Group Plc | 1.606.574 | -2,30 | 33.569 | 6,36 | ||||
| 2026-02-17 | 13F | SIH Partners, LLLP | 401.550 | -8,33 | 8.388 | -0,26 | ||||
| 2026-02-17 | 13F | Silvercrest Asset Management Group Llc | 180.364 | 0,47 | 3.768 | 9,32 | ||||
| 2026-04-24 | 13F | Pzena Investment Management Llc | 7.460.931 | -1,58 | 187.792 | 18,59 | ||||
| 2026-02-11 | 13F | Erste Asset Management GmbH | 0 | -100,00 | 0 | -100,00 | ||||
| 2026-04-22 | 13F | Spire Wealth Management | 350 | 0,00 | 9 | 14,29 | ||||
| 2026-02-06 | 13F | Pnc Financial Services Group, Inc. | 15.591 | -1,81 | 326 | 6,91 | ||||
| 2026-02-17 | 13F | Point72 Asset Management, L.P. | 1.091.234 | 22.796 | ||||||
| 2026-02-13 | 13F | Transamerica Financial Advisors, Inc. | 8 | 0 | ||||||
| 2026-02-17 | 13F | Parallax Volatility Advisers, L.P. | Call | 0 | -100,00 | 0 | ||||
| 2026-01-23 | 13F | Rsm Us Wealth Management Llc | 0 | -100,00 | 0 | |||||
| 2026-02-12 | 13F | Principal Securities, Inc. | 0 | -100,00 | 0 | |||||
| 2026-04-24 | 13F | Profund Advisors Llc | 57.857 | -0,61 | 1.456 | 19,74 | ||||
| 2025-11-14 | 13F | Verition Fund Management LLC | 0 | -100,00 | 0 | -100,00 | ||||
| 2026-02-09 | 13F | Fisher Asset Management, LLC | 3.553.206 | -0,39 | 74.226 | 8,38 | ||||
| 2026-02-11 | 13F | Simplex Trading, Llc | Put | 81.500 | -19,47 | 1.703 | 170.100,00 | |||
| 2026-02-06 | 13F | Gsa Capital Partners Llp | 17.633 | 0 | ||||||
| 2026-02-11 | 13F | Simplex Trading, Llc | 564 | -99,11 | 12 | 1.000,00 | ||||
| 2026-02-11 | 13F | Parallel Advisors, LLC | 3.330 | -9,21 | 70 | -1,43 | ||||
| 2026-01-22 | 13F | Pinnacle Bancorp, Inc. | 0 | -100,00 | 0 | |||||
| 2026-02-12 | 13F | Aviva Plc | 264.156 | -2,99 | 5.518 | 5,55 | ||||
| 2026-02-13 | 13F | Squarepoint Ops LLC | Put | 0 | -100,00 | 0 | -100,00 | |||
| 2026-02-19 | 13F | CI Private Wealth, LLC | 10.562 | 219 | ||||||
| 2025-11-14 | 13F | Jain Global LLC | 0 | -100,00 | 0 | |||||
| 2026-02-11 | 13F | Simplex Trading, Llc | Call | 27.800 | -13,12 | 581 | ||||
| 2026-02-12 | 13F | BlackRock, Inc. | 373.345 | -14,87 | 7.799 | -7,36 | ||||
| 2026-02-13 | 13F | Peak6 Llc | 0 | -100,00 | 0 | |||||
| 2026-02-17 | 13F | Susquehanna International Group, Llp | Put | 154.600 | 9,80 | 3.230 | 19,46 | |||
| 2026-02-17 | 13F | Susquehanna International Group, Llp | Call | 276.200 | -18,09 | 5.770 | -10,89 | |||
| 2026-04-22 | 13F | Stone House Investment Management, LLC | 113 | 276,67 | 3 | |||||
| 2026-02-10 | 13F | Savant Capital, LLC | 19.898 | 4,06 | 416 | 13,08 | ||||
| 2026-02-17 | 13F | Delaware Management Holdings, Inc. | 21.996 | 459 | ||||||
| 2026-04-02 | 13F | Marex Group plc | 0 | 0 | ||||||
| 2026-02-10 | 13F | Bnp Paribas Arbitrage, Sa | 768.626 | 30,11 | 16.057 | 41,56 | ||||
| 2025-11-19 | 13F/A | Danske Bank A/s | 0 | -100,00 | 0 | -100,00 | ||||
| 2026-04-14 | 13F | Drive Wealth Management, Llc | 10.595 | 267 | ||||||
| 2026-02-17 | 13F | Qube Research & Technologies Ltd | 0 | -100,00 | 0 | |||||
| 2026-01-27 | 13F | First Horizon Corp | 624 | -70,17 | 13 | -67,50 | ||||
| 2026-01-27 | 13F | TD Waterhouse Canada Inc. | 61 | 0,00 | 1 | 0,00 | ||||
| 2025-11-18 | 13F | Pictet Asset Management Holding SA | 0 | -100,00 | 0 | -100,00 | ||||
| 2026-02-13 | 13F | Macquarie Group Ltd | 35.318 | -57,60 | 738 | -52,14 | ||||
| 2025-11-14 | 13F | LMR Partners LLP | 0 | -100,00 | 0 | -100,00 | ||||
| 2026-03-06 | 13F | Hsbc Holdings Plc | Put | 0 | -100,00 | 0 | ||||
| 2026-04-08 | 13F | Legacy Wealth Asset Management, LLC | 0 | -100,00 | 0 | |||||
| 2026-02-03 | 13F | Manning & Napier Advisors Llc | 80.335 | -2,92 | 1.696 | 4,69 | ||||
| 2026-02-12 | 13F | Quadrant Capital Group Llc | 30.779 | -71,83 | 643 | -69,40 | ||||
| 2026-02-17 | 13F | Caption Management, LLC | 0 | -100,00 | 0 | |||||
| 2026-02-09 | 13F | Atlantic Trust, LLC | 0 | -100,00 | 0 | -100,00 | ||||
| 2026-02-13 | 13F | Citigroup Inc | 1.782.073 | 5,61 | 37.228 | 14,91 | ||||
| 2026-04-29 | 13F | Frank, Rimerman Advisors LLC | 12.553 | 316 | ||||||
| 2026-02-09 | 13F | Hantz Financial Services, Inc. | 21.014 | 73,04 | 0 | |||||
| 2026-02-13 | 13F | Citigroup Inc | Call | 100.000 | -90,48 | 2.089 | -89,64 | |||
| 2025-11-12 | 13F | NewSquare Capital LLC | 0 | -100,00 | 0 | |||||
| 2025-11-13 | 13F | UBS Group AG | Put | 0 | -100,00 | 0 | -100,00 | |||
| 2026-03-06 | 13F | Hsbc Holdings Plc | 249.469 | 33,38 | 5.211 | 45,29 | ||||
| 2026-04-27 | 13F | Leonteq Securities AG | 71 | -95,06 | 2 | -96,67 | ||||
| 2026-02-11 | 13F | Fox Run Management, L.l.c. | 0 | -100,00 | 0 | |||||
| 2026-02-17 | 13F | Harding Loevner Lp | 0 | -100,00 | 0 | |||||
| 2026-02-14 | 13F | Taikang Asset Management (Hong Kong) Co Ltd | 49.100 | 0,00 | 1.026 | 8,81 | ||||
| 2026-02-10 | 13F | Dumac, Inc. | 96.781 | 0,00 | 2.022 | 17,71 | ||||
| 2026-02-17 | 13F | Tower Research Capital LLC (TRC) | 2.544 | -65,98 | 53 | -62,94 | ||||
| 2025-11-17 | 13F | Pin Oak Investment Advisors Inc | 0 | -100,00 | 0 | |||||
| 2026-02-18 | 13F | Mackenzie Financial Corp | 446.411 | 24,24 | 9.405 | 36,32 | ||||
| 2026-02-12 | 13F | CIBC Private Wealth Group, LLC | 0 | -100,00 | 0 | -100,00 | ||||
| 2026-02-05 | 13F | Atria Investments Llc | 0 | -100,00 | 0 | |||||
| 2026-02-17 | 13F | Capitolis Liquid Global Markets LLC | 0 | -100,00 | 0 | |||||
| 2025-11-07 | 13F | Vanguard Group Inc | 0 | -100,00 | 0 | -100,00 | ||||
| 2026-04-07 | 13F | Farther Finance Advisors, LLC | 1.225 | 13,74 | 30 | 36,36 | ||||
| 2026-02-24 | 13F | MidFirst Bank | 502 | 2 | ||||||
| 2026-01-27 | 13F | WealthCollab, LLC | 99 | 2 | ||||||
| 2026-04-17 | 13F | Bell Investment Advisors, Inc | 116 | 46,84 | 3 | 100,00 | ||||
| 2026-02-13 | 13F | Stifel Financial Corp | 116.300 | 2,97 | 2.430 | 12,04 | ||||
| 2026-02-03 | 13F | Sequoia Financial Advisors, LLC | 19.141 | -31,13 | 400 | -25,14 | ||||
| 2026-02-10 | 13F | Envestnet Asset Management Inc | 183.384 | -68,45 | 3.831 | -65,68 | ||||
| 2026-01-28 | 13F | DekaBank Deutsche Girozentrale | 162.421 | 0,00 | 12 | 266,67 | ||||
| 2025-11-12 | 13F | Victory Capital Management Inc | 0 | -100,00 | 0 | |||||
| 2026-04-20 | 13F | Ronald Blue Trust, Inc. | 196 | 11,36 | 5 | 33,33 | ||||
| 2025-11-14 | 13F | Bnp Paribas | 0 | -100,00 | 0 | |||||
| 2026-02-17 | 13F | Creative Planning | 20.847 | 4,32 | 435 | 13,58 | ||||
| 2026-04-27 | 13F | Ethic Inc. | 17.123 | 7,40 | 431 | 29,13 | ||||
| 2025-11-12 | 13F | Bare Financial Services, Inc | 0 | -100,00 | 0 | |||||
| 2026-02-11 | 13F | O'shaughnessy Asset Management, Llc | 34.436 | 25,23 | 719 | 36,43 | ||||
| 2026-02-04 | 13F | Abc Arbitrage Sa | 10.397 | 217 | ||||||
| 2026-02-13 | 13F | State Street Corp | 981.894 | 2,80 | 20.512 | 10,13 | ||||
| 2026-02-09 | 13F | Todd Asset Management Llc | 1.697.019 | 17,85 | 35.451 | 28,22 | ||||
| 2026-02-13 | 13F | SRS Capital Advisors, Inc. | 82 | 2 | ||||||
| 2026-02-11 | 13F | Group One Trading, L.p. | Put | 35.100 | -88,99 | 733 | -88,03 | |||
| 2026-02-11 | 13F | Group One Trading, L.p. | Call | 211.000 | 4,15 | 4.408 | 13,32 | |||
| 2026-02-13 | 13F | Integrated Wealth Concepts LLC | 35.220 | 4,38 | 736 | 13,60 | ||||
| 2026-02-03 | 13F | Washington Trust Advisors, Inc. | 0 | -100,00 | 0 | |||||
| 2026-02-17 | 13F | Susquehanna International Group, Llp | 0 | -100,00 | 0 | |||||
| 2026-02-12 | 13F | Advisors Asset Management, Inc. | 34.468 | 25,34 | 720 | 36,62 | ||||
| 2026-02-02 | 13F | Oppenheimer Asset Management Inc. | 0 | -100,00 | 0 | |||||
| 2026-02-17 | 13F | XTX Topco Ltd | 10.014 | 209 | ||||||
| 2026-02-17 | 13F | Citadel Advisors Llc | Put | 21.000 | -56,61 | 439 | -52,85 | |||
| 2026-02-17 | 13F | Citadel Advisors Llc | Call | 53.800 | -56,37 | 1.124 | -52,56 | |||
| 2025-11-14 | 13F | Lazard Asset Management Llc | 0 | -100,00 | 0 | |||||
| 2026-02-02 | 13F | Fifth Third Bancorp | 23.794 | -66,01 | 497 | -62,99 | ||||
| 2026-02-17 | 13F | Citadel Advisors Llc | 966.784 | 4.255,08 | 20.196 | 4.640,85 | ||||
| 2026-02-12 | 13F | Brinker Capital Investments, LLC | 9.775 | -33,13 | 204 | -27,14 | ||||
| 2026-02-12 | 13F | XY Capital Ltd | 0 | -100,00 | 0 | |||||
| 2026-04-24 | 13F | Yousif Capital Management, Llc | 9.504 | 0,00 | 239 | 13,81 | ||||
| 2026-01-12 | 13F | DAVENPORT & Co LLC | 0 | -100,00 | 0 | |||||
| 2026-02-13 | 13F | Walleye Trading LLC | Call | 500 | -98,75 | 10 | -98,70 | |||
| 2026-02-13 | 13F | Charles Schwab Investment Management Inc | 0 | -100,00 | 0 | |||||
| 2026-02-13 | 13F | Polymer Capital Management (HK) LTD | 0 | -100,00 | 0 | |||||
| 2026-03-23 | 13F/A | Barclays Plc | Put | 0 | -100,00 | 0 | -100,00 | |||
| 2026-01-15 | 13F | Nisa Investment Advisors, Llc | 85 | 2 | ||||||
| 2025-11-14 | 13F | Price T Rowe Associates Inc /md/ | 0 | -100,00 | 0 | -100,00 | ||||
| 2026-04-06 | 13F | Highline Wealth Partners Llc | 258 | 66,45 | 6 | 100,00 | ||||
| 2026-02-17 | 13F | Bank Of America Corp /de/ | 1.120.524 | 23.408 | 1.170.250,00 | |||||
| 2026-04-02 | 13F | Ares Financial Consulting, LLC | 23 | 0,00 | 1 | |||||
| 2026-02-11 | 13F | Deutsche Bank Ag\ | 10.572 | 0,00 | 221 | 8,91 | ||||
| 2026-02-12 | 13F | Jane Street Group, Llc | Call | 53.200 | -99,08 | 1.111 | -99,00 | |||
| 2026-02-12 | 13F | Jane Street Group, Llc | 285.380 | 5.962 | ||||||
| 2026-02-12 | 13F | Jane Street Group, Llc | Put | 230.700 | 12,76 | 4.819 | 22,68 | |||
| 2026-01-23 | 13F | Assetmark, Inc | 2.375 | 1.712,98 | 50 | 2.350,00 | ||||
| 2026-02-13 | 13F | Walleye Trading LLC | Put | 12.600 | 96,88 | 263 | 115,57 | |||
| 2026-02-13 | 13F | MAI Capital Management | 62 | 0,00 | 1 | 0,00 | ||||
| 2026-02-13 | 13F | Pinpoint Asset Management (Singapore) Pte. Ltd. | 10.863 | 227 | ||||||
| 2026-01-29 | 13F | Matthews International Capital Management Llc | 70.800 | 1.479 | ||||||
| 2026-02-17 | 13F | Temasek Holdings (Private) Ltd | 6.260.241 | -39,96 | 130.776 | -34,68 | ||||
| 2026-02-09 | 13F | Huntington National Bank | 2.930 | 12,05 | 61 | 22,00 | ||||
| 2026-04-29 | 13F | Swedbank AB | 123.880 | 0,00 | 3.118 | 20,53 | ||||
| 2026-02-10 | 13F | State of Wyoming | 3.480 | -7,94 | 73 | 0,00 | ||||
| 2026-01-26 | 13F | Mirae Asset Global Investments Co., Ltd. | 15.786 | 0,95 | 330 | 9,67 | ||||
| 2026-02-10 | 13F/A | Northwestern Mutual Wealth Management Co | 207 | 0,00 | 4 | 33,33 | ||||
| 2025-11-04 | 13F | Keybank National Association/oh | 0 | -100,00 | 0 | |||||
| 2026-02-13 | 13F | BNP Paribas Asset Management Holding S.A. | 23.007 | 0 | ||||||
| 2026-02-17 | 13F | Advisor Group Holdings, Inc. | 1.803 | 7,51 | 38 | 15,63 | ||||
| 2025-11-13 | 13F | Norges Bank | 0 | -100,00 | 0 | |||||
| 2025-11-14 | 13F | Bridgefront Capital, LLC | 0 | -100,00 | 0 | -100,00 | ||||
| 2026-02-06 | 13F | Larson Financial Group LLC | 1.313 | 15,78 | 27 | 28,57 | ||||
| 2026-02-13 | 13F | Panagora Asset Management Inc | 10.645 | 0,00 | 222 | 8,82 | ||||
| 2026-01-26 | 13F | KBC Group NV | 170.061 | 13,56 | 4 | 50,00 | ||||
| 2026-02-11 | 13F | OPTIMAS CAPITAL Ltd | 191.700 | 4.005 | ||||||
| 2026-02-17 | 13F | Royal Bank Of Canada | 69.550 | -59,72 | 1.453 | -56,18 | ||||
| 2026-02-14 | 13F | Rockefeller Capital Management L.P. | 10 | -76,19 | 0 | |||||
| 2026-04-07 | 13F | Signaturefd, Llc | 3.491 | 29,63 | 88 | 55,36 | ||||
| 2026-02-17 | 13F | Parallax Volatility Advisers, L.P. | 10.606 | 222 | ||||||
| 2025-11-14 | 13F | Hillhouse Capital Advisors, Ltd. | 0 | -100,00 | 0 | |||||
| 2026-04-15 | 13F | Merit Financial Group, LLC | 8.821 | 222 | ||||||
| 2026-02-13 | 13F | Arrowstreet Capital, Limited Partnership | 57.274 | 1.196 | ||||||
| 2026-02-02 | 13F | Truist Financial Corp | 0 | -100,00 | 0 | |||||
| 2026-02-26 | 13F/A | Sculptor Capital LP | 0 | -100,00 | 0 | |||||
| 2026-02-26 | 13F/A | Sculptor Capital LP | Put | 0 | -100,00 | 0 | ||||
| 2026-02-12 | 13F | Rossby Financial, LCC | 2 | 0,00 | 0 | |||||
| 2026-02-06 | 13F | EverSource Wealth Advisors, LLC | 5.684 | 7,81 | 119 | 16,83 | ||||
| 2026-04-21 | 13F | Financial Consulate, Inc | 394 | 10 | ||||||
| 2025-11-14 | 13F | Two Sigma Securities, Llc | 0 | -100,00 | 0 | |||||
| 2026-03-05 | 13F/A | Banco Santander, S.A. | 0 | -100,00 | 0 | |||||
| 2025-11-13 | 13F | Healthcare Of Ontario Pension Plan Trust Fund | 0 | -100,00 | 0 | |||||
| 2026-02-12 | 13F | Pitcairn Co | 0 | -100,00 | 0 | |||||
| 2026-02-18 | 13F | Vident Advisory, LLC | 55.995 | 3,29 | 1.170 | 12,40 | ||||
| 2026-02-10 | 13F | Goldman Sachs Group Inc | Put | 357.600 | 147,13 | 7.470 | 168,90 | |||
| 2026-02-17 | 13F | Ameriprise Financial Inc | 11.700 | 244 | ||||||
| 2026-02-17 | 13F | Advisory Services Network, LLC | 0 | -100,00 | 0 | |||||
| 2026-02-10 | 13F | Goldman Sachs Group Inc | 6.040.543 | -5,76 | 126.187 | 2,54 | ||||
| 2026-02-17 | 13F | D. E. Shaw & Co., Inc. | 99.594 | 9,83 | 2.081 | 19,47 | ||||
| 2026-02-10 | 13F | Goldman Sachs Group Inc | Call | 301.600 | 50,42 | 6.300 | 63,68 | |||
| 2026-01-30 | 13F | State of New Jersey Common Pension Fund D | 509.092 | 0,00 | 10.635 | 8,80 | ||||
| 2026-02-13 | 13F | Morgan Stanley | 5.459.308 | 1,29 | 114.045 | 10,21 | ||||
| 2026-02-04 | 13F | LRI Investments, LLC | 0 | -100,00 | 0 | |||||
| 2026-02-06 | 13F | Global Retirement Partners, LLC | 12.735 | 266 | ||||||
| 2026-02-10 | 13F | Quantbot Technologies LP | 1.275 | 27 | ||||||
| 2026-02-13 | 13F | Flow Traders U.s. Llc | 0 | -100,00 | 0 | |||||
| 2026-02-13 | 13F | Squarepoint Ops LLC | 82.176 | 1.717 | ||||||
| 2026-02-13 | 13F | Rhumbline Advisers | 1.255 | 0,00 | 26 | 8,33 | ||||
| 2026-02-12 | 13F | Barometer Capital Management Inc. | 0 | -100,00 | 0 | |||||
| 2026-04-10 | 13F | Abound Wealth Management | 7 | 0,00 | 0 | |||||
| 2026-02-12 | 13F | Bank Of Montreal /can/ | 38.837 | -51,98 | 811 | -47,74 | ||||
| 2026-04-27 | 13F | Y-Intercept (Hong Kong) Ltd | 0 | -100,00 | 0 | |||||
| 2026-01-16 | 13F | TB Alternative Assets Ltd. | 0 | -100,00 | 0 | |||||
| 2026-02-02 | 13F | Wolverine Asset Management Llc | Put | 0 | -100,00 | 0 | -100,00 | |||
| 2026-01-28 | 13F | U S Global Investors Inc | 14.992 | 1,54 | 313 | 10,60 | ||||
| 2026-02-17 | 13F | Prelude Capital Management, Llc | 24.400 | 510 | ||||||
| 2026-02-05 | 13F | Allworth Financial LP | 1.360 | 1,04 | 28 | 12,00 | ||||
| 2026-02-17 | 13F | Millennium Management Llc | 143.160 | 765,75 | 2.991 | 843,22 | ||||
| 2026-04-24 | 13F | UMA Financial Services, Inc. | 103 | -26,43 | 3 | 0,00 | ||||
| 2026-04-27 | 13F | Td Private Client Wealth Llc | 7.643 | 960,06 | 192 | 1.180,00 | ||||
| 2026-02-17 | 13F | Laird Norton Trust Company, Llc | 11.849 | 248 | ||||||
| 2026-02-17 | 13F | Northern Trust Corp | 34.173 | -89,71 | 714 | -88,82 | ||||
| 2026-04-01 | 13F | Confluence Investment Management Llc | 12.540 | 3,21 | 316 | 24,51 | ||||
| 2026-03-03 | 13F/A | Caitong International Asset Management Co., Ltd | 2.020 | 42 | ||||||
| 2026-04-24 | 13F | Root Financial Partners, LLC | 23 | 1 | ||||||
| 2026-04-28 | 13F | SBI Securities Co., Ltd. | 512 | 293,85 | 13 | 500,00 | ||||
| 2025-11-06 | 13F | Midwest Trust Co | 0 | -100,00 | 0 | -100,00 | ||||
| 2026-02-13 | 13F | Umb Bank N A/mo | 0 | -100,00 | 0 | |||||
| 2026-01-27 | 13F | Proffitt & Goodson Inc | 0 | -100,00 | 0 | |||||
| 2026-02-17 | 13F | Captrust Financial Advisors | 0 | -100,00 | 0 | |||||
| 2025-11-04 | 13F | High Note Wealth, LLC | 0 | -100,00 | 0 | |||||
| 2026-02-05 | 13F | DnB Asset Management AS | 40.764 | 18,93 | 852 | 29,33 | ||||
| 2026-02-12 | 13F | Renaissance Technologies Llc | 123.700 | -61,34 | 2.584 | -57,94 | ||||
| 2026-02-02 | 13F | One Wealth Advisors, LLC | 0 | -100,00 | 0 | |||||
| 2026-01-29 | 13F | IMC-Chicago, LLC | Put | 34.900 | 15,95 | 729 | 26,34 | |||
| 2026-01-29 | 13F | IMC-Chicago, LLC | Call | 74.700 | 293,16 | 1.560 | 328,57 | |||
| 2026-02-17 | 13F | Fmr Llc | 7.670 | -12,98 | 160 | -5,33 | ||||
| 2026-02-17 | 13F | Schonfeld Strategic Advisors LLC | 0 | -100,00 | 0 | |||||
| 2025-11-13 | 13F | Jump Financial, LLC | 0 | -100,00 | 0 | -100,00 | ||||
| 2026-04-06 | 13F | Versant Capital Management, Inc | 81 | 2 | ||||||
| 2026-02-13 | 13F | Peak6 Llc | Call | 0 | -100,00 | 0 | ||||
| 2026-02-13 | 13F | Atlas Capital Advisors Llc | 1.675 | 35 | ||||||
| 2026-02-13 | 13F | Alberta Investment Management Corp | 0 | -100,00 | 0 | |||||
| 2026-02-13 | 13F | Icon Advisers Inc/co | 200.000 | 0,00 | 4.178 | 8,80 | ||||
| 2026-02-17 | 13F | Optiver Holding B.V. | 635 | 0,00 | 13 | 8,33 | ||||
| 2025-11-07 | 13F | Sierra Ocean, Llc | 0 | -100,00 | 0 | -100,00 | ||||
| 2026-02-17 | 13F | Russell Investments Group, Ltd. | 469.993 | 16,40 | 9.818 | 26,65 | ||||
| 2026-02-13 | 13F | Peak6 Llc | Put | 0 | -100,00 | 0 | ||||
| 2026-01-30 | 13F | Us Bancorp \de\ | 17.240 | -78,46 | 360 | -76,56 | ||||
| 2026-02-12 | 13F | Brown Brothers Harriman & Co | 0 | -100,00 | 0 | |||||
| 2026-02-13 | 13F | Smartleaf Asset Management LLC | 2.215 | 9,60 | 47 | 17,95 | ||||
| 2026-02-12 | 13F | Wealthspire Advisors, LLC | 0 | -100,00 | 0 | |||||
| 2026-02-13 | 13F | Platinum Investment Management Ltd | 1.994.127 | -11,20 | 41.657 | -3,39 | ||||
| 2025-11-17 | 13F | GWM Advisors LLC | 0 | -100,00 | 0 | |||||
| 2026-02-13 | 13F | JustInvest LLC | 30.198 | 16,75 | 631 | 27,02 | ||||
| 2026-02-11 | 13F | Jpmorgan Chase & Co | 517.484 | 1,84 | 10.810 | 10,80 | ||||
| 2026-02-12 | 13F | Campbell & CO Investment Adviser LLC | 0 | -100,00 | 0 | |||||
| 2026-04-13 | 13F | True Wealth Design, LLC | 157 | 23,62 | 4 | 50,00 | ||||
| 2026-02-12 | 13F | Hrt Financial Lp | 0 | -100,00 | 0 | |||||
| 2026-02-03 | 13F | Crossmark Global Holdings, Inc. | 642.163 | 4,80 | 13.415 | 14,03 | ||||
| 2025-11-13 | 13F | Canada Pension Plan Investment Board | 0 | -100,00 | 0 | -100,00 | ||||
| 2026-02-17 | 13F | Serenity Capital Management Pte. Ltd. | 5.056.987 | 0,00 | 105.640 | 8,80 | ||||
| 2026-02-17 | 13F | Dark Forest Capital Management Lp | 0 | -100,00 | 0 | |||||
| 2026-04-14 | 13F | Nbc Securities, Inc. | 31 | -34,04 | 1 | |||||
| 2026-02-17 | 13F | Engineers Gate Manager LP | 15.840 | 24,73 | 331 | 35,80 | ||||
| 2026-01-29 | 13F | UBS Group AG | Call | 1.258.380 | 0,00 | 26.288 | 8,80 | |||
| 2026-01-29 | 13F | UBS Group AG | 2.124.199 | -10,99 | 44.375 | -3,16 | ||||
| 2026-02-13 | 13F | Ubs Oconnor Llc | 0 | -100,00 | 0 | |||||
| 2026-01-27 | 13F | Regions Financial Corp | 0 | -100,00 | 0 | |||||
| 2026-01-08 | 13F | Tuttle Tactical Management LLC | 13.670 | 286 | ||||||
| 2026-02-17 | 13F | Jones Financial Companies Lllp | 0 | -100,00 | 0 | |||||
| 2026-02-17 | 13F | Himension Fund | 0 | -100,00 | 0 | |||||
| 2026-02-17 | 13F | Guggenheim Capital Llc | 45.316 | 17,32 | 947 | 27,67 | ||||
| 2026-02-17 | 13F | SageView Advisory Group, LLC | 113 | 2 | ||||||
| 2025-11-14 | 13F | Axa S.a. | 0 | -100,00 | 0 | -100,00 | ||||
| 2025-11-14 | 13F | AXA Investment Managers S.A. | 17.984 | 345 | ||||||
| 2026-02-12 | 13F | Callan Family Office, LLC | 0 | -100,00 | 0 | |||||
| 2026-02-13 | 13F | Sei Investments Co | 31.291 | -5,22 | 654 | 3,16 | ||||
| 2026-01-30 | 13F | Mitsubishi UFJ Trust & Banking Corp | 4.349 | 91 | ||||||
| 2026-02-04 | 13F | Ameritas Advisory Services, LLC | 0 | -100,00 | 0 | |||||
| 2026-04-16 | 13F | SG Americas Securities, LLC | 0 | -100,00 | 0 | |||||
| 2026-01-29 | 13F | Rakuten Securities, Inc. | 0 | -100,00 | 0 | |||||
| 2026-02-10 | 13F | Natixis Advisors, L.p. | 0 | -100,00 | 0 | -100,00 | ||||
| 2026-02-17 | 13F | Amundi | 10.441 | -17,49 | 218 | -10,29 | ||||
| 2026-02-12 | 13F | Federation des caisses Desjardins du Quebec | 0 | -100,00 | 0 | |||||
| 2026-02-03 | 13F | Virtus Family Office LLC | 246.923 | 1,34 | 5.158 | 8,57 | ||||
| 2026-02-17 | 13F | Quantinno Capital Management LP | 140.632 | 2.938 | ||||||
| 2025-11-14 | 13F | Wolverine Trading, Llc | Put | 16.000 | 10,34 | 313 | 21,79 | |||
| 2026-02-13 | 13F | Barclays Plc | 88.162 | 91,32 | 1.842 | 108,26 | ||||
| 2026-02-13 | 13F | Ieq Capital, Llc | 9.701 | 203 | ||||||
| 2026-02-06 | 13F | Vestmark Advisory Solutions, Inc. | 10.632 | 222 | ||||||
| 2026-02-13 | 13F | Aurora Investment Counsel | 153.811 | 2,93 | 3.213 | 11,99 | ||||
| 2026-02-13 | 13F | Neuberger Berman Group LLC | 0 | -100,00 | 0 | |||||
| 2026-02-13 | 13F | Royal London Asset Management Ltd | 31.070 | 15,63 | 649 | 26,02 | ||||
| 2026-04-27 | 13F | Portman Square Capital LLP | 80.506 | 2.026 | ||||||
| 2026-01-16 | 13F | Crewe Advisors LLC | 149 | 0,00 | 3 | 50,00 | ||||
| 2026-02-11 | 13F | LPL Financial LLC | 0 | -100,00 | 0 | |||||
| 2026-02-13 | 13F | Mariner, LLC | 92.720 | -10,31 | 1.937 | -2,37 | ||||
| 2026-04-23 | 13F | North Star Investment Management Corp. | 87 | 0,00 | 2 | 100,00 | ||||
| 2026-04-27 | 13F | Portman Square Capital LLP | Put | 551.400 | 13.879 | |||||
| 2025-11-14 | 13F | Raymond James Financial Inc | 0 | -100,00 | 0 | -100,00 | ||||
| 2026-01-26 | 13F | Cwm, Llc | 2.418 | 3,29 | 0 | |||||
| 2026-02-12 | 13F | Dimensional Fund Advisors Lp | 1.656.016 | 0,06 | 34.605 | 8,83 | ||||
| 2026-02-05 | 13F | Bessemer Group Inc | 14 | -93,07 | 0 | |||||
| 2026-02-13 | 13F | Ubs Asset Management Americas Inc | 113 | -99,06 | 2 | -99,13 | ||||
| 2026-02-12 | 13F | DRW Securities, LLC | 33.153 | 693 |