Grundlæggende statistik
| Institutionelle ejere | 134 total, 133 long only, 0 short only, 1 long/short - change of 0,00% MRQ |
| Gennemsnitlig porteføljeallokering | 0.1625 % - change of 108,34% MRQ |
| Institutionelle aktier (lange) | 62.948.639 (ex 13D/G) - change of 0,28MM shares 2,96% MRQ |
| Institutionel værdi (lang) | $ 578.843 USD ($1000) |
Institutionelt ejerskab og aktionærer
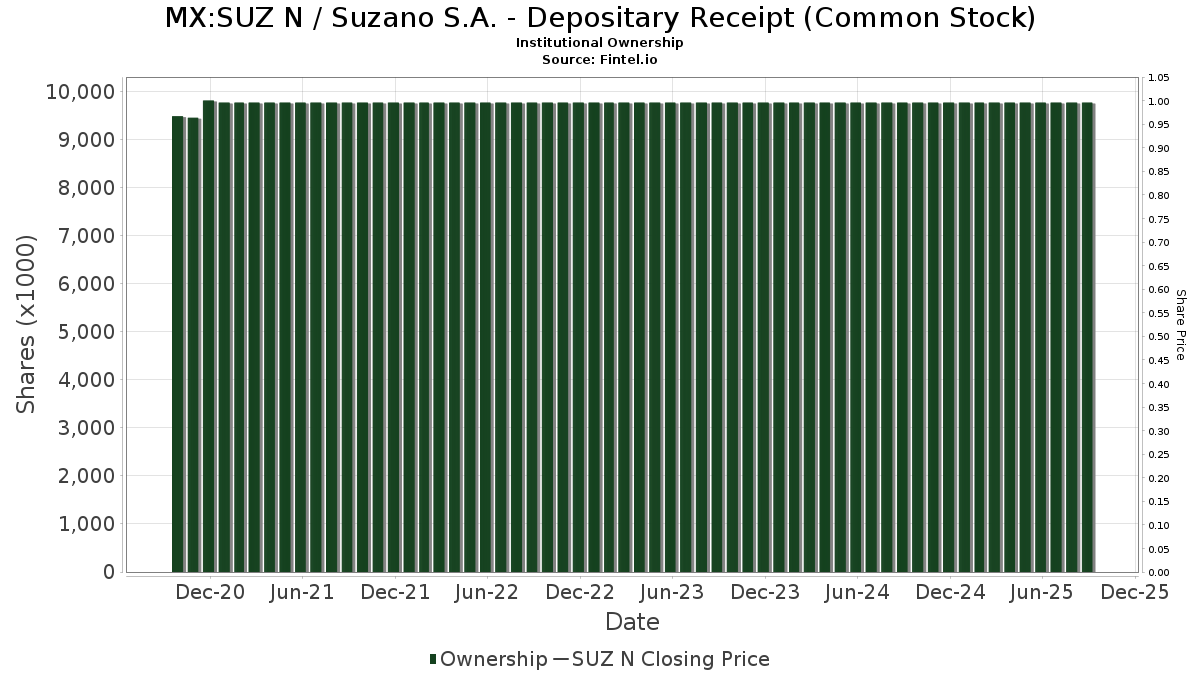
Suzano S.A. - Depositary Receipt (Common Stock) (MX:SUZ N) har 134 institutionelle ejere og aktionærer, der har indsendt 13D/G- eller 13F-formularer til Securities Exchange Commission (SEC). Disse institutioner har i alt 62,948,639 aktier. Største aktionærer omfatter Atlas FRM LLC, Deutsche Bank Ag\, State Street Corp, UBS Group AG, Goldman Sachs Group Inc, Morgan Stanley, Jpmorgan Chase & Co, American Century Companies Inc, Compass Rose Asset Management, LP, and Bank Of America Corp /de/ .
Suzano S.A. - Depositary Receipt (Common Stock) (BMV:SUZ N) institutionel ejerskabsstruktur viser aktuelle positioner i virksomheden efter institutioner og fonde, samt seneste ændringer i positionsstørrelse. Større aktionærer kan omfatte individuelle investorer, investeringsforeninger, hedgefonde eller institutioner. Skema 13D angiver, at investoren besidder (eller besidder) mere end 5 % af virksomheden og har til hensigt (eller har til hensigt at) aktivt at forfølge en ændring i forretningsstrategi. Skema 13G indikerer en passiv investering på over 5%.
Fondens stemningsscore
Fund Sentiment Score (fka Ownership Accumulation Score) finder de aktier, der bliver mest købt af fonde. Det er resultatet af en sofistikeret, multi-faktor kvantitativ model, der identificerer virksomheder med de højeste niveauer af institutionel akkumulering. Scoringsmodellen bruger en kombination af den samlede stigning i oplyste ejere, ændringerne i porteføljeallokeringer i disse ejere og andre målinger. Tallet går fra 0 til 100, hvor højere tal indikerer et højere niveau af akkumulering for sine jævnaldrende, og 50 er gennemsnittet.
Opdateringsfrekvens: Dagligt
Se Ownership Explorer, som giver en liste over højest rangerende virksomheder.
AI+ Ask Fintel’s AI assistant about Suzano S.A. - Depositary Receipt (Common Stock).
Select a question to share a public post with an AI-crafted answer.
Thinking of good questions…
13F og NPORT arkivering
Detaljer om 13F-arkivering er gratis. Detaljer om NP-ansøgninger kræver et premium-medlemskab. Grønne rækker angiver nye positioner. Røde rækker angiver lukkede positioner. Klik på linket ikon for at se den fulde transaktionshistorik.
Opgrader
for at låse premium-data op og eksportere til Excel ![]() .
.
| Fil dato | Kilde | Investor | Type | Gennemsnitlig pris (Øst) |
Aktier | Δ Aktier (%) |
Rapporteret Værdi ($1000) |
Δ Værdi (%) |
Port Alloc (%) |
|
|---|---|---|---|---|---|---|---|---|---|---|
| 2025-11-12 | 13F | Headlands Technologies LLC | 0 | -100,00 | 0 | -100,00 | ||||
| 2026-02-12 | 13F | Provida Pension Fund Administrator | 0 | -100,00 | 0 | -100,00 | ||||
| 2026-01-28 | 13F | Kapitalo Investimentos Ltda | 784.450 | 249,42 | 7.327 | 247,20 | ||||
| 2026-01-29 | 13F | Vanguard Group Inc | 42.045 | -22,04 | 393 | -22,53 | ||||
| 2025-11-14 | 13F | Wetherby Asset Management Inc | 30.365 | -3,26 | 285 | -3,39 | ||||
| 2026-04-16 | 13F | Diversified Trust Co | 26.993 | 270 | ||||||
| 2025-11-14 | 13F | Raymond James Financial Inc | 0 | -100,00 | 0 | -100,00 | ||||
| 2026-02-17 | 13F | Laird Norton Trust Company, Llc | 41.033 | 392 | ||||||
| 2026-01-16 | 13F | Standard Life Aberdeen plc | 113.099 | 1.056 | ||||||
| 2026-02-13 | 13F | Cullen Capital Management, LLC | 0 | -100,00 | 0 | |||||
| 2026-04-07 | 13F | Signaturefd, Llc | 5.027 | -2,95 | 50 | 4,17 | ||||
| 2026-02-12 | 13F | Banco BTG Pactual S.A. | 15.191 | 142 | ||||||
| 2026-02-13 | 13F | Mariner, LLC | 37.097 | 80,87 | 346 | 80,21 | ||||
| 2025-11-14 | 13F | Schonfeld Strategic Advisors LLC | 0 | -100,00 | 0 | |||||
| 2026-02-10 | 13F | Eurizon Capital SGR S.p.A. | 884 | 8 | ||||||
| 2026-04-20 | 13F | Ritholtz Wealth Management | 14.839 | 3,55 | 149 | 11,28 | ||||
| 2026-02-02 | 13F | Cornerstone Planning Group LLC | 16 | -72,41 | 0 | |||||
| 2026-02-03 | 13F | Crossmark Global Holdings, Inc. | 34.935 | 0,11 | 326 | -0,61 | ||||
| 2026-02-13 | 13F | Flow Traders U.s. Llc | 11.851 | 0 | ||||||
| 2025-11-14 | 13F | Jane Street Group, Llc | Call | 0 | -100,00 | 0 | -100,00 | |||
| 2026-02-02 | 13F | Qrg Capital Management, Inc. | 0 | -100,00 | 0 | |||||
| 2026-02-17 | 13F | MIRAE ASSET GLOBAL ETFS HOLDINGS Ltd. | 15.059 | -7,17 | 141 | -7,89 | ||||
| 2026-02-09 | 13F | Fisher Asset Management, LLC | 131.680 | -14,90 | 1.230 | -15,47 | ||||
| 2026-04-13 | 13F | True Wealth Design, LLC | 218 | 289,29 | 2 | |||||
| 2026-02-13 | 13F | Atlas Capital Advisors Llc | 2.341 | 0,00 | 22 | -4,55 | ||||
| 2026-01-26 | 13F | Mirae Asset Global Investments Co., Ltd. | 36.429 | 3,38 | 340 | 2,72 | ||||
| 2026-02-17 | 13F | Citadel Advisors Llc | Put | 0 | -100,00 | 0 | ||||
| 2026-01-27 | 13F | Waterfront Wealth Inc. | 396.495 | 2,08 | 3.921 | 12,74 | ||||
| 2026-02-12 | 13F | Quadrant Capital Group Llc | 60.735 | -32,41 | 567 | -32,82 | ||||
| 2026-02-13 | 13F | Morgan Stanley | 1.955.831 | 3,94 | 18.267 | 3,28 | ||||
| 2026-04-10 | 13F | Abound Wealth Management | 0 | -100,00 | 0 | |||||
| 2026-04-22 | 13F | Pictet Asset Management Holding SA | 66.006 | -20,77 | 661 | -15,17 | ||||
| 2026-02-06 | 13F | EverSource Wealth Advisors, LLC | 1.448 | -21,18 | 14 | -23,53 | ||||
| 2026-02-13 | 13F | State Street Corp | 5.667.599 | 17,48 | 54.086 | 19,27 | ||||
| 2025-11-14 | 13F | Credit Agricole S A | 0 | -100,00 | 0 | -100,00 | ||||
| 2026-03-03 | 13F/A | Caitong International Asset Management Co., Ltd | 6.994 | 18.802,70 | 65 | |||||
| 2026-02-12 | 13F | Campbell & CO Investment Adviser LLC | 29.871 | 37,00 | 279 | 36,27 | ||||
| 2026-02-05 | 13F | Allworth Financial LP | 401 | -11,09 | 4 | -25,00 | ||||
| 2026-02-13 | 13F | Itau Unibanco Holding S.A. | 828.449 | 0,00 | 7.735 | -0,68 | ||||
| 2026-02-12 | 13F | Renaissance Technologies Llc | 504.100 | 12,60 | 4.708 | 11,88 | ||||
| 2026-02-24 | 13F | Bell Investment Advisors, Inc | 0 | -100,00 | 0 | |||||
| 2026-02-17 | 13F | Balyasny Asset Management Llc | 729.969 | 51,72 | 6.818 | 50,75 | ||||
| 2026-01-29 | 13F | Sanctuary Advisors, LLC | 0 | -100,00 | 0 | -100,00 | ||||
| 2025-11-07 | 13F | Sierra Ocean, Llc | 0 | -100,00 | 0 | |||||
| 2026-04-24 | 13F | Root Financial Partners, LLC | 13 | 0 | ||||||
| 2026-02-13 | 13F | Bridgefront Capital, LLC | 0 | -100,00 | 0 | |||||
| 2026-02-17 | 13F | Tower Research Capital LLC (TRC) | 0 | -100,00 | 0 | |||||
| 2026-02-11 | 13F | Simplex Trading, Llc | 1.962 | -8,10 | 18 | |||||
| 2026-02-27 | 13F | Groupama Asset Managment | 30.716 | 1,67 | 287 | 1,06 | ||||
| 2026-04-20 | 13F | Ronald Blue Trust, Inc. | 2.347 | 0,00 | 23 | 9,52 | ||||
| 2026-02-13 | 13F | MAI Capital Management | 99 | 0,00 | 1 | |||||
| 2026-02-12 | 13F | BlackRock, Inc. | 682.803 | -24,06 | 6.377 | -24,54 | ||||
| 2026-04-20 | 13F | Jfs Wealth Advisors, Llc | 35 | -69,57 | 0 | -100,00 | ||||
| 2025-11-14 | 13F | Susquehanna International Group, Llp | Put | 0 | -100,00 | 0 | -100,00 | |||
| 2026-02-17 | 13F | Brevan Howard Capital Management LP | 0 | -100,00 | 0 | |||||
| 2026-02-17 | 13F | EFG International AG | 250.000 | 2.335 | ||||||
| 2026-02-17 | 13F | Two Sigma Advisers, Lp | 67.000 | -91,31 | 626 | -91,37 | ||||
| 2026-04-16 | 13F | SG Americas Securities, LLC | 0 | -100,00 | 0 | |||||
| 2026-02-11 | 13F | Compass Rose Asset Management, LP | 1.600.000 | 51,66 | 14.944 | 50,69 | ||||
| 2026-02-17 | 13F | Qube Research & Technologies Ltd | 84.906 | -80,45 | 793 | -80,57 | ||||
| 2026-04-21 | 13F | SmartHarvest Portfolios, LLC | 12.179 | 122 | ||||||
| 2026-02-18 | 13F | Vident Advisory, LLC | 16.427 | 19,49 | 153 | 18,60 | ||||
| 2026-04-06 | 13F | Versant Capital Management, Inc | 151 | 2 | ||||||
| 2026-02-06 | 13F | Pnc Financial Services Group, Inc. | 8.676 | -37,81 | 81 | -38,17 | ||||
| 2026-02-17 | 13F | Susquehanna International Group, Llp | 14.839 | 139 | ||||||
| 2026-02-17 | 13F | Susquehanna International Group, Llp | Call | 10.200 | 95 | |||||
| 2026-02-11 | 13F | Parallel Advisors, LLC | 5.438 | -41,78 | 51 | -42,53 | ||||
| 2026-02-17 | 13F | Citadel Advisors Llc | 18.676 | -61,95 | 174 | -62,26 | ||||
| 2026-02-13 | 13F | Van Eck Associates Corp | 65.180 | 6,09 | 1 | |||||
| 2026-02-13 | 13F | Citigroup Inc | 87.898 | -0,77 | 821 | -1,44 | ||||
| 2026-01-28 | 13F | DekaBank Deutsche Girozentrale | 778.866 | 0,00 | 10 | 28,57 | ||||
| 2026-02-10 | 13F | Savant Capital, LLC | 33.162 | 310 | ||||||
| 2026-02-13 | 13F | SPX Equities Gestao de Recursos Ltda | 115.964 | -19,59 | 1.083 | -20,07 | ||||
| 2026-02-17 | 13F | XTX Topco Ltd | 87.857 | 55,69 | 821 | 54,72 | ||||
| 2026-02-17 | 13F | Ameriprise Financial Inc | 13.297 | 127 | ||||||
| 2026-02-06 | 13F | Profund Advisors Llc | 17.570 | -41,65 | 164 | -42,05 | ||||
| 2026-02-13 | 13F | Centiva Capital, LP | 15.268 | -24,77 | 143 | -25,26 | ||||
| 2026-04-09 | 13F | Moody National Bank Trust Division | 33.666 | 0,00 | 337 | 7,01 | ||||
| 2026-01-23 | 13F | Robeco Institutional Asset Management B.V. | 0 | -100,00 | 0 | |||||
| 2026-02-05 | 13F | ANTIPODES PARTNERS Ltd | 196.114 | -1,01 | 1.832 | -1,66 | ||||
| 2026-02-06 | 13F | Global Retirement Partners, LLC | 0 | -100,00 | 0 | |||||
| 2026-02-17 | 13F | Advisor Group Holdings, Inc. | 101 | -31,76 | 1 | -100,00 | ||||
| 2026-02-11 | 13F | O'shaughnessy Asset Management, Llc | 84.177 | 100,20 | 786 | 98,99 | ||||
| 2026-02-12 | 13F | Dimensional Fund Advisors Lp | 357.462 | 14,53 | 3.339 | 13,81 | ||||
| 2026-01-23 | 13F | Assetmark, Inc | 644 | 501,87 | 6 | 500,00 | ||||
| 2026-01-26 | 13F | Cwm, Llc | 736 | -59,54 | 0 | |||||
| 2026-02-11 | 13F | Metis Global Partners, LLC | 354.829 | 12,98 | 3.314 | 12,26 | ||||
| 2025-11-14 | 13F | Binnacle Investments Inc | 47 | 0 | ||||||
| 2026-02-13 | 13F | Pathstone Holdings, LLC | 10.288 | 96 | ||||||
| 2026-02-17 | 13F | Aqr Capital Management Llc | 28.730 | 63,10 | 268 | 62,42 | ||||
| 2026-01-23 | 13F | Lester Murray Antman dba SimplyRich | 21.725 | -0,14 | 0 | |||||
| 2026-02-11 | 13F | Ramirez Asset Management, Inc. | 850.261 | 7.941 | ||||||
| 2026-02-13 | 13F | Barclays Plc | 10.650 | 0,00 | 99 | -1,00 | ||||
| 2026-02-13 | 13F | Marshall Wace, Llp | 75.279 | 703 | ||||||
| 2026-02-13 | 13F | VPR Management LLC | 33.605 | 0,00 | 314 | -0,63 | ||||
| 2026-02-17 | 13F | Royal Bank Of Canada | 99.444 | -81,47 | 929 | -81,59 | ||||
| 2026-01-30 | 13F | Us Bancorp \de\ | 6.107 | -92,99 | 57 | -93,04 | ||||
| 2026-02-13 | 13F | Parkside Financial Bank & Trust | 122 | 0,00 | 1 | 0,00 | ||||
| 2026-02-12 | 13F | Jane Street Group, Llc | 231.499 | 100,84 | 2.162 | 99,63 | ||||
| 2026-02-23 | 13F | Virtu Financial LLC | 16.231 | 61,76 | 0 | |||||
| 2026-02-12 | 13F | Geo Capital Gestora de Recursos Ltd | 199.511 | -16,53 | 2 | -50,00 | ||||
| 2026-02-13 | 13F | Hurley Capital, LLC | 145 | 1 | ||||||
| 2026-02-13 | 13F | Verition Fund Management LLC | 0 | -100,00 | 0 | |||||
| 2026-01-23 | 13F | Rsm Us Wealth Management Llc | 12.176 | 2,22 | 114 | 1,80 | ||||
| 2026-02-17 | 13F | Northern Trust Corp | 930.501 | -21,07 | 8.691 | -21,58 | ||||
| 2026-02-17 | 13F | Advisory Services Network, LLC | 0 | -100,00 | 0 | |||||
| 2026-02-17 | 13F | Russell Investments Group, Ltd. | 144.902 | 0,00 | 1.353 | -0,66 | ||||
| 2026-02-05 | 13F | May Hill Capital, LLC | 11.960 | 112 | ||||||
| 2026-02-10 | 13F | Bnp Paribas Arbitrage, Sa | 95.889 | -68,35 | 896 | -68,56 | ||||
| 2026-02-11 | 13F | Group One Trading, L.p. | 7.646 | -50,03 | 71 | -50,35 | ||||
| 2026-02-19 | 13F | Atomi Financial Group, Inc. | 19.988 | 7,64 | 187 | 6,90 | ||||
| 2026-04-17 | 13F | Arkfeld Wealth Strategies, L.L.C. | 26.117 | -12,04 | 249 | -10,14 | ||||
| 2026-02-11 | 13F | Brandes Investment Partners, Lp | 239.957 | 14,78 | 2.241 | 14,05 | ||||
| 2026-02-17 | 13F | Voloridge Investment Management, Llc | 369.084 | 66,67 | 3.447 | 65,64 | ||||
| 2025-11-13 | 13F | EntryPoint Capital, LLC | 0 | -100,00 | 0 | -100,00 | ||||
| 2025-11-14 | 13F | Hrt Financial Lp | 0 | -100,00 | 0 | |||||
| 2026-02-18 | 13F/A | Empowered Funds, LLC | 30.468 | 285 | ||||||
| 2026-02-13 | 13F | Wells Fargo & Company/mn | 0 | -100,00 | 0 | |||||
| 2026-02-17 | 13F | Trexquant Investment LP | 0 | -100,00 | 0 | |||||
| 2026-02-17 | 13F | Quantinno Capital Management LP | 99.383 | 38,10 | 928 | 37,28 | ||||
| 2026-04-07 | 13F | Farther Finance Advisors, LLC | 2.773 | 21,94 | 28 | 28,57 | ||||
| 2026-01-27 | 13F | TD Waterhouse Canada Inc. | 221.814 | -3,87 | 2.072 | -4,30 | ||||
| 2026-02-11 | 13F | Jpmorgan Chase & Co | 1.879.587 | 323,72 | 17.555 | 321,08 | ||||
| 2026-01-29 | 13F | UBS Group AG | Put | 492.000 | 0,00 | 4.595 | -0,63 | |||
| 2025-11-13 | 13F | Brown Brothers Harriman & Co | 0 | -100,00 | 0 | -100,00 | ||||
| 2026-01-29 | 13F | UBS Group AG | Call | 492.000 | 0,00 | 4.595 | -0,63 | |||
| 2026-01-29 | 13F | UBS Group AG | 4.651.381 | -6,82 | 43.444 | -7,42 | ||||
| 2026-04-06 | 13F | GAMMA Investing LLC | 1.376 | 35,30 | 14 | 44,44 | ||||
| 2026-02-14 | 13F | Rockefeller Capital Management L.P. | 20 | 0,00 | 0 | |||||
| 2025-11-14 | 13F | Sofos Investments, Inc. | 0 | -100,00 | 0 | |||||
| 2026-02-13 | 13F | American Century Companies Inc | 1.870.695 | 12,11 | 17.472 | 11,39 | ||||
| 2026-02-11 | 13F | Syon Capital Llc | 11.158 | 104 | ||||||
| 2025-11-12 | 13F | Quantbot Technologies LP | 0 | -100,00 | 0 | -100,00 | ||||
| 2026-02-17 | 13F | Two Sigma Investments, Lp | 187.554 | -83,73 | 1.752 | -83,84 | ||||
| 2026-02-11 | 13F | Deutsche Bank Ag\ | 7.353.089 | 4.452,83 | 68.678 | 4.424,18 | ||||
| 2026-02-17 | 13F | Bank Of America Corp /de/ | 1.375.324 | -17,58 | 12.846 | -18,11 | ||||
| 2026-02-17 | 13F | Optiver Holding B.V. | 361.936 | 239,89 | 3.380 | 238,00 | ||||
| 2026-02-09 | 13F | Legal & General Group Plc | 55.121 | 0,00 | 515 | -0,39 | ||||
| 2026-02-13 | 13F | Ubs Asset Management Americas Inc | 910 | 8 | ||||||
| 2026-02-17 | 13F | DZ BANK AG Deutsche Zentral Genossenschafts Bank, Frankfurt am Main | 0 | -100,00 | 0 | |||||
| 2026-02-12 | 13F | Skopos Labs, Inc. | 54.719 | 158,93 | 507 | 158,16 | ||||
| 2025-11-14 | 13F | PineBridge Investments, L.P. | 0 | -100,00 | 0 | -100,00 | ||||
| 2026-02-17 | 13F | Guggenheim Capital Llc | 19.680 | -14,11 | 184 | -14,88 | ||||
| 2026-02-17 | 13F | Bizma Investimentos Ltda | 344.547 | 0,00 | 3.218 | -0,62 | ||||
| 2026-04-21 | 13F | Venturi Wealth Management, LLC | 5.078 | 51 | ||||||
| 2026-02-10 | 13F | Goldman Sachs Group Inc | 4.474.671 | 30,20 | 41.793 | 29,37 | ||||
| 2026-02-17 | 13F | Millennium Management Llc | 776.173 | 144,09 | 7.249 | 142,52 | ||||
| 2026-04-14 | 13F | Nbc Securities, Inc. | 101 | 0,00 | 1 | |||||
| 2026-02-12 | 13F | Jane Street Group, Llc | Put | 0 | -100,00 | 0 | -100,00 | |||
| 2026-04-21 | 13F | Grace & White Inc /ny | 79.774 | 0,00 | 799 | 7,11 | ||||
| 2026-02-13 | 13F | Rhumbline Advisers | 10.732 | -9,75 | 100 | -9,91 | ||||
| 2026-02-17 | 13F | Janus Henderson Group Plc | 0 | -100,00 | 0 | |||||
| 2025-11-14 | 13F | Graham Capital Management, L.P. | 0 | -100,00 | 0 | -100,00 | ||||
| 2026-02-17 | 13F | Engineers Gate Manager LP | 65.525 | 612 | ||||||
| 2026-02-09 | 13F | Harbour Investments, Inc. | 49 | 0,00 | 0 | |||||
| 2026-02-10 | 13F | Envestnet Asset Management Inc | 59.856 | 1,98 | 559 | 1,45 | ||||
| 2026-02-12 | 13F | CIBC Private Wealth Group, LLC | 2.000 | 0,00 | 19 | 0,00 | ||||
| 2026-02-17 | 13F | Fmr Llc | 2.934 | -8,23 | 27 | -10,00 | ||||
| 2025-11-12 | 13F | Erste Asset Management GmbH | 0 | -100,00 | 0 | -100,00 | ||||
| 2026-02-03 | 13F | SBI Securities Co., Ltd. | 400 | 296,04 | 4 | |||||
| 2026-01-09 | 13F | Seafarer Capital Partners, LLC | 265.000 | 2.475 | ||||||
| 2026-02-12 | 13F | Atlas FRM LLC | 17.320.000 | 0,00 | 161.769 | -0,64 | ||||
| 2026-02-10 | 13F | Channing Global Advisors, Llc | 0 | -100,00 | 0 | |||||
| 2026-02-17 | 13F | Creative Planning | 84.774 | 78,16 | 792 | 76,96 | ||||
| 2026-04-15 | 13F | Compagnie Lombard Odier SCmA | 9.555 | 0,00 | 96 | 6,74 | ||||
| 2026-02-09 | 13F | Hantz Financial Services, Inc. | 41.107 | 28,16 | 0 | |||||
| 2026-01-22 | 13F | Massachusetts Financial Services Co /ma/ | 12.631 | 16,13 | 118 | 14,71 | ||||
| 2026-02-17 | 13F | Grantham, Mayo, Van Otterloo & Co. LLC | 165.423 | 1.545 | ||||||
| 2025-11-12 | 13F | Principal Securities, Inc. | 0 | -100,00 | 0 | |||||
| 2026-02-12 | 13F | Wealthspire Advisors, LLC | 0 | -100,00 | 0 | |||||
| 2026-02-02 | 13F | Principal Financial Group Inc | 490.488 | 32,04 | 4.581 | 31,22 | ||||
| 2025-11-14 | 13F | Mml Investors Services, Llc | 0 | -100,00 | 0 | |||||
| 2026-02-13 | 13F | Ieq Capital, Llc | 14.194 | -20,55 | 133 | -20,96 | ||||
| 2026-02-13 | 13F | JustInvest LLC | 21.637 | 4,47 | 202 | 4,12 | ||||
| 2026-02-17 | 13F | Dynamo Internacional Gestao De Recursos Ltda. | 389.234 | 0,00 | 3.635 | -0,63 | ||||
| 2026-02-13 | 13F | Toroso Investments, LLC | 63.396 | 6,39 | 592 | 5,71 |