Grundlæggende statistik
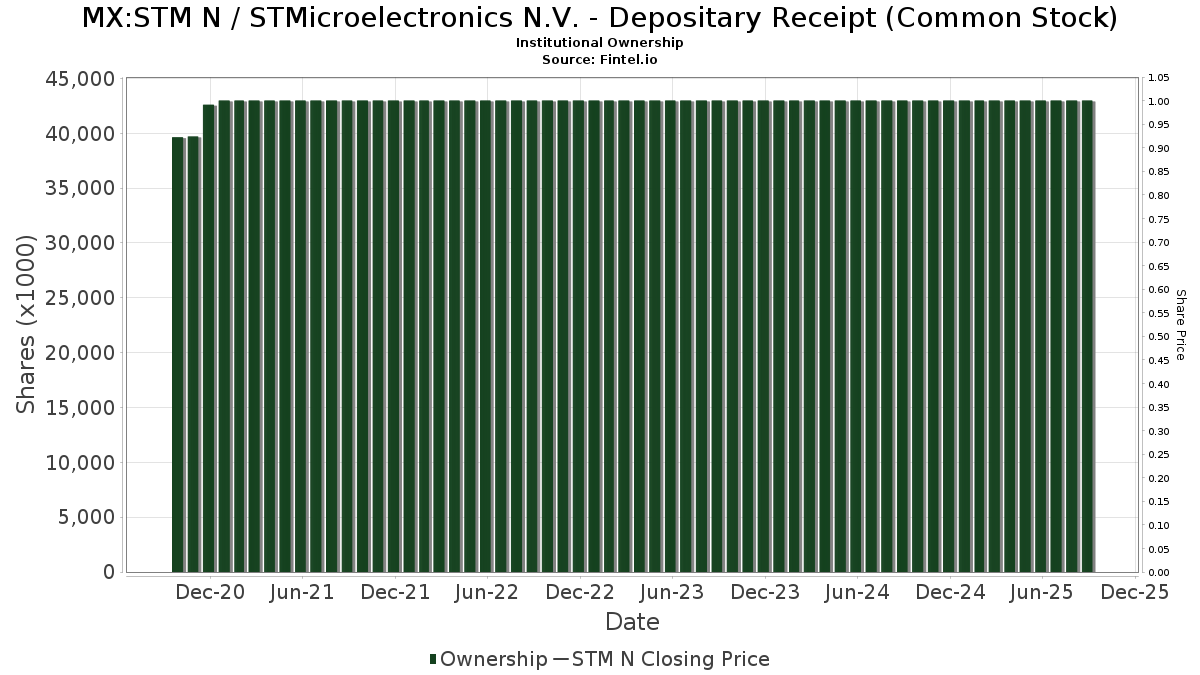
| Institutionelle ejere | 344 total, 322 long only, 1 short only, 21 long/short - change of 5,35% MRQ |
| Gennemsnitlig porteføljeallokering | 0.2219 % - change of 24,14% MRQ |
| Institutionelle aktier (lange) | 90.377.165 (ex 13D/G) - change of 3,34MM shares 8,42% MRQ |
| Institutionel værdi (lang) | $ 1.982.067 USD ($1000) |
Institutionelt ejerskab og aktionærer
STMicroelectronics N.V. - Depositary Receipt (Common Stock) (MX:STM N) har 344 institutionelle ejere og aktionærer, der har indsendt 13D/G- eller 13F-formularer til Securities Exchange Commission (SEC). Disse institutioner har i alt 90,377,165 aktier. Største aktionærer omfatter Van Eck Associates Corp, BlackRock, Inc., Morgan Stanley, Slate Path Capital LP, Invesco Ltd., Goldman Sachs Group Inc, Two Sigma Investments, Lp, Jpmorgan Chase & Co, FIL Ltd, and Dimensional Fund Advisors Lp .
STMicroelectronics N.V. - Depositary Receipt (Common Stock) (BMV:STM N) institutionel ejerskabsstruktur viser aktuelle positioner i virksomheden efter institutioner og fonde, samt seneste ændringer i positionsstørrelse. Større aktionærer kan omfatte individuelle investorer, investeringsforeninger, hedgefonde eller institutioner. Skema 13D angiver, at investoren besidder (eller besidder) mere end 5 % af virksomheden og har til hensigt (eller har til hensigt at) aktivt at forfølge en ændring i forretningsstrategi. Skema 13G indikerer en passiv investering på over 5%.
Fondens stemningsscore
Fund Sentiment Score (fka Ownership Accumulation Score) finder de aktier, der bliver mest købt af fonde. Det er resultatet af en sofistikeret, multi-faktor kvantitativ model, der identificerer virksomheder med de højeste niveauer af institutionel akkumulering. Scoringsmodellen bruger en kombination af den samlede stigning i oplyste ejere, ændringerne i porteføljeallokeringer i disse ejere og andre målinger. Tallet går fra 0 til 100, hvor højere tal indikerer et højere niveau af akkumulering for sine jævnaldrende, og 50 er gennemsnittet.
Opdateringsfrekvens: Dagligt
Se Ownership Explorer, som giver en liste over højest rangerende virksomheder.
AI+ Ask Fintel’s AI assistant about STMicroelectronics N.V. - Depositary Receipt (Common Stock).
Select a question to share a public post with an AI-crafted answer.
Thinking of good questions…
13F og NPORT arkivering
Detaljer om 13F-arkivering er gratis. Detaljer om NP-ansøgninger kræver et premium-medlemskab. Grønne rækker angiver nye positioner. Røde rækker angiver lukkede positioner. Klik på linket ikon for at se den fulde transaktionshistorik.
Opgrader
for at låse premium-data op og eksportere til Excel ![]() .
.
| Fil dato | Kilde | Investor | Type | Gennemsnitlig pris (Øst) |
Aktier | Δ Aktier (%) |
Rapporteret Værdi ($1000) |
Δ Værdi (%) |
Port Alloc (%) |
|
|---|---|---|---|---|---|---|---|---|---|---|
| 2026-02-13 | 13F | Squarepoint Ops LLC | 0 | -100,00 | 0 | -100,00 | ||||
| 2025-11-14 | 13F | Balyasny Asset Management Llc | 0 | -100,00 | 0 | -100,00 | ||||
| 2026-02-12 | 13F | Brinker Capital Investments, LLC | 9.845 | -31,64 | 255 | -37,19 | ||||
| 2026-02-17 | 13F | Balyasny Asset Management Llc | Call | 0 | -100,00 | 0 | -100,00 | |||
| 2026-02-02 | 13F | Montag A & Associates Inc | 593 | 19,08 | 15 | 7,14 | ||||
| 2026-02-17 | 13F | D. E. Shaw & Co., Inc. | Call | 289.300 | 553,05 | 7.504 | 499,84 | |||
| 2025-11-14 | 13F | Wexford Capital Lp | 0 | -100,00 | 0 | -100,00 | ||||
| 2026-02-09 | 13F | William Blair Investment Management, Llc | 0 | -100,00 | 0 | -100,00 | ||||
| 2026-02-17 | 13F | D. E. Shaw & Co., Inc. | Put | 269.700 | 37,25 | 6.996 | 25,99 | |||
| 2026-04-20 | 13F | Sowell Financial Services LLC | 0 | -100,00 | 0 | |||||
| 2026-02-13 | 13F | Headlands Technologies LLC | 63.491 | 1.647 | ||||||
| 2026-02-05 | 13F | Allworth Financial LP | 4.929 | 2,33 | 128 | -6,62 | ||||
| 2026-02-17 | 13F | Point72 Asset Management, L.P. | Call | 16.800 | 436 | |||||
| 2026-02-17 | 13F | Point72 Asset Management, L.P. | Put | 62.500 | 1.621 | |||||
| 2026-02-17 | 13F | RMB Capital Management, LLC | 115.268 | 119,43 | 2.990 | 101,48 | ||||
| 2026-02-02 | 13F | Ping Capital Management, Inc. | 17.000 | 70,00 | 441 | 56,03 | ||||
| 2026-01-22 | 13F | Harwood Advisory Group, LLC | 652 | 0,31 | 17 | -11,11 | ||||
| 2026-02-09 | 13F | Legal & General Group Plc | 5.578 | 42,08 | 145 | 30,91 | ||||
| 2026-01-29 | 13F | Kestra Private Wealth Services, Llc | 0 | -100,00 | 0 | -100,00 | ||||
| 2026-01-30 | 13F | American Capital Advisory, LLC | 11 | 22,22 | 0 | |||||
| 2026-01-21 | 13F | Modera Wealth Management, LLC | 155.790 | -0,43 | 4.041 | -8,60 | ||||
| 2026-04-20 | 13F | Dagco, Inc. | 0 | -100,00 | 0 | |||||
| 2026-02-11 | 13F | Capital Analysts, Inc. | 91 | -63,75 | 0 | |||||
| 2026-02-13 | 13F | Mariner, LLC | 66.553 | -8,40 | 1.727 | -15,93 | ||||
| 2026-02-09 | 13F | Nia Impact Advisors, Llc | 12.145 | 0,00 | 315 | -8,16 | ||||
| 2026-02-13 | 13F | Sofos Investments, Inc. | 500 | 13 | ||||||
| 2026-02-13 | 13F | Charles Schwab Investment Management Inc | 80.667 | -9,31 | 2.093 | -16,75 | ||||
| 2026-02-17 | 13F | Two Sigma Investments, Lp | 3.602.842 | 55,13 | 93.458 | 42,39 | ||||
| 2026-02-17 | 13F | Laird Norton Trust Company, Llc | 37.820 | 981 | ||||||
| 2026-02-04 | 13F | Atlantic Union Bankshares Corp | 383 | 10 | ||||||
| 2026-01-21 | 13F | Sound Income Strategies, LLC | 250 | 252,11 | 7 | 200,00 | ||||
| 2025-11-14 | 13F | LMR Partners LLP | 0 | -100,00 | 0 | -100,00 | ||||
| 2026-04-21 | 13F | Maseco Llp | 0 | -100,00 | 0 | |||||
| 2026-02-12 | 13F | Quadrant Capital Group Llc | 23.370 | -9,10 | 606 | -16,53 | ||||
| 2025-11-13 | 13F | Capital Research Global Investors | 0 | -100,00 | 0 | |||||
| 2026-02-18 | 13F | Vident Advisory, LLC | 18.048 | -22,19 | 468 | -28,55 | ||||
| 2026-02-09 | 13F | 44 Wealth Management Llc | 0 | -100,00 | 0 | -100,00 | ||||
| 2026-02-02 | 13F | Chung Wu Investment Group, LLC | 200 | 0,00 | 5 | 0,00 | ||||
| 2026-02-11 | 13F | O'shaughnessy Asset Management, Llc | 21.589 | -23,30 | 560 | -29,56 | ||||
| 2026-02-13 | 13F | Arrowstreet Capital, Limited Partnership | 1.397.239 | -46,37 | 36.244 | -50,78 | ||||
| 2026-02-17 | 13F | Optiver Holding B.V. | 0 | -100,00 | 0 | -100,00 | ||||
| 2026-01-09 | 13F | Diversified Trust Co | 0 | -100,00 | 0 | |||||
| 2026-01-23 | 13F | Robeco Institutional Asset Management B.V. | 0 | -100,00 | 0 | -100,00 | ||||
| 2026-02-11 | 13F | Dorsey & Whitney Trust CO LLC | 11.925 | -14,78 | 309 | -21,77 | ||||
| 2026-02-17 | 13F | Advisory Services Network, LLC | 0 | -100,00 | 0 | |||||
| 2026-02-13 | 13F | Van Eck Associates Corp | 10.532.428 | 12,20 | 273 | 3,02 | ||||
| 2026-04-10 | 13F | Abound Wealth Management | 1.006 | 0,00 | 35 | 30,77 | ||||
| 2026-02-12 | 13F | SWAN Capital LLC | 33 | 17,86 | 1 | |||||
| 2026-02-13 | 13F | Kestra Advisory Services, LLC | 0 | -100,00 | 0 | |||||
| 2026-04-23 | 13F | Oppenheimer Asset Management Inc. | 18.727 | -32,09 | 647 | -9,51 | ||||
| 2026-02-17 | 13F | XTX Topco Ltd | 17.035 | 442 | ||||||
| 2026-04-24 | 13F | Root Financial Partners, LLC | 45 | 87,50 | 2 | |||||
| 2026-02-13 | 13F | First Trust Advisors Lp | 132.751 | -32,93 | 3.444 | -38,44 | ||||
| 2026-02-03 | 13F | Denali Advisors Llc | 8.687 | -3,27 | 225 | -11,07 | ||||
| 2026-02-03 | 13F | Gallacher Capital Management LLC | 11.231 | -33,66 | 291 | -39,12 | ||||
| 2026-02-13 | 13F | Mml Investors Services, Llc | 18.472 | -3,70 | 479 | -11,62 | ||||
| 2026-02-23 | 13F | Mv Capital Management, Inc. | 7 | 0 | ||||||
| 2025-11-14 | 13F | Verition Fund Management LLC | 0 | -100,00 | 0 | |||||
| 2025-11-14 | 13F | XY Capital Ltd | 0 | -100,00 | 0 | -100,00 | ||||
| 2025-11-14 | 13F | Cinctive Capital Management LP | 0 | -100,00 | 0 | -100,00 | ||||
| 2026-01-27 | 13F | Checchi Capital Advisers, LLC | 0 | -100,00 | 0 | |||||
| 2026-02-11 | 13F | Franklin Resources Inc | 9.056 | -7,19 | 235 | -14,91 | ||||
| 2026-02-12 | 13F | DRW Securities, LLC | 26.960 | 699 | ||||||
| 2026-01-28 | 13F | Geneos Wealth Management Inc. | 0 | -100,00 | 0 | -100,00 | ||||
| 2026-02-13 | 13F | Inspire Advisors, LLC | 19.933 | 9,50 | 517 | 0,58 | ||||
| 2026-02-02 | 13F | Principal Financial Group Inc | 0 | -100,00 | 0 | -100,00 | ||||
| 2025-10-28 | 13F | CarsonAllaria Wealth Management, Ltd. | 0 | -100,00 | 0 | |||||
| 2026-02-17 | 13F | FIL Ltd | 3.107.386 | 4,95 | 80.606 | -3,66 | ||||
| 2026-04-24 | 13F | United Community Bank | 100 | 0,00 | 3 | 50,00 | ||||
| 2026-02-13 | 13F | Motiv8 Investments LLC | 100 | 0 | ||||||
| 2026-02-11 | 13F | Manchester Capital Management LLC | 345 | 9 | ||||||
| 2025-11-14 | 13F | Junto Capital Management LP | 0 | -100,00 | 0 | -100,00 | ||||
| 2026-01-16 | 13F | Crewe Advisors LLC | 688 | 0,00 | 18 | -10,53 | ||||
| 2026-02-05 | 13F | Cambridge Investment Research Advisors, Inc. | 21.448 | -8,04 | 1 | |||||
| 2026-02-17 | 13F | Aqr Capital Management Llc | 61.590 | -63,88 | 1.598 | -66,85 | ||||
| 2026-02-17 | 13F | Paloma Partners Management Co | 42.000 | 1.089 | ||||||
| 2026-04-10 | 13F | Henry James International Management Inc. | 105.149 | 0,01 | 3.633 | 33,19 | ||||
| 2026-03-03 | 13F/A | Caitong International Asset Management Co., Ltd | 9 | 0 | ||||||
| 2026-02-12 | 13F | Commonwealth Equity Services, Llc | 19.402 | 4,04 | 503 | |||||
| 2026-03-19 | 13F | Painted Porch Advisors LLC | 0 | -100,00 | 0 | |||||
| 2026-01-27 | 13F | First Horizon Corp | 420 | 0,00 | 11 | -9,09 | ||||
| 2026-02-27 | 13F | Compass Financial Services Inc | 144 | -64,53 | 4 | -72,73 | ||||
| 2025-11-13 | 13F | Pinpoint Asset Management (Singapore) Pte. Ltd. | 0 | -100,00 | 0 | -100,00 | ||||
| 2025-11-14 | 13F | WealthTrust Axiom LLC | 0 | -100,00 | 0 | |||||
| 2026-01-15 | 13F | Nisa Investment Advisors, Llc | 94 | 2 | ||||||
| 2026-02-17 | 13F | Silvercrest Asset Management Group Llc | 23.900 | 0,00 | 620 | -8,30 | ||||
| 2026-02-13 | 13F | Umb Bank N A/mo | 1.257 | 7,90 | 33 | 0,00 | ||||
| 2026-02-11 | 13F | Zions Bancorporation, National Association /ut/ | 315 | 0,00 | 8 | 0,00 | ||||
| 2026-02-13 | 13F | Maven Securities LTD | 0 | -100,00 | 0 | -100,00 | ||||
| 2026-04-13 | 13F | Whalen Wealth Management Inc. | 12.455 | -32,08 | 430 | -9,47 | ||||
| 2026-04-24 | 13F | Medallion Wealth Advisors, LLC | 0 | -100,00 | 0 | |||||
| 2026-04-13 | 13F | IFP Advisors, Inc | 1.136 | 1,07 | 39 | 34,48 | ||||
| 2026-01-28 | 13F | CAPROCK Group, Inc. | 10.517 | 9,88 | 273 | 5,43 | ||||
| 2026-02-13 | 13F | Maven Securities LTD | Put | 0 | -100,00 | 0 | -100,00 | |||
| 2026-02-17 | 13F | Tower Research Capital LLC (TRC) | 35.951 | -89,59 | 933 | -90,45 | ||||
| 2026-02-12 | 13F | Wealthspire Advisors, LLC | 0 | -100,00 | 0 | |||||
| 2026-02-17 | 13F | Mercer Global Advisors Inc /adv | 30.304 | -12,58 | 786 | -19,71 | ||||
| 2026-04-08 | 13F | Arlington Trust Co LLC | 85 | 3 | ||||||
| 2026-04-20 | 13F | Brian Low Financial Group, Llc | 58.179 | 80,15 | 2.010 | 140,14 | ||||
| 2026-02-17 | 13F | Bayesian Capital Management, LP | 9.619 | 250 | ||||||
| 2026-02-11 | 13F | TCTC Holdings, LLC | 1.500 | 0,00 | 39 | -9,52 | ||||
| 2026-02-12 | 13F | Jane Street Group, Llc | 0 | -100,00 | 0 | -100,00 | ||||
| 2026-02-11 | 13F | Janney Montgomery Scott LLC | 0 | -100,00 | 0 | |||||
| 2026-02-13 | 13F | JustInvest LLC | 42.406 | -17,34 | 1.100 | -24,09 | ||||
| 2026-02-05 | 13F | AlphaCore Capital LLC | 9.437 | -18,40 | 245 | -25,15 | ||||
| 2026-02-17 | 13F | Freestone Grove Partners LP | 0 | -100,00 | 0 | -100,00 | ||||
| 2026-02-17 | 13F | LMR Partners LLP | Call | 114.800 | 2.978 | |||||
| 2026-02-17 | 13F | Citadel Advisors Llc | Put | 779.100 | 61,20 | 20.210 | 47,96 | |||
| 2025-11-14 | 13F | Atom Investors LP | 0 | -100,00 | 0 | -100,00 | ||||
| 2026-02-17 | 13F | Citadel Advisors Llc | 1.495.711 | 45,02 | 38.799 | 33,11 | ||||
| 2026-02-17 | 13F | Guggenheim Capital Llc | 50.018 | -25,64 | 1.297 | -31,77 | ||||
| 2026-02-17 | 13F | Citadel Advisors Llc | Call | 202.000 | -7,21 | 5.240 | -14,84 | |||
| 2026-01-23 | 13F | Assetmark, Inc | 6.482 | -86,98 | 168 | -88,06 | ||||
| 2026-02-17 | 13F | Slate Path Capital LP | 5.280.500 | 136.976 | ||||||
| 2025-11-14 | 13F | Albar Capital Partners LLP | 0 | -100,00 | 0 | |||||
| 2026-02-12 | 13F | Colonial Trust Co / SC | 0 | -100,00 | 0 | -100,00 | ||||
| 2026-02-17 | 13F | Defiance ETFs, LLC | 1.517.463 | 39.545 | ||||||
| 2026-04-23 | 13F | SJS Investment Consulting Inc. | 243 | 8 | ||||||
| 2026-02-17 | 13F | Voleon Capital Management Lp | 241.088 | 23,14 | 6.254 | 13,03 | ||||
| 2026-04-13 | 13F | Highland Capital Management, Llc | 51.210 | -0,29 | 1.769 | 32,81 | ||||
| 2026-02-17 | 13F | Millennium Management Llc | Call | 384.000 | 16,89 | 9.961 | 7,29 | |||
| 2026-02-17 | 13F | Millennium Management Llc | Put | 734.600 | 13,43 | 19.056 | 4,12 | |||
| 2026-02-17 | 13F | Millennium Management Llc | 724.862 | -62,50 | 18.803 | -65,58 | ||||
| 2026-02-03 | 13F | Morse Asset Management, Inc | 0 | -100,00 | 0 | -100,00 | ||||
| 2026-01-21 | 13F | Crews Bank & Trust | 2.800 | 0,00 | 73 | -8,86 | ||||
| 2026-01-27 | 13F | Aspiring Ventures, LLC | Call | 0 | -100,00 | 0 | -100,00 | |||
| 2026-02-10 | 13F | Bruce G. Allen Investments, LLC | 0 | -100,00 | 0 | -100,00 | ||||
| 2026-02-10 | 13F | Bnp Paribas Arbitrage, Sa | Put | 3.640 | 9.442 | |||||
| 2026-02-10 | 13F | Bnp Paribas Arbitrage, Sa | Call | 456 | 1.183 | |||||
| 2026-02-03 | 13F | Maxi Investments CY Ltd | 90.000 | 2 | ||||||
| 2026-02-03 | 13F | Cheviot Value Management, LLC | 200 | 0,00 | 6 | 20,00 | ||||
| 2026-04-20 | 13F | Banque Cantonale Vaudoise | 0 | -100,00 | 0 | |||||
| 2025-11-14 | 13F | Wetherby Asset Management Inc | 33.414 | 9,58 | 944 | 1,83 | ||||
| 2026-02-06 | 13F | Bare Financial Services, Inc | 138 | -19,30 | 4 | -25,00 | ||||
| 2025-10-28 | 13F | Campbell & CO Investment Adviser LLC | 0 | -100,00 | 0 | -100,00 | ||||
| 2026-04-24 | 13F | Yousif Capital Management, Llc | 10.389 | 0,00 | 359 | 27,40 | ||||
| 2026-04-24 | 13F | Key FInancial Inc | 95 | 0,00 | 3 | 50,00 | ||||
| 2026-02-09 | 13F | Harbour Investments, Inc. | 1.696 | -0,29 | 44 | -8,33 | ||||
| 2026-02-11 | 13F | Deutsche Bank Ag\ | 124.816 | -6,74 | 3.238 | -14,41 | ||||
| 2026-04-07 | 13F | Signaturefd, Llc | 17.589 | 3,31 | 608 | 37,64 | ||||
| 2026-04-09 | 13F | Diversified Management Inc | 25.000 | 0,00 | 864 | 33,18 | ||||
| 2026-02-10 | 13F | Envestnet Asset Management Inc | 124.016 | -51,09 | 3.217 | -55,12 | ||||
| 2026-02-03 | 13F | Ballentine Partners, LLC | 20.715 | -9,98 | 537 | -17,38 | ||||
| 2026-02-12 | 13F | CIBC Private Wealth Group, LLC | 1.000 | 3.746,15 | 26 | |||||
| 2026-01-23 | 13F | Altfest L J & Co Inc | 21.005 | 545 | ||||||
| 2026-04-07 | 13F | Eastern Bank | 6.000 | 0,00 | 207 | 33,55 | ||||
| 2026-02-17 | 13F | Royal Bank Of Canada | 371.603 | -64,32 | 9.640 | -67,25 | ||||
| 2026-02-12 | 13F | Brown Brothers Harriman & Co | 2.680 | 350,42 | 70 | 331,25 | ||||
| 2026-03-12 | 13F/A | Peak6 Llc | Put | 212.100 | -49,19 | 5.502 | -53,36 | |||
| 2026-03-12 | 13F/A | Peak6 Llc | Call | 469.300 | -23,52 | 12.174 | -29,80 | |||
| 2026-03-12 | 13F/A | Peak6 Llc | 174.447 | -26,45 | 4.525 | -32,48 | ||||
| 2026-02-13 | 13F | Candriam Luxembourg S.C.A. | 76.811 | -32,34 | 1.993 | -37,91 | ||||
| 2025-11-07 | 13F/A | Abn Amro Investment Solutions | 43.061 | 34,41 | 1.859 | 16,05 | ||||
| 2026-02-17 | 13F | United Capital Financial Advisers, Llc | 0 | -100,00 | 0 | |||||
| 2026-04-22 | 13F | Motco | 0 | -100,00 | 0 | |||||
| 2026-02-13 | 13F | National Bank Of Canada /fi/ | 549 | 28,27 | 14 | 16,67 | ||||
| 2026-02-13 | 13F | Transamerica Financial Advisors, Inc. | 3 | -70,00 | 0 | |||||
| 2025-11-14 | 13F | Point72 Italy, S.r.l. | 0 | -100,00 | 0 | -100,00 | ||||
| 2026-02-12 | 13F | Bank Of Montreal /can/ | 36.855 | 33,36 | 956 | 22,56 | ||||
| 2025-11-10 | 13F | Clear Creek Financial Management, LLC | 0 | -100,00 | 0 | |||||
| 2026-04-22 | 13F | JNBA Financial Advisors | 60 | 0,00 | 2 | 100,00 | ||||
| 2025-11-14 | 13F | Holocene Advisors, LP | 0 | -100,00 | 0 | -100,00 | ||||
| 2025-11-14 | 13F | Warren Averett Asset Management, LLC | 0 | -100,00 | 0 | |||||
| 2025-11-14 | 13F | Truvestments Capital Llc | 0 | -100,00 | 0 | -100,00 | ||||
| 2026-01-26 | 13F | PFG Investments, LLC | 9.462 | 245 | ||||||
| 2025-11-14 | 13F | ICONIQ Capital, LLC | 0 | -100,00 | 0 | |||||
| 2025-11-14 | 13F | Point72 Asia (Singapore) Pte. Ltd. | 4.944 | 140 | ||||||
| 2026-02-06 | 13F | Global Retirement Partners, LLC | 5.447 | 2.570,10 | 141 | 2.720,00 | ||||
| 2026-02-10 | 13F | Bnp Paribas Arbitrage, Sa | 1.699.806 | -22,92 | 44.093 | -29,25 | ||||
| 2026-02-10 | 13F | Acadian Asset Management Llc | 774.893 | -66,33 | 20 | -69,23 | ||||
| 2026-01-16 | 13F | First Pacific Financial | 0 | -100,00 | 0 | |||||
| 2026-02-11 | 13F | Cerity Partners LLC | 79.647 | 15,73 | 2.066 | 6,28 | ||||
| 2025-11-13 | 13F | Goodman Advisory Group, LLC | 0 | -100,00 | 0 | -100,00 | ||||
| 2026-02-14 | 13F | Rockefeller Capital Management L.P. | 33.864 | 6,60 | 878 | -2,12 | ||||
| 2025-11-14 | 13F | ExodusPoint Capital Management, LP | Call | 0 | -100,00 | 0 | ||||
| 2025-11-04 | 13F | Transcend Wealth Collective, Llc | 0 | -100,00 | 0 | -100,00 | ||||
| 2026-02-17 | 13F | SageView Advisory Group, LLC | 5 | 0 | ||||||
| 2025-11-10 | 13F | Raiffeisen Bank International AG | 0 | -100,00 | 0 | -100,00 | ||||
| 2026-04-03 | 13F | Investors Research Corp | 14.120 | 0,00 | 488 | 33,06 | ||||
| 2026-02-13 | 13F | State Street Corp | 135.146 | -25,06 | 3.506 | -31,22 | ||||
| 2026-01-27 | 13F | WealthCollab, LLC | 567 | -40,57 | 15 | -46,15 | ||||
| 2026-02-13 | 13F | Rafferty Asset Management, LLC | 1.832.344 | 5,11 | 47.531 | -3,52 | ||||
| 2026-02-03 | 13F | We Are One Seven, LLC | 8.860 | 230 | ||||||
| 2026-04-13 | 13F | Mather Group, Llc. | 59 | 2 | ||||||
| 2025-10-31 | 13F | Whittier Trust Co | 0 | -100,00 | 0 | -100,00 | ||||
| 2026-04-22 | 13F | Pinnacle Bancorp, Inc. | 369 | -39,01 | 13 | -20,00 | ||||
| 2026-02-03 | 13F | Ethic Inc. | 57.294 | -3,81 | 1.486 | -11,71 | ||||
| 2026-04-22 | 13F | Avantra Family Wealth, Inc. | 0 | -100,00 | 0 | |||||
| 2025-11-06 | 13F | Whipplewood Advisors, LLC | 0 | -100,00 | 0 | |||||
| 2026-04-07 | 13F | CoreCap Advisors, LLC | 332 | 12,16 | 11 | 57,14 | ||||
| 2025-12-09 | 13F/A | Tudor Investment Corp Et Al | 0 | -100,00 | 0 | -100,00 | ||||
| 2025-11-12 | 13F | Transce3nd, LLC | 0 | -100,00 | 0 | |||||
| 2026-04-08 | 13F | Bond & Devick Financial Network, Inc. | 8.150 | 0,00 | 282 | 33,18 | ||||
| 2026-02-13 | 13F | Smartleaf Asset Management LLC | 4.405 | 13,06 | 115 | 4,59 | ||||
| 2026-01-14 | 13F | ORG Partners LLC | 25 | 1 | ||||||
| 2026-02-11 | 13F | Havemeyer Place LP | 7.815 | 203 | ||||||
| 2026-02-17 | 13F | Jump Financial, LLC | 73.870 | -43,09 | 1.916 | -47,76 | ||||
| 2026-02-17 | 13F | Fairscale Capital, LLC | 0 | -100,00 | 0 | |||||
| 2026-02-13 | 13F | Healthcare Of Ontario Pension Plan Trust Fund | 600.000 | 417,73 | 15.564 | 375,24 | ||||
| 2026-04-22 | 13F | TPG Advisors LLC | 9.603 | 0,00 | 332 | 32,93 | ||||
| 2026-02-12 | 13F | Dimensional Fund Advisors Lp | 3.063.194 | 48,66 | 79.462 | 36,48 | ||||
| 2026-02-13 | 13F | Squarepoint Ops LLC | Call | 164.600 | 174,79 | 4.270 | 152,30 | |||
| 2026-02-04 | 13F | Marco Investment Management Llc | 17.200 | -3,37 | 446 | -11,33 | ||||
| 2026-02-02 | 13F | Qrg Capital Management, Inc. | 10.734 | 0,39 | 278 | -7,95 | ||||
| 2026-04-21 | 13F | GHP Investment Advisors, Inc. | 16 | 1 | ||||||
| 2026-02-12 | 13F | Groupe la Francaise | 0 | -100,00 | 0 | -100,00 | ||||
| 2026-04-08 | 13F | Wealth Enhancement Advisory Services, Llc | 19.408 | -1,30 | 666 | 15,22 | ||||
| 2026-02-13 | 13F | Marshall Wace, Llp | 1.647.305 | 42.731 | ||||||
| 2025-11-14 | 13F | Bridgefront Capital, LLC | 0 | -100,00 | 0 | -100,00 | ||||
| 2026-04-01 | 13F | Bangor Savings Bank | 39 | 0,00 | 1 | 0,00 | ||||
| 2026-02-11 | 13F | Brandes Investment Partners, Lp | 1.566.965 | 20,36 | 40.647 | 10,48 | ||||
| 2026-04-23 | 13F | Sawyer & Company, Inc | 345 | 0,00 | 12 | 37,50 | ||||
| 2025-11-14 | 13F | Cubist Systematic Strategies, LLC | 310.629 | 8.778 | ||||||
| 2026-02-13 | 13F | SRS Capital Advisors, Inc. | 2.090 | -93,96 | 54 | -94,47 | ||||
| 2026-02-10 | 13F | Savant Capital, LLC | 0 | -100,00 | 0 | |||||
| 2025-11-14 | 13F | Cubist Systematic Strategies, LLC | Put | 29.600 | -67,65 | 836 | -69,95 | |||
| 2025-11-10 | 13F | Greenland Capital Management LP | 0 | -100,00 | 0 | -100,00 | ||||
| 2026-04-20 | 13F | Eagle Strategies LLC | 0 | -100,00 | 0 | |||||
| 2026-02-12 | 13F | Keynote Financial Services Llc | 17.404 | -1,24 | 451 | -9,44 | ||||
| 2026-02-13 | 13F | Parkside Financial Bank & Trust | 1.565 | -40,61 | 41 | -45,95 | ||||
| 2026-04-24 | 13F | Oakworth Capital, Inc. | 759 | 0,00 | 26 | 36,84 | ||||
| 2026-02-17 | 13F | Jones Financial Companies Lllp | 29.879 | 5,15 | 775 | -2,52 | ||||
| 2026-01-27 | 13F | CenterStar Asset Management, LLC | Put | 23.100 | 599 | |||||
| 2026-04-02 | 13F | MJT & Associates Financial Advisory Group, Inc. | 501 | -14,36 | 17 | 13,33 | ||||
| 2026-02-12 | 13F | Jane Street Group, Llc | Put | 123.500 | 376,83 | 3.204 | 338,17 | |||
| 2026-02-12 | 13F | Jane Street Group, Llc | Call | 70.700 | 308,67 | 1.834 | 275,61 | |||
| 2026-02-09 | 13F | Hantz Financial Services, Inc. | 97.859 | -0,17 | 3 | 0,00 | ||||
| 2026-02-17 | 13F | Northern Trust Corp | 555.522 | -8,84 | 14.410 | -16,33 | ||||
| 2026-02-17 | 13F | Cape Investment Advisory, Inc. | 80 | -41,18 | 2 | -33,33 | ||||
| 2026-02-09 | 13F | AIA Group Ltd | 0 | -100,00 | 0 | |||||
| 2026-02-17 | 13F | Brevan Howard Capital Management LP | 0 | -100,00 | 0 | -100,00 | ||||
| 2026-02-17 | 13F | Quantinno Capital Management LP | 213.584 | 33,68 | 5.540 | 22,70 | ||||
| 2026-02-04 | 13F | Ameritas Advisory Services, LLC | 0 | -100,00 | 0 | -100,00 | ||||
| 2026-02-11 | 13F | Fox Run Management, L.l.c. | 0 | -100,00 | 0 | |||||
| 2026-02-03 | 13F | SBI Securities Co., Ltd. | 9.572 | 8,56 | 248 | -0,40 | ||||
| 2026-02-13 | 13F | University Of Texas/texas Am Investment Managment Co | 0 | -100,00 | 0 | |||||
| 2026-02-17 | 13F | Voloridge Investment Management, Llc | 985.379 | 44,60 | 25.561 | 32,73 | ||||
| 2026-02-13 | 13F | American Century Companies Inc | 352.424 | -7,58 | 9.142 | -15,17 | ||||
| 2026-02-13 | 13F | Squarepoint Ops LLC | Put | 87.300 | 22,78 | 2.265 | 12,69 | |||
| 2026-02-13 | 13F | SYM FINANCIAL Corp | 0 | -100,00 | 0 | |||||
| 2026-01-12 | 13F | CVA Family Office, LLC | 6.782 | 0,00 | 176 | -8,38 | ||||
| 2026-02-13 | 13F | Toroso Investments, LLC | 10.858 | 26,07 | 282 | 15,64 | ||||
| 2026-02-13 | 13F | Analog Century Management LP | 0 | -100,00 | 0 | |||||
| 2026-02-17 | 13F | Capital Fund Management S.a. | Call | 196.900 | -9,01 | 5.108 | -16,48 | |||
| 2026-04-17 | 13F | Bell Investment Advisors, Inc | 313 | 128,47 | 11 | 233,33 | ||||
| 2026-02-19 | 13F | CI Private Wealth, LLC | 62.401 | -3,25 | 1.619 | -11,20 | ||||
| 2025-11-14 | 13F | Point72 Hong Kong Ltd | 0 | -100,00 | 0 | |||||
| 2026-02-17 | 13F | Creative Planning | 194.664 | 2,56 | 5.050 | -5,85 | ||||
| 2026-02-17 | 13F | Capital Fund Management S.a. | Put | 215.700 | -34,79 | 5.595 | -40,15 | |||
| 2026-02-13 | 13F | Toroso Investments, LLC | Call | 3.600 | 93 | |||||
| 2026-03-04 | 13F | SHP Wealth Management | 36 | 1 | ||||||
| 2026-01-26 | 13F | Private Trust Co Na | 571 | 0,00 | 15 | -12,50 | ||||
| 2026-02-17 | 13F | Clear Street Markets Llc | 0 | -100,00 | 0 | -100,00 | ||||
| 2026-02-13 | 13F | Ubs Asset Management Americas Inc | 3.065 | 80 | ||||||
| 2026-03-06 | 13F | Hsbc Holdings Plc | 27.168 | 28,79 | 709 | 20,20 | ||||
| 2026-02-06 | 13F | Empirical Asset Management, LLC | 11.555 | -3,47 | 300 | -11,54 | ||||
| 2026-02-11 | 13F | Group One Trading, L.p. | Call | 266.500 | -14,06 | 6.913 | -21,11 | |||
| 2026-04-13 | 13F | Salem Investment Counselors Inc | 18 | 1 | ||||||
| 2026-02-11 | 13F | Group One Trading, L.p. | Put | 224.000 | 18,02 | 5.811 | 8,33 | |||
| 2026-02-17 | 13F | Susquehanna International Group, Llp | 28.594 | -91,67 | 742 | -92,36 | ||||
| 2026-02-11 | 13F | Group One Trading, L.p. | 12.837 | 333 | ||||||
| 2026-02-17 | 13F | Susquehanna International Group, Llp | Put | 1.393.200 | 69,47 | 36.140 | 55,56 | |||
| 2026-02-11 | 13F | GW&K Investment Management, LLC | 92 | 0 | ||||||
| 2026-04-22 | 13F | Caldwell Trust Co | 3.000 | 0,00 | 104 | 33,77 | ||||
| 2026-01-29 | 13F | IMC-Chicago, LLC | 54.123 | 20,91 | 1.404 | 11,00 | ||||
| 2026-01-29 | 13F | IMC-Chicago, LLC | Put | 202.300 | 12,26 | 5.248 | 3,04 | |||
| 2026-01-26 | 13F | Reyes Financial Architecture, Inc. | 100 | 3 | ||||||
| 2026-01-29 | 13F | IMC-Chicago, LLC | Call | 169.400 | 16,27 | 4.394 | 6,73 | |||
| 2026-02-13 | 13F | Kilter Group LLC | 13 | -38,10 | 0 | |||||
| 2026-02-17 | 13F | Susquehanna International Group, Llp | Call | 1.329.200 | 156,90 | 34.479 | 135,82 | |||
| 2025-11-10 | 13F | Nkcfo Llc | 0 | -100,00 | 0 | |||||
| 2026-01-30 | 13F | Us Bancorp \de\ | 24.922 | -57,37 | 646 | -60,90 | ||||
| 2026-02-13 | 13F | Neuberger Berman Group LLC | 84.593 | -8,01 | 2.194 | -15,55 | ||||
| 2026-02-17 | 13F | Cetera Investment Advisers | 36.525 | -24,87 | 947 | -31,03 | ||||
| 2026-03-04 | 13F | Leonteq Securities AG | 0 | -100,00 | 0 | |||||
| 2026-04-10 | 13F | Armstrong Advisory Group, Inc | 1.000 | 0,00 | 35 | 36,00 | ||||
| 2026-02-05 | 13F | High Note Wealth, LLC | 500 | 0,00 | 13 | -14,29 | ||||
| 2026-02-19 | 13F | Invesco Ltd. | 5.199.951 | 29,87 | 134.887 | 19,21 | ||||
| 2026-04-06 | 13F | Versant Capital Management, Inc | 9.215 | 1,29 | 318 | 34,75 | ||||
| 2025-11-12 | 13F | Simplex Trading, Llc | 0 | -100,00 | 0 | |||||
| 2026-02-11 | 13F | BI Asset Management Fondsmaeglerselskab A/S | 0 | -100,00 | 0 | |||||
| 2026-01-13 | 13F | Stephens Consulting, LLC | 100 | 0,00 | 3 | 0,00 | ||||
| 2026-01-29 | 13F | Sanctuary Advisors, LLC | 0 | -100,00 | 0 | -100,00 | ||||
| 2026-01-07 | 13F | Aventura Private Wealth, LLC | 200 | 5 | ||||||
| 2025-11-12 | 13F | Ameriflex Group, Inc. | 0 | -100,00 | 0 | -100,00 | ||||
| 2026-04-21 | 13F | Financial Consulate, Inc | 95 | 82,69 | 3 | 200,00 | ||||
| 2026-02-13 | 13F | Atlas Capital Advisors Llc | 5.552 | 0,00 | 144 | -14,29 | ||||
| 2026-04-06 | 13F | GAMMA Investing LLC | 3.666 | 23,10 | 127 | 63,64 | ||||
| 2026-04-21 | 13F | Vise Technologies, Inc. | 11.816 | 0,00 | 307 | 0,00 | ||||
| 2026-01-30 | 13F | Archer Investment Corp | 18 | 0,00 | 0 | |||||
| 2026-02-03 | 13F | Robeco Schweiz AG | 566.130 | -3,22 | 14.685 | -11,16 | ||||
| 2026-02-17 | 13F | Summit Partners Public Asset Management, Llc | Call | 0 | -100,00 | 0 | ||||
| 2026-01-26 | 13F | Cwm, Llc | 6.587 | -12,66 | 0 | |||||
| 2025-11-12 | 13F | Creekmur Asset Management LLC | 201 | 0,50 | 6 | -16,67 | ||||
| 2026-02-17 | 13F | Summit Partners Public Asset Management, Llc | 0 | -100,00 | 0 | |||||
| 2026-02-17 | 13F | Woodline Partners LP | 1.920.099 | 49.807 | ||||||
| 2026-02-10 | 13F | Godfrey Financial Associates, Inc. | 412 | 11 | ||||||
| 2026-02-11 | 13F | Syon Capital Llc | 10.576 | -4,76 | 274 | -12,46 | ||||
| 2025-11-12 | 13F | Cresset Asset Management, LLC | 0 | -100,00 | 0 | -100,00 | ||||
| 2026-02-04 | 13F | West Tower Group, LLC | 10.000 | 25,00 | 259 | 14,60 | ||||
| 2026-02-17 | 13F | SIH Partners, LLLP | 32.254 | 0,00 | 837 | -8,23 | ||||
| 2026-01-16 | 13F | FNY Investment Advisers, LLC | Call | 0 | -100,00 | 0 | ||||
| 2026-01-21 | 13F | Albion Financial Group /ut | 127 | 0,00 | 3 | 0,00 | ||||
| 2026-04-22 | 13F | Atlantic Edge Private Wealth Management, LLC | 100 | 0,00 | 3 | 50,00 | ||||
| 2026-02-11 | 13F | Empowered Funds, LLC | 24.763 | 16,58 | 642 | 7,00 | ||||
| 2026-02-13 | 13F | Wells Fargo & Company/mn | 417.209 | -16,25 | 10.822 | -23,13 | ||||
| 2025-11-07 | 13F | Sierra Ocean, Llc | 0 | -100,00 | 0 | |||||
| 2026-04-17 | 13F | AdvisorNet Financial, Inc | 96 | 0,00 | 3 | 50,00 | ||||
| 2026-02-06 | 13F | EverSource Wealth Advisors, LLC | 2.903 | -38,13 | 75 | -43,18 | ||||
| 2026-02-10 | 13F | Nomura Asset Management Co Ltd | 0 | 0 | ||||||
| 2026-02-17 | 13F | Toronto Dominion Bank | 203.246 | 5.272 | ||||||
| 2026-04-23 | 13F | Forum Financial Management, LP | 0 | -100,00 | 0 | |||||
| 2026-02-02 | 13F | Fifth Third Bancorp | 285 | 5,95 | 7 | 0,00 | ||||
| 2026-02-05 | 13F | Td Private Client Wealth Llc | 30 | -99,84 | 1 | -100,00 | ||||
| 2026-02-17 | 13F | Point72 Asset Management, L.P. | 0 | -100,00 | 0 | -100,00 | ||||
| 2026-01-21 | 13F | Azzad Asset Management Inc /adv | 142.104 | 0,80 | 3.686 | -7,46 | ||||
| 2026-02-03 | 13F | Crossmark Global Holdings, Inc. | 66.679 | -3,72 | 1.730 | -11,65 | ||||
| 2026-04-20 | 13F | Ronald Blue Trust, Inc. | 3.962 | 0,00 | 137 | 33,33 | ||||
| 2026-02-02 | 13F | Cornerstone Planning Group LLC | 21 | -95,63 | 1 | -100,00 | ||||
| 2026-02-17 | 13F | Nomura Holdings Inc | Call | 150.000 | 3.891 | |||||
| 2026-04-20 | 13F | City State Bank | 510 | 0,00 | 18 | 30,77 | ||||
| 2026-01-15 | 13F | Highline Wealth Partners Llc | 0 | -100,00 | 0 | -100,00 | ||||
| 2026-02-17 | 13F | Public Employees Retirement System Of Ohio | 0 | -100,00 | 0 | |||||
| 2026-04-24 | 13F | Keybank National Association/oh | 8.984 | 310 | ||||||
| 2025-11-14 | 13F | Binnacle Investments Inc | 180 | 17,65 | 5 | 25,00 | ||||
| 2026-02-04 | 13F | LRI Investments, LLC | 153 | 0,00 | 4 | -25,00 | ||||
| 2026-01-14 | 13F | Thompson Investment Management, Inc. | 0 | -100,00 | 0 | |||||
| 2026-01-20 | 13F | Wall Street Access Asset Management, LLC | 3.765 | 0,00 | 98 | -8,49 | ||||
| 2026-02-17 | 13F | Quantessence Capital LLC | 0 | -100,00 | 0 | |||||
| 2026-02-12 | 13F | Callan Family Office, LLC | 60.397 | 302,70 | 1.567 | 270,21 | ||||
| 2026-02-12 | 13F | Earnest Partners Llc | 17.282 | 3,19 | 448 | -5,29 | ||||
| 2026-01-29 | 13F | Rakuten Securities, Inc. | 3.180 | -38,74 | 82 | -43,84 | ||||
| 2025-10-29 | 13F | Arkadios Wealth Advisors | 0 | -100,00 | 0 | -100,00 | ||||
| 2026-04-13 | 13F | Creative Financial Designs Inc /adv | 16 | 0,00 | 1 | |||||
| 2025-11-14 | 13F | Amundi | 0 | -100,00 | 0 | |||||
| 2025-11-14 | 13F | Wolverine Trading, Llc | 30.414 | 58,82 | 854 | 48,26 | ||||
| 2025-11-14 | 13F | Wolverine Trading, Llc | Call | 77.700 | -18,64 | 2.183 | -24,08 | |||
| 2025-11-14 | 13F | Wolverine Trading, Llc | Put | 85.600 | 172,61 | 2.405 | 154,39 | |||
| 2026-02-12 | 13F | Federation des caisses Desjardins du Quebec | 1.571 | -42,98 | 41 | -48,05 | ||||
| 2026-02-10 | 13F | Quantbot Technologies LP | 58.858 | -47,23 | 1.527 | -51,59 | ||||
| 2026-02-10 | 13F | Principia Wealth Advisory, LLC | 28 | 16,67 | 1 | |||||
| 2026-02-06 | 13F | Larson Financial Group LLC | 677 | 35,67 | 18 | 21,43 | ||||
| 2026-02-12 | 13F | Marex Group plc | 0 | -100,00 | 0 | |||||
| 2025-11-06 | 13F | Waterfront Wealth Inc. | 0 | -100,00 | 0 | |||||
| 2026-04-24 | 13F | UMA Financial Services, Inc. | 455 | 0,00 | 16 | 36,36 | ||||
| 2026-02-06 | 13F | Pnc Financial Services Group, Inc. | 138.344 | -24,84 | 3.589 | -31,01 | ||||
| 2026-02-12 | 13F | Triumph Capital Management | 40 | 0,00 | 1 | 0,00 | ||||
| 2026-02-05 | 13F | Tucker Asset Management Llc | 20 | 1 | ||||||
| 2026-02-10 | 13F | Natixis Advisors, L.p. | 23.688 | -95,30 | 1 | -100,00 | ||||
| 2026-02-12 | 13F | Principal Securities, Inc. | 0 | -100,00 | 0 | -100,00 | ||||
| 2026-02-06 | 13F | New Millennium Group LLC | 25 | 0,00 | 1 | |||||
| 2026-02-04 | 13F | Midwest Trust Co | 54.041 | -0,54 | 1.402 | -8,73 | ||||
| 2026-02-13 | 13F | Foresight Global Investors, Inc. | 483.098 | -12,48 | 12.532 | -19,67 | ||||
| 2026-02-06 | 13F | HighTower Advisors, LLC | 9.520 | 9,73 | 247 | 0,41 | ||||
| 2025-11-20 | 13F | First Affirmative Financial Network | 8.633 | 1,84 | 244 | -5,45 | ||||
| 2026-02-03 | 13F | Garner Asset Management Corp | 20.070 | -0,99 | 521 | -9,09 | ||||
| 2025-10-30 | 13F | Ridgewood Investments LLC | Call | 0 | -100,00 | 0 | -100,00 | |||
| 2026-04-08 | 13F | Legacy Wealth Asset Management, LLC | 34.446 | 84,72 | 1.190 | 146,38 | ||||
| 2026-02-17 | 13F | Russell Investments Group, Ltd. | 10.899 | -93,85 | 283 | -94,37 | ||||
| 2026-02-17 | 13F | DV Trading LLC | 900 | 23 | ||||||
| 2026-02-13 | 13F | Barclays Plc | 1.490.731 | 22,00 | 38.670 | 11,99 | ||||
| 2026-01-29 | 13F | Calamos Advisors LLC | 0 | -100,00 | 0 | |||||
| 2026-02-10 | 13F | Lido Advisors, LLC | 11.259 | -14,94 | 298 | -20,32 | ||||
| 2026-02-03 | 13F | Legacy Wealth Managment, LLC/ID | 34 | 0,00 | 1 | |||||
| 2026-04-24 | 13F | Raiffeisen Bank International AG | Call | 500 | 0,00 | 17 | 88,89 | |||
| 2026-02-17 | 13F | Fmr Llc | 770.893 | -4,05 | 19.997 | -11,93 | ||||
| 2026-04-02 | 13F | Ares Financial Consulting, LLC | 982 | 34 | ||||||
| 2026-02-11 | 13F | Sunrise Financial Services, LLC | 421 | 11 | ||||||
| 2025-11-13 | 13F | Kayne Anderson Rudnick Investment Management Llc | 0 | -100,00 | 0 | |||||
| 2026-02-13 | 13F | Ieq Capital, Llc | 27.416 | 17,89 | 711 | 8,22 | ||||
| 2026-02-17 | 13F | Optiver Holding B.V. | Call | 1.441.300 | 2,49 | 37.387 | -5,93 | |||
| 2026-02-17 | 13F | Raymond James Financial Inc | 33.494 | -81,65 | 869 | -83,17 | ||||
| 2025-11-06 | 13F | CENTRAL TRUST Co | 0 | -100,00 | 0 | -100,00 | ||||
| 2026-02-12 | 13F | Steward Partners Investment Advisory, Llc | 769 | -34,10 | 20 | -40,62 | ||||
| 2026-04-17 | 13F | Nova R Wealth, Inc. | 38.829 | -1,23 | 1.342 | 31,60 | ||||
| 2026-02-17 | 13F | Optiver Holding B.V. | Put | 707.800 | -26,68 | 18.360 | -32,70 | |||
| 2026-04-06 | 13F | Miller Global Investments, LLC | 28.047 | 16,76 | 969 | 55,54 | ||||
| 2026-04-22 | 13F | Portus Wealth Advisors, LLC | 933 | 32 | ||||||
| 2026-01-26 | 13F | Grandview Asset Management LLC | 9.054 | -53,29 | 235 | -57,22 | ||||
| 2026-04-23 | 13F | CWM Advisors, LLC | 10.261 | 4,99 | 355 | 39,92 | ||||
| 2026-04-16 | 13F | SG Americas Securities, LLC | 157.971 | 248,25 | 5 | 400,00 | ||||
| 2026-04-20 | 13F | Naples Global Advisors, Llc | 23.875 | -1,34 | 825 | 31,42 | ||||
| 2026-04-23 | 13F | North Star Investment Management Corp. | 35 | 1 | ||||||
| 2026-04-03 | 13F | Ridgewood Investments LLC | 19.597 | -17,05 | 677 | 13,59 | ||||
| 2026-02-17 | 13F | Captrust Financial Advisors | 10.748 | 7,50 | 279 | -1,42 | ||||
| 2026-02-17 | 13F | Bank Of America Corp /de/ | 1.398.010 | -58,50 | 36.264 | -61,91 | ||||
| 2026-02-12 | 13F | Skopos Labs, Inc. | 28.561 | 152,84 | 743 | 118,53 | ||||
| 2026-02-10 | 13F | Bank of New York Mellon Corp | 30.774 | -28,53 | 798 | -34,37 | ||||
| 2026-04-22 | 13F | Stone House Investment Management, LLC | 200 | 100,00 | 7 | 200,00 | ||||
| 2026-02-17 | 13F | Tudor Investment Corp Et Al | Call | 25.900 | -70,20 | 672 | -72,67 | |||
| 2026-02-17 | 13F | Tudor Investment Corp Et Al | Put | 18.100 | -61,08 | 470 | -64,31 | |||
| 2026-02-10 | 13F | Rothschild Investment Llc | 1.221 | -7,15 | 32 | -16,22 | ||||
| 2026-02-10 | 13F | Goldman Sachs Group Inc | Put | 90.000 | 2.335 | |||||
| 2026-02-17 | 13F | Grantham, Mayo, Van Otterloo & Co. LLC | 1.019.708 | 20,47 | 26.451 | 10,58 | ||||
| 2026-02-13 | 13F | Aigen Investment Management, Lp | 0 | -100,00 | 0 | |||||
| 2026-04-22 | 13F | Princeton Global Asset Management LLC | 550 | 0,00 | 19 | 35,71 | ||||
| 2026-04-24 | 13F | Abacus Wealth Partners, LLC | 6.599 | 228 | ||||||
| 2026-02-10 | 13F | Goldman Sachs Group Inc | 4.553.170 | 5,51 | 118.109 | -3,15 | ||||
| 2026-02-10 | 13F | Goldman Sachs Group Inc | Call | 175.000 | 0,00 | 4.540 | -8,21 | |||
| 2025-12-15 | 13F | FNY Investment Advisers, LLC | 0 | -100,00 | 0 | |||||
| 2026-02-11 | 13F | West Family Investments, Inc. | 0 | -100,00 | 0 | -100,00 | ||||
| 2025-11-14 | 13F | Maytus Capital Management, LLC | 0 | -100,00 | 0 | -100,00 | ||||
| 2026-02-13 | 13F | Ingalls & Snyder Llc | 20.342 | -93,97 | 1 | -100,00 | ||||
| 2026-04-20 | 13F | Ritholtz Wealth Management | 16.059 | 74,42 | 555 | 132,77 | ||||
| 2025-11-14 | 13F | Ardsley Advisory Partners Lp | 0 | -100,00 | 0 | -100,00 | ||||
| 2026-04-24 | 13F | Innova Wealth Partners | Call | 10.500 | 363 | |||||
| 2026-04-17 | 13F | Vermillion Wealth Management, Inc. | 195 | 0,00 | 7 | 20,00 | ||||
| 2026-02-13 | 13F | Morgan Stanley | 6.156.161 | 40,61 | 159.691 | 29,07 | ||||
| 2026-02-24 | 13F | DGS Capital Management, LLC | 0 | -100,00 | 0 | |||||
| 2026-04-08 | 13F | Eagle Rock Investment Company, Llc | 6.869 | 237 | ||||||
| 2026-02-17 | 13F | ExodusPoint Capital Management, LP | 0 | -100,00 | 0 | -100,00 | ||||
| 2026-04-23 | 13F | Harbor Investment Advisory, Llc | 34 | 0,00 | 1 | |||||
| 2026-02-17 | 13F | Two Sigma Advisers, Lp | 562.500 | 105,82 | 14.591 | 88,93 | ||||
| 2026-02-12 | 13F | Hrt Financial Lp | 180.340 | 16,49 | 5 | 0,00 | ||||
| 2026-02-04 | 13F | Tsfg, Llc | 37 | 0,00 | 0 | |||||
| 2026-04-13 | 13F | True Wealth Design, LLC | 282 | 187,76 | 10 | 350,00 | ||||
| 2025-11-07 | 13F | HighTower Advisors, LLC | Call | 0 | -100,00 | 0 | -100,00 | |||
| 2026-02-11 | 13F | Parallel Advisors, LLC | 5.055 | -11,38 | 131 | -18,63 | ||||
| 2026-02-17 | 13F | ClearAlpha Technologies LP | 11.324 | 294 | ||||||
| 2025-11-14 | 13F | Symmetry Investments LP | 0 | -100,00 | 0 | -100,00 | ||||
| 2026-02-18 | 13F | Mackenzie Financial Corp | 558.730 | 12,12 | 14.532 | 3,19 | ||||
| 2026-04-20 | 13F | Jfs Wealth Advisors, Llc | 264 | 234,18 | 9 | 350,00 | ||||
| 2026-02-18 | 13F | GWM Advisors LLC | 53 | 0,00 | 1 | 0,00 | ||||
| 2026-01-28 | 13F | Salomon & Ludwin, LLC | 163 | -39,85 | 4 | -42,86 | ||||
| 2026-02-17 | 13F | Align Financial, LLC | 12.970 | 13 | ||||||
| 2026-02-13 | 13F | MAI Capital Management | 3.277 | -0,97 | 85 | -8,60 | ||||
| 2026-02-17 | 13F | SALT Holding Corp. | 75.900 | 0,00 | 1.969 | -8,21 | ||||
| 2026-02-17 | 13F | SALT Holding Corp. | Call | 50.000 | 1.297 | |||||
| 2026-02-03 | 13F | Strengthening Families & Communities, LLC | 0 | -100,00 | 0 | -100,00 | ||||
| 2026-01-30 | 13F/A | M&t Bank Corp | 12.243 | 26,14 | 318 | 15,69 | ||||
| 2026-02-04 | 13F | Summit Wealth Group Llc / Co | 0 | -100,00 | 0 | -100,00 | ||||
| 2026-04-21 | 13F | Aaron Wealth Advisors LLC | 8.987 | 311 | ||||||
| 2026-02-11 | 13F | Simplex Trading, Llc | Call | 240.600 | 105,99 | 6.241 | 207.933,33 | |||
| 2025-10-28 | 13F | Washington Capital Management Inc | 0 | -100,00 | 0 | -100,00 | ||||
| 2025-11-12 | 13F | NewSquare Capital LLC | 0 | -100,00 | 0 | -100,00 | ||||
| 2026-02-06 | 13F | Kimelman & Baird, LLC | 0 | -100,00 | 0 | |||||
| 2026-02-04 | 13F | Abc Arbitrage Sa | 0 | -100,00 | 0 | -100,00 | ||||
| 2025-11-03 | 13F | Annis Gardner Whiting Capital Advisors, LLC | 0 | -100,00 | 0 | |||||
| 2026-04-14 | 13F | Nbc Securities, Inc. | 16.224 | -37,67 | 561 | -17,04 | ||||
| 2026-02-09 | 13F | Huntington National Bank | 1 | 0,00 | 0 | |||||
| 2026-04-24 | 13F | Redwood Wealth Management Group, LLC | 5.980 | 207 | ||||||
| 2026-02-12 | 13F | BlackRock, Inc. | 8.269.221 | 23,24 | 214.504 | 13,12 | ||||
| 2026-01-05 | 13F | Park Avenue Securities Llc | 0 | -100,00 | 0 | |||||
| 2026-02-17 | 13F | Ameriprise Financial Inc | 162.051 | -11,27 | 4.204 | -18,56 | ||||
| 2026-01-28 | 13F | Eagle Global Advisors Llc | 0 | -100,00 | 0 | |||||
| 2026-02-12 | 13F | Hm Payson & Co | 0 | -100,00 | 0 | |||||
| 2026-02-10 | 13F/A | Northwestern Mutual Wealth Management Co | 6.214 | 13,54 | 161 | 4,55 | ||||
| 2026-01-21 | 13F | Indiana Trust & Investment Management CO | 2.250 | 0,00 | 58 | -7,94 | ||||
| 2025-11-14 | 13F | Cubist Systematic Strategies, LLC | Call | 0 | -100,00 | 0 | -100,00 | |||
| 2026-01-23 | 13F | Optima Capital Llc | 365 | 9 | ||||||
| 2026-04-21 | 13F | Pinnacle Associates Ltd | 7.210 | 249 | ||||||
| 2026-01-27 | 13F | TD Waterhouse Canada Inc. | 123 | 3 | ||||||
| 2026-02-13 | 13F | Colony Group, LLC | 0 | -100,00 | 0 | -100,00 | ||||
| 2026-02-13 | 13F | Firsthand Capital Management, Inc. | 5.000 | 0,00 | 130 | -8,51 | ||||
| 2026-02-03 | 13F | Mitsubishi UFJ Kokusai Asset Management Co., Ltd. | 82.020 | 10,88 | 2.245 | 7,37 | ||||
| 2026-02-13 | 13F | Hurley Capital, LLC | 190 | 5 | ||||||
| 2026-02-13 | 13F | Pinnacle Wealth Planning Services, Inc. | 1.519 | 39 | ||||||
| 2026-02-17 | 13F | Balyasny Asset Management Llc | Put | 0 | -100,00 | 0 | -100,00 | |||
| 2026-01-30 | 13F | Rogco, Lp | 215 | 0,00 | 6 | -16,67 | ||||
| 2026-02-05 | 13F | Bessemer Group Inc | 233 | 17,09 | 0 | |||||
| 2026-02-13 | 13F | Walleye Trading LLC | 80.570 | 145,56 | 2.090 | 125,35 | ||||
| 2026-02-13 | 13F | Walleye Trading LLC | Put | 127.500 | 16,23 | 3.307 | 6,68 | |||
| 2026-02-05 | 13F | Elyxium Wealth, LLC | 15 | 0 | ||||||
| 2026-02-13 | 13F | Walleye Trading LLC | Call | 4.000 | -2,44 | 104 | -10,43 | |||
| 2026-02-13 | 13F | Pathstone Holdings, LLC | Call | 3.000 | 1 | |||||
| 2025-10-30 | 13F | Twin Peaks Wealth Advisors, LLC | 0 | -100,00 | 0 | -100,00 | ||||
| 2026-02-13 | 13F | Pathstone Holdings, LLC | 32.671 | 2,01 | 847 | 2,17 | ||||
| 2026-02-13 | 13F | Citigroup Inc | 990.488 | 38,29 | 25.693 | 26,94 | ||||
| 2026-04-21 | 13F | Nemes Rush Group LLC | 27 | 0,00 | 1 | |||||
| 2026-01-28 | 13F | N.E.W. Advisory Services LLC | 100 | 0,00 | 3 | 0,00 | ||||
| 2026-01-16 | 13F | Empirical Financial Services, LLC d.b.a. Empirical Wealth Management | 9.583 | 249 | ||||||
| 2026-02-11 | 13F | Simplex Trading, Llc | Put | 174.500 | 63,70 | 4.527 | 150.766,67 | |||
| 2026-02-13 | 13F | Sei Investments Co | 87.417 | -53,40 | 2.268 | -57,23 | ||||
| 2026-02-17 | 13F | Beaconlight Capital, Llc | 0 | -100,00 | 0 | |||||
| 2026-04-24 | 13F | Ninety One UK Ltd | 4.302 | 149 | ||||||
| 2026-02-06 | 13F | Lloyd Advisory Services, LLC. | 300 | 8 | ||||||
| 2026-02-11 | 13F | Jpmorgan Chase & Co | 3.370.579 | -15,54 | 87.433 | -22,48 | ||||
| 2025-11-13 | 13F | Macquarie Group Ltd | 0 | -100,00 | 0 | -100,00 | ||||
| 2025-11-14 | 13F | Shellback Capital, LP | 0 | -100,00 | 0 | |||||
| 2026-04-14 | 13F | Sterling Investment Advisors Llc /adv | 14.589 | 0,22 | 504 | 33,69 | ||||
| 2026-01-15 | 13F | Frank, Rimerman Advisors LLC | 9.149 | 0,68 | 237 | -7,42 | ||||
| 2026-02-12 | 13F | Penserra Capital Management LLC | 1.517.517 | 63,58 | 39 | 50,00 | ||||
| 2026-02-17 | 13F | Caption Management, LLC | 23.300 | -51,76 | 604 | -55,72 | ||||
| 2026-02-17 | 13F | Engineers Gate Manager LP | 0 | -100,00 | 0 | -100,00 | ||||
| 2025-11-14 | 13F | Prelude Capital Management, Llc | 0 | -100,00 | 0 | |||||
| 2026-01-29 | 13F | UBS Group AG | Put | 62.400 | 0,00 | 1.619 | -8,22 | |||
| 2026-01-29 | 13F | UBS Group AG | Call | 188.600 | 1.223,51 | 4.892 | 1.116,92 | |||
| 2026-01-29 | 13F | UBS Group AG | 1.378.722 | 63,12 | 35.764 | 49,73 | ||||
| 2026-02-06 | 13F | Cullen/frost Bankers, Inc. | 0 | -100,00 | 0 | |||||
| 2026-02-11 | 13F | LPL Financial LLC | 159.000 | 2,55 | 4.124 | -5,87 | ||||
| 2026-04-22 | 13F | Spire Wealth Management | 202 | -3,35 | 7 | 20,00 | ||||
| 2026-02-12 | 13F | BRYN MAWR TRUST Co | 2.000 | 0,00 | 52 | -8,93 | ||||
| 2026-01-27 | 13F | Evergreen Capital Management Llc | 66.477 | 305,05 | 1.724 | 272,35 | ||||
| 2026-02-12 | 13F | New York State Common Retirement Fund | 126.282 | -12,90 | 3.276 | -20,06 | ||||
| 2026-02-20 | 13F | Sunbelt Securities, Inc. | 856 | 0,00 | 22 | -8,33 | ||||
| 2026-02-17 | 13F | Advisor Group Holdings, Inc. | 26.139 | -13,38 | 678 | -18,51 | ||||
| 2026-02-13 | 13F | Rhumbline Advisers | 20.901 | 16,35 | 542 | 6,90 | ||||
| 2026-02-17 | 13F | Duquesne Family Office LLC | 773.555 | 20 | ||||||
| 2026-02-17 | 13F | Parvin Asset Management, LLC | 3.355 | -30,18 | 87 | -35,56 | ||||
| 2026-02-03 | 13F | Sequoia Financial Advisors, LLC | 7.726 | -39,84 | 200 | -44,75 | ||||
| 2026-02-06 | 13F | Covestor Ltd | 2.205 | 5,86 | 0 | |||||
| 2026-02-13 | 13F | Gts Securities Llc | 16.427 | 43,45 | 426 | 31,89 | ||||
| 2025-11-14 | 13F | Graham Capital Management, L.P. | 0 | -100,00 | 0 | -100,00 | ||||
| 2025-11-14 | 13F | Polymer Capital Management (US) LLC | 0 | -100,00 | 0 | -100,00 | ||||
| 2026-02-12 | 13F | Peterson Wealth Services | 37 | -96,86 | 1 | -100,00 | ||||
| 2026-02-13 | 13F | Walleye Capital LLC | Call | 19.200 | -21,95 | 498 | -28,35 | |||
| 2026-01-23 | 13F | Hardman Johnston Global Advisors LLC | 372.431 | -3,65 | 9.661 | -11,56 | ||||
| 2026-02-13 | 13F | Walleye Capital LLC | Put | 269.300 | 169,57 | 6.986 | 147,43 | |||
| 2026-02-13 | 13F | Walleye Capital LLC | 150.874 | 103,91 | 3.914 | 87,14 | ||||
| 2026-02-17 | 13F | Imprint Wealth LLC | 0 | -100,00 | 0 | |||||
| 2026-02-17 | 13F | Quantitative Investment Management, LLC | 54.560 | 386,93 | 1 | |||||
| 2026-02-13 | 13F | Stifel Financial Corp | 164.422 | 39,48 | 4.265 | 28,04 | ||||
| 2026-04-07 | 13F | Farther Finance Advisors, LLC | 7.064 | 151,39 | 244 | 237,50 | ||||
| 2026-01-14 | 13F | Net Worth Advisory Group | 11.120 | 288 | ||||||
| 2026-04-16 | 13F | Toth Financial Advisory Corp | 54 | 1.250,00 | 2 |