Grundlæggende statistik
| Institutionelle aktier (lange) | 159.238.266 - 90,58% (ex 13D/G) - change of -2,27MM shares -1,09% MRQ |
| Institutionel værdi (lang) | $ 5.367.219 USD ($1000) |
Institutionelt ejerskab og aktionærer
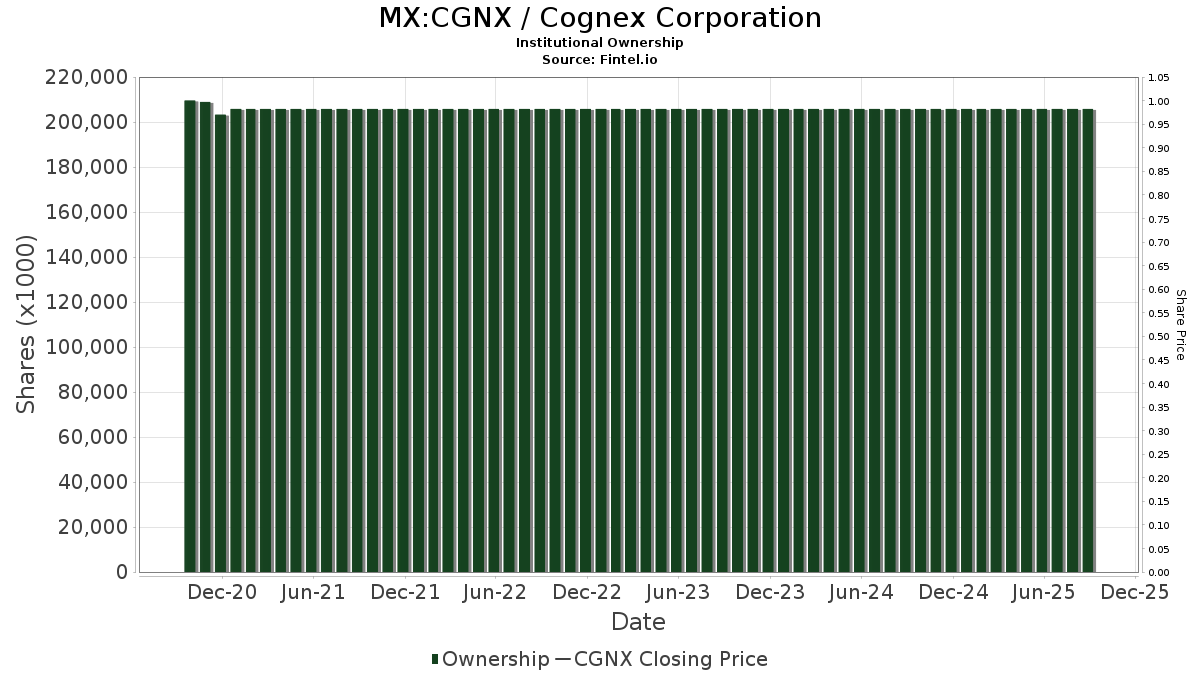
Cognex Corporation (MX:CGNX) har 540 institutionelle ejere og aktionærer, der har indsendt 13D/G- eller 13F-formularer til Securities Exchange Commission (SEC). Disse institutioner har i alt 159,238,266 aktier. Største aktionærer omfatter Vanguard Group Inc, BlackRock, Inc., Nordea Investment Management Ab, Pictet Asset Management Holding SA, Price T Rowe Associates Inc /md/, State Street Corp, Disciplined Growth Investors Inc /mn, Geode Capital Management, Llc, Point72 Asset Management, L.P., and Mackenzie Financial Corp .
Cognex Corporation (BMV:CGNX) institutionel ejerskabsstruktur viser aktuelle positioner i virksomheden efter institutioner og fonde, samt seneste ændringer i positionsstørrelse. Større aktionærer kan omfatte individuelle investorer, investeringsforeninger, hedgefonde eller institutioner. Skema 13D angiver, at investoren besidder (eller besidder) mere end 5 % af virksomheden og har til hensigt (eller har til hensigt at) aktivt at forfølge en ændring i forretningsstrategi. Skema 13G indikerer en passiv investering på over 5%.
Fondens stemningsscore
Fund Sentiment Score (fka Ownership Accumulation Score) finder de aktier, der bliver mest købt af fonde. Det er resultatet af en sofistikeret, multi-faktor kvantitativ model, der identificerer virksomheder med de højeste niveauer af institutionel akkumulering. Scoringsmodellen bruger en kombination af den samlede stigning i oplyste ejere, ændringerne i porteføljeallokeringer i disse ejere og andre målinger. Tallet går fra 0 til 100, hvor højere tal indikerer et højere niveau af akkumulering for sine jævnaldrende, og 50 er gennemsnittet.
Opdateringsfrekvens: Dagligt
Se Ownership Explorer, som giver en liste over højest rangerende virksomheder.
AI+ Ask Fintel’s AI assistant about Cognex Corporation.
Select a question to share a public post with an AI-crafted answer.
Thinking of good questions…
13F og NPORT arkivering
Detaljer om 13F-arkivering er gratis. Detaljer om NP-ansøgninger kræver et premium-medlemskab. Grønne rækker angiver nye positioner. Røde rækker angiver lukkede positioner. Klik på linket ikon for at se den fulde transaktionshistorik.
Opgrader
for at låse premium-data op og eksportere til Excel ![]() .
.
| Fil dato | Kilde | Investor | Type | Gennemsnitlig pris (Øst) |
Aktier | Δ Aktier (%) |
Rapporteret Værdi ($1000) |
Δ Værdi (%) |
Port Alloc (%) |
|
|---|---|---|---|---|---|---|---|---|---|---|
| 2026-02-11 | 13F | Manchester Capital Management LLC | 82 | 3 | ||||||
| 2026-04-07 | 13F | Signaturefd, Llc | 4.314 | 0,05 | 211 | 36,13 | ||||
| 2026-02-09 | 13F | Malaga Cove Capital, LLC | 9.816 | 353 | ||||||
| 2026-02-10 | 13F | Mitsubishi UFJ Morgan Stanley Securities Co., Ltd. | 5.014 | 180 | ||||||
| 2026-02-11 | 13F | Buckingham Strategic Partners | 0 | -100,00 | 0 | |||||
| 2025-11-06 | 13F | Compagnie Lombard Odier SCmA | 0 | 0 | ||||||
| 2026-02-13 | 13F | Dymon Asia Capital (singapore) Pte. Ltd. | 0 | -100,00 | 0 | |||||
| 2026-02-09 | 13F | Employees Retirement System of Texas | 2.685 | 0 | ||||||
| 2026-04-15 | 13F | DAVENPORT & Co LLC | 318.316 | -33,36 | 15.594 | -9,26 | ||||
| 2026-02-17 | 13F | Advisory Services Network, LLC | 16.621 | 0,40 | 598 | -20,16 | ||||
| 2026-02-18 | 13F | EP Wealth Advisors, Inc. | 5.615 | 202 | ||||||
| 2026-01-21 | 13F | Raleigh Capital Management Inc. | 54 | 2 | ||||||
| 2026-02-12 | 13F | Commonwealth Equity Services, Llc | 9.697 | 13,69 | 349 | |||||
| 2026-02-11 | 13F | Wharton Business Group, LLC | 6.270 | 0,00 | 226 | -20,77 | ||||
| 2026-04-20 | 13F | Foster Victor Wealth Advisors, LLC | 209.575 | -41,38 | 11.648 | -20,37 | ||||
| 2026-02-17 | 13F | Frontier Capital Management Co Llc | 688.622 | -39,89 | 24.777 | -52,26 | ||||
| 2026-04-21 | 13F | Pinnacle Associates Ltd | 449.680 | -7,48 | 22.030 | 25,97 | ||||
| 2026-01-23 | 13F | Altfest L J & Co Inc | 13.799 | -13,79 | 496 | -31,59 | ||||
| 2026-01-27 | 13F | First Horizon Corp | 845 | 0,00 | 30 | -21,05 | ||||
| 2026-04-20 | 13F | Assenagon Asset Management S.A. | 80.908 | 91,43 | 3.964 | 160,72 | ||||
| 2026-02-09 | 13F | Kazazian Asset Management, LLC | 0 | -100,00 | 0 | |||||
| 2026-02-11 | 13F | Deutsche Bank Ag\ | 25.576 | 4,39 | 920 | -17,04 | ||||
| 2025-11-14 | 13F | Two Sigma Securities, Llc | 0 | -100,00 | 0 | -100,00 | ||||
| 2026-04-06 | 13F | GAMMA Investing LLC | 5.034 | 29,84 | 247 | 76,98 | ||||
| 2026-02-17 | 13F | Graham Capital Management, L.P. | 32.157 | 19,43 | 1.157 | -5,09 | ||||
| 2026-02-10 | 13F | Lido Advisors, LLC | 11.471 | -0,46 | 513 | -1,92 | ||||
| 2026-04-13 | 13F | Massmutual Trust Co Fsb/adv | 1.073 | 2,00 | 53 | 40,54 | ||||
| 2026-02-17 | 13F | Bank Of America Corp /de/ | 481.272 | 21,72 | 17.316 | -3,32 | ||||
| 2025-11-13 | 13F | Clear Street Markets Llc | 0 | -100,00 | 0 | |||||
| 2026-02-24 | 13F | MidFirst Bank | 25 | 1 | ||||||
| 2026-02-13 | 13F | Fiduciary Trust Co | 10.585 | -5,45 | 381 | -25,05 | ||||
| 2026-01-29 | 13F | IMC-Chicago, LLC | 38.684 | -69,58 | 1.392 | -75,85 | ||||
| 2026-02-13 | 13F | Ubs Asset Management Americas Inc | 355.072 | -3,31 | 12.775 | -23,20 | ||||
| 2025-11-14 | 13F | Lombard Odier Asset Management (USA) Corp | 0 | -100,00 | 0 | |||||
| 2026-01-29 | 13F | IMC-Chicago, LLC | Put | 11.800 | 425 | |||||
| 2026-02-18 | 13F | GWM Advisors LLC | 12.607 | 21,85 | 454 | -3,21 | ||||
| 2026-01-29 | 13F | IMC-Chicago, LLC | Call | 23.800 | 856 | |||||
| 2026-02-02 | 13F | Truist Financial Corp | 26.660 | -69,50 | 959 | -75,78 | ||||
| 2026-02-05 | 13F | Northwestern Mutual Investment Management Company, Llc | 37.498 | 0,20 | 1.349 | -20,41 | ||||
| 2026-02-04 | 13F | Atlantic Union Bankshares Corp | 10.816 | -0,03 | 389 | -20,61 | ||||
| 2026-02-09 | 13F | Quest Partners LLC | 26.979 | 65,82 | 971 | 31,61 | ||||
| 2026-02-17 | 13F | Brown Capital Management Llc | 638.019 | -55,81 | 22.956 | -64,90 | ||||
| 2026-04-08 | 13F | DiNuzzo Private Wealth, Inc. | 5 | 0,00 | 0 | |||||
| 2026-01-29 | 13F | UBS Group AG | 821.150 | -31,74 | 29.545 | -45,79 | ||||
| 2025-11-12 | 13F | Edgestream Partners, L.P. | 0 | -100,00 | 0 | -100,00 | ||||
| 2026-02-17 | 13F | Bayesian Capital Management, LP | 0 | -100,00 | 0 | |||||
| 2026-02-11 | 13F | CNB Bank | 19 | 0,00 | 1 | |||||
| 2026-02-10 | 13F | Future Fund LLC | 54.000 | 1.943 | ||||||
| 2026-02-12 | 13F | MetLife Investment Management, LLC | 81.896 | -5,10 | 2.947 | -24,64 | ||||
| 2026-02-13 | 13F | Transamerica Financial Advisors, Inc. | 1 | 0 | ||||||
| 2026-02-17 | 13F | Armistice Capital, Llc | 8.242 | 297 | ||||||
| 2026-02-05 | 13F | Stephens Investment Management Group LLC | 1.104.783 | 0,39 | 39.750 | -20,26 | ||||
| 2026-02-06 | 13F | Global Retirement Partners, LLC | Call | 0 | -100,00 | 0 | ||||
| 2026-02-27 | 13F | Strategic Investment Solutions, Inc. /IL | 0 | -100,00 | 0 | |||||
| 2026-04-10 | 13F/A | Aegon Asset Management Uk Plc | 46 | 0,00 | 3 | 50,00 | ||||
| 2026-04-22 | 13F | Pictet Asset Management Holding SA | 6.673.031 | -4,85 | 326.758 | 29,48 | ||||
| 2026-02-13 | 13F | Keystone Investors Pte Ltd | 0 | -100,00 | 0 | |||||
| 2026-01-14 | 13F | Hennion & Walsh Asset Management, Inc. | 5.894 | 212 | ||||||
| 2026-02-17 | 13F | Captrust Financial Advisors | 72.899 | -0,49 | 2.623 | -20,98 | ||||
| 2026-04-17 | 13F | Bell Investment Advisors, Inc | 146 | 0,00 | 7 | 40,00 | ||||
| 2026-02-17 | 13F | Citadel Advisors Llc | 868.705 | 423,28 | 31.256 | 315,64 | ||||
| 2026-04-24 | 13F | Yousif Capital Management, Llc | 48.767 | -5,39 | 2.389 | 19,09 | ||||
| 2026-01-12 | 13F | Rialto Wealth Management, LLC | 25 | 0,00 | 1 | -100,00 | ||||
| 2026-02-17 | 13F | Citadel Advisors Llc | Call | 40.200 | 1,77 | 1.446 | -19,17 | |||
| 2026-02-17 | 13F | Citadel Advisors Llc | Put | 102.100 | -16,79 | 3.674 | -33,92 | |||
| 2026-02-17 | 13F | Trexquant Investment LP | 434.853 | 32,38 | 15.646 | 5,15 | ||||
| 2026-02-17 | 13F | SummitTX Capital, L.P. | 11.937 | 429 | ||||||
| 2026-04-21 | 13F | Wesbanco Bank Inc | 26.700 | 40,53 | 1.308 | 91,51 | ||||
| 2026-02-02 | 13F | Danske Bank A/s | 2.000 | 0,00 | 72 | -21,11 | ||||
| 2026-04-27 | 13F | JB Capital LLC | 96.832 | 37,39 | 4.744 | 87,10 | ||||
| 2026-02-09 | 13F | Legal & General Group Plc | 1.152.053 | 11,05 | 41.451 | -11,80 | ||||
| 2026-02-17 | 13F | Raymond James Financial Inc | 1.028.179 | -11,53 | 37.124 | -29,48 | ||||
| 2026-02-03 | 13F | Everence Capital Management Inc | 0 | -100,00 | 0 | |||||
| 2026-02-12 | 13F | Brown Brothers Harriman & Co | 35 | -69,57 | 1 | -80,00 | ||||
| 2026-02-13 | 13F | SRS Capital Advisors, Inc. | 2.574 | -97,20 | 93 | -97,79 | ||||
| 2026-01-27 | 13F | Zurcher Kantonalbank (Zurich Cantonalbank) | 34.154 | 5,80 | 1.229 | -16,01 | ||||
| 2026-04-20 | 13F | Ronald Blue Trust, Inc. | 1.549 | -13,27 | 76 | 17,19 | ||||
| 2026-01-15 | 13F | Allspring Global Investments Holdings, LLC | 20.392 | 753 | ||||||
| 2026-02-18 | 13F | Vident Advisory, LLC | 6.335 | -25,65 | 228 | -41,04 | ||||
| 2026-01-26 | 13F | Mirae Asset Global Investments Co., Ltd. | 32.594 | 9,01 | 1.173 | -13,44 | ||||
| 2026-04-13 | 13F | Robinhood Asset Management, LLC | 145.117 | 7.109 | ||||||
| 2026-02-09 | 13F | William Blair Investment Management, Llc | 1.053.280 | 18,58 | 37.897 | -5,82 | ||||
| 2026-02-10 | 13F | Advisor Resource Council | 8.004 | 318 | ||||||
| 2026-04-13 | 13F | Mather Group, Llc. | 409 | 20 | ||||||
| 2026-02-11 | 13F | Picton Mahoney Asset Management | 148.982 | 30,47 | 5.360 | 107.100,00 | ||||
| 2026-02-17 | 13F | Lombard Odier Asset Management (Europe) Ltd | 19.554 | -64,83 | 704 | -90,13 | ||||
| 2026-02-17 | 13F | Magnetar Financial LLC | 6.063 | -86,97 | 218 | -89,65 | ||||
| 2026-02-13 | 13F | MAI Capital Management | 300 | 88,68 | 11 | 42,86 | ||||
| 2026-02-13 | 13F | Wells Fargo & Company/mn | 68.388 | 6,73 | 2.461 | -15,23 | ||||
| 2026-02-13 | 13F | Wells Fargo & Company/mn | Call | 104.000 | 3.742 | |||||
| 2026-02-02 | 13F | Fifth Third Bancorp | 3.338 | -8,55 | 120 | -27,27 | ||||
| 2026-02-12 | 13F | Skopos Labs, Inc. | 5.518 | 201 | ||||||
| 2026-04-15 | 13F | Tema Etfs Llc | 308.690 | 26,96 | 15.123 | 72,86 | ||||
| 2026-04-14 | 13F | Bay Harbor Wealth Management, LLC | 12 | 200,00 | 1 | |||||
| 2026-02-17 | 13F | Susquehanna Portfolio Strategies, LLC | 168.083 | 0,00 | 6.048 | -20,58 | ||||
| 2026-02-11 | 13F | Jpmorgan Chase & Co | 412.400 | 5,72 | 14.838 | -16,04 | ||||
| 2026-02-12 | 13F | Bank Of Montreal /can/ | 25.104 | -8,17 | 903 | -27,06 | ||||
| 2026-02-13 | 13F | BNP Paribas Asset Management Holding S.A. | 1.033.757 | 65.244,94 | 37 | |||||
| 2026-04-15 | 13F | Activest Wealth Management | 8 | 0 | ||||||
| 2026-02-04 | 13F | HighPoint Advisor Group LLC | 5.675 | -2,96 | 204 | -22,73 | ||||
| 2026-02-11 | 13F | United Financial Planning Group LLC | 8 | 0 | ||||||
| 2026-02-17 | 13F | D. E. Shaw & Co., Inc. | 13.022 | -82,25 | 469 | -85,92 | ||||
| 2026-02-06 | 13F | Tredje AP-fonden | 0 | -100,00 | 0 | |||||
| 2026-02-09 | 13F | Huntington National Bank | 1.473 | -12,53 | 53 | -31,58 | ||||
| 2026-02-11 | 13F | Franklin Resources Inc | 15.927 | -0,38 | 573 | -20,86 | ||||
| 2026-02-17 | 13F | Tcw Group Inc | 653.459 | -4,06 | 23.511 | -23,80 | ||||
| 2026-02-13 | 13F | Arrowstreet Capital, Limited Partnership | 942.999 | 20,47 | 33.929 | -4,31 | ||||
| 2026-02-17 | 13F | Snowden Capital Advisors LLC | 14.069 | -15,53 | 506 | -32,89 | ||||
| 2026-02-18 | 13F | Mackenzie Financial Corp | 2.613.312 | -11,07 | 94.859 | -28,74 | ||||
| 2026-01-30 | 13F | Torren Management, LLC | 42 | 2 | ||||||
| 2026-02-17 | 13F | Shelton Capital Management | 6.085 | 0,00 | 219 | -20,73 | ||||
| 2026-02-04 | 13F | Virginia Retirement Systems Et Al | 26.000 | 49,43 | 935 | 18,65 | ||||
| 2026-04-16 | 13F | SG Americas Securities, LLC | 240.572 | -17,05 | 12 | 10,00 | ||||
| 2026-02-13 | 13F | Rhumbline Advisers | 447.071 | -3,34 | 16.086 | -23,23 | ||||
| 2026-02-13 | 13F | Walleye Capital LLC | Call | 7.100 | 255 | |||||
| 2026-02-13 | 13F | Mml Investors Services, Llc | 10.548 | -7,68 | 380 | -26,69 | ||||
| 2026-02-13 | 13F | Walleye Capital LLC | Put | 5.000 | 180 | |||||
| 2026-02-13 | 13F | Walleye Capital LLC | 663 | 24 | ||||||
| 2026-02-13 | 13F | Pinnacle Wealth Planning Services, Inc. | 213 | 8 | ||||||
| 2026-02-17 | 13F | North Capital, Inc. | 0 | -100,00 | 0 | |||||
| 2026-02-06 | 13F | HighTower Advisors, LLC | 23.006 | 1,46 | 828 | -19,47 | ||||
| 2026-02-09 | 13F | Keating Financial Advisory Services, Inc. | 1 | 0 | ||||||
| 2026-04-24 | 13F | Optas, LLC | 5.183 | 254 | ||||||
| 2026-02-13 | 13F | Neuberger Berman Group LLC | 39.785 | -1,12 | 1.431 | -21,46 | ||||
| 2026-04-22 | 13F | Sterling Capital Management LLC | 5.629 | -43,29 | 276 | -22,97 | ||||
| 2026-02-17 | 13F | Fmr Llc | 28.708 | -29,49 | 1.033 | -44,03 | ||||
| 2026-01-27 | 13F | Lecap Asset Management Ltd | 27.920 | -15,03 | 1.005 | -32,53 | ||||
| 2026-01-29 | 13F | Comerica Bank | 67.957 | -47,38 | 2.445 | -58,20 | ||||
| 2026-02-06 | 13F | Handelsbanken Fonder AB | 758.831 | 76,31 | 27 | 42,11 | ||||
| 2026-02-11 | 13F | Capital International Investors | 1.280.272 | 5,03 | 46.064 | -16,58 | ||||
| 2026-01-07 | 13F | Retirement Wealth Solutions LLC | 0 | -100,00 | 0 | |||||
| 2026-04-23 | 13F | PayPay Securities Corp | 19 | -40,62 | 1 | 0,00 | ||||
| 2026-02-06 | 13F | Legato Capital Management LLC | 25.916 | 63,54 | 932 | 29,99 | ||||
| 2026-01-30 | 13F | Joel Isaacson & Co., LLC | 0 | -100,00 | 0 | |||||
| 2026-01-29 | 13F | Copeland Capital Management, LLC | 1.407.994 | -6,43 | 50.660 | -25,69 | ||||
| 2026-04-17 | 13F | Fifth Third Wealth Advisors LLC | 5.459 | 267 | ||||||
| 2025-11-14 | 13F | Sofos Investments, Inc. | 0 | -100,00 | 0 | |||||
| 2026-02-12 | 13F | Quadrant Capital Group Llc | 22.907 | 1,03 | 824 | -19,77 | ||||
| 2026-02-17 | 13F | Advisor Group Holdings, Inc. | 20.914 | -3,43 | 752 | -22,63 | ||||
| 2026-02-17 | 13F | NEOS Investment Management LLC | 243.136 | -4,39 | 8.748 | -24,06 | ||||
| 2026-02-12 | 13F | Groupe la Francaise | 0 | -100,00 | 0 | |||||
| 2025-11-04 | 13F | Gitterman Wealth Management, LLC | 0 | -100,00 | 0 | |||||
| 2026-02-03 | 13F | Sprucegrove Investment Management Ltd | 3.200 | -13,51 | 115 | -31,14 | ||||
| 2026-02-13 | 13F | Kestra Advisory Services, LLC | 2.738 | 99 | ||||||
| 2026-02-13 | 13F | FORA Capital, LLC | 12.458 | 447 | ||||||
| 2026-02-11 | 13F | Winton Capital Group Ltd | 7.800 | -24,27 | 281 | -39,91 | ||||
| 2026-02-13 | 13F | Police & Firemen's Retirement System of New Jersey | 70.423 | -5,61 | 2.534 | -25,04 | ||||
| 2026-03-03 | 13F/A | Caitong International Asset Management Co., Ltd | 20 | 1 | ||||||
| 2026-02-17 | 13F | Maryland State Retirement & Pension System | 8.033 | 0,00 | 289 | -20,39 | ||||
| 2026-01-23 | 13F | Avion Wealth | 37 | 0,00 | 0 | |||||
| 2026-02-03 | 13F | Strengthening Families & Communities, LLC | 0 | -100,00 | 0 | |||||
| 2026-02-11 | 13F | Empowered Funds, LLC | 6.550 | 0,63 | 236 | -20,07 | ||||
| 2026-04-17 | 13F | Riverbridge Partners Llc | 715.343 | -17,50 | 35.045 | 12,33 | ||||
| 2026-02-10 | 13F | Meramec Financial Planners, LLC | 121 | 5 | ||||||
| 2026-02-06 | 13F | Covestor Ltd | 2.151 | -21,32 | 0 | |||||
| 2026-04-10 | 13F | Marshall Financial Group LLC | 23.680 | 0,10 | 1.160 | 36,31 | ||||
| 2026-04-07 | 13F | Farther Finance Advisors, LLC | 3.144 | 34,02 | 155 | 84,52 | ||||
| 2026-02-13 | 13F | Alyeska Investment Group, L.P. | 1.900.718 | 68.388 | ||||||
| 2026-02-17 | 13F | Engaged Capital LLC | 933.000 | 9,12 | 33.569 | -13,33 | ||||
| 2026-02-05 | 13F | Stephens Inc /ar/ | 22.153 | -3,84 | 797 | -23,59 | ||||
| 2026-02-09 | 13F | Atlantic Trust, LLC | 152 | 17,83 | 5 | 0,00 | ||||
| 2026-02-13 | 13F | Bridge City Capital, LLC | 51.294 | -14,16 | 1.846 | -31,82 | ||||
| 2026-02-10 | 13F | New Mexico Educational Retirement Board | 35.356 | 0,00 | 1 | 0,00 | ||||
| 2026-02-02 | 13F | Your Advocates Ltd., LLP | 121 | 0,00 | 4 | -20,00 | ||||
| 2026-02-13 | 13F | Caxton Associates Llp | 8.164 | 294 | ||||||
| 2025-11-13 | 13F | Perbak Capital Partners LLP | 0 | -100,00 | 0 | |||||
| 2026-02-09 | 13F | Smithfield Trust Co | 250 | 0,00 | 0 | |||||
| 2026-02-12 | 13F | Bank of Jackson Hole Trust | 96 | 3 | ||||||
| 2026-02-13 | 13F | Chevy Chase Trust Holdings, Inc. | 1.471.631 | -8,69 | 52.949 | -27,47 | ||||
| 2026-04-09 | 13F | Acropolis Investment Management, LLC | 3.066 | 150 | ||||||
| 2026-02-13 | 13F | Pinney & Scofield, Inc. | 2.770 | 0,00 | 100 | -20,80 | ||||
| 2026-02-06 | 13F | Larson Financial Group LLC | 1.105 | 202,74 | 40 | 143,75 | ||||
| 2026-02-11 | 13F | Hodges Capital Management Inc. | 48.872 | 1.758 | ||||||
| 2026-02-13 | 13F | Needham Investment Management Llc | 173.000 | 6,13 | 6.225 | -15,70 | ||||
| 2026-02-17 | 13F | Brevan Howard Capital Management LP | 0 | -100,00 | 0 | -100,00 | ||||
| 2026-04-21 | 13F | Aaron Wealth Advisors LLC | 16.352 | -47,05 | 801 | -27,90 | ||||
| 2026-02-09 | 13F | Wcm Investment Management, Llc | 380.130 | -14,57 | 13.825 | -31,79 | ||||
| 2026-02-12 | 13F | Elo Mutual Pension Insurance Co | 49.207 | 149,19 | 1.770 | 97,99 | ||||
| 2025-11-14 | 13F | Holocene Advisors, LP | 0 | -100,00 | 0 | -100,00 | ||||
| 2026-02-11 | 13F | Jpmorgan Chase & Co | Call | 0 | -100,00 | 0 | -100,00 | |||
| 2025-10-31 | 13F | Symphony Financial, Ltd. Co. | 0 | -100,00 | 0 | -100,00 | ||||
| 2026-02-17 | 13F | Alliancebernstein L.p. | 237.281 | 4,31 | 8.537 | -17,15 | ||||
| 2026-02-17 | 13F | Janus Henderson Group Plc | 1.469.977 | 28,59 | 52.868 | 2,08 | ||||
| 2026-01-28 | 13F | Klp Kapitalforvaltning As | 35.900 | 1,99 | 1.292 | -19,01 | ||||
| 2026-02-12 | 13F | Geneva Capital Management Llc | 0 | -100,00 | 0 | |||||
| 2026-02-12 | 13F | EntryPoint Capital, LLC | 0 | -100,00 | 0 | |||||
| 2026-02-12 | 13F | Principal Securities, Inc. | 0 | -100,00 | 0 | -100,00 | ||||
| 2025-11-14 | 13F | Polymer Capital Management (US) LLC | 0 | -100,00 | 0 | |||||
| 2026-02-10 | 13F | Bnp Paribas Arbitrage, Sa | 291.339 | 351,58 | 10.482 | 258,73 | ||||
| 2026-04-21 | 13F | First United Bank Trust/ | 200 | 0,00 | 10 | 28,57 | ||||
| 2026-02-10 | 13F | Bnp Paribas Arbitrage, Sa | Call | 400 | 545,16 | 1.439 | 413,93 | |||
| 2026-02-17 | 13F | Schonfeld Strategic Advisors LLC | 392.377 | -21,12 | 14.118 | -37,35 | ||||
| 2026-04-17 | 13F | HHM Wealth Advisors, LLC | 1.923 | 0,00 | 94 | 36,23 | ||||
| 2026-02-13 | 13F | Pathstone Holdings, LLC | 54.567 | -1,58 | 1.963 | -21,82 | ||||
| 2026-02-17 | 13F | Jain Global LLC | 53.555 | 1.927 | ||||||
| 2026-02-12 | 13F | Jane Street Group, Llc | 182.574 | 3,02 | 6.569 | -18,17 | ||||
| 2026-02-17 | 13F | Cresset Asset Management, LLC | 0 | -100,00 | 0 | -100,00 | ||||
| 2026-02-17 | 13F | State Of Wisconsin Investment Board | 156.352 | 88,14 | 5.626 | 49,44 | ||||
| 2026-02-12 | 13F | Jane Street Group, Llc | Call | 12.100 | -45,74 | 435 | -56,93 | |||
| 2026-02-13 | 13F/A | Ontario Teachers Pension Plan Board | 0 | -100,00 | 0 | |||||
| 2026-04-07 | 13F | CoreCap Advisors, LLC | 553 | 38,25 | 27 | 92,86 | ||||
| 2026-02-13 | 13F | Essex Investment Management Co Llc | 36.260 | -7,00 | 1.305 | -26,16 | ||||
| 2026-02-10 | 13F | Bruce G. Allen Investments, LLC | 72 | 0,00 | 3 | -33,33 | ||||
| 2026-04-14 | 13F | Beacon Investment Advisory Services, Inc. | 89.673 | -0,82 | 4.393 | 35,04 | ||||
| 2026-04-14 | 13F | Nbc Securities, Inc. | 2.529 | -22,16 | 124 | 6,03 | ||||
| 2026-04-20 | 13F | Louisiana State Employees Retirement System | 48.000 | 3,45 | 2.352 | 40,86 | ||||
| 2025-11-14 | 13F | AXA Investment Managers S.A. | 949.895 | 43.030 | ||||||
| 2026-02-17 | 13F | Tower Research Capital LLC (TRC) | 6.738 | -15,78 | 242 | -33,15 | ||||
| 2026-04-10 | 13F | Kopion Asset Management, LLC | 96.065 | -41,11 | 4.706 | -19,82 | ||||
| 2026-02-13 | 13F | Landscape Capital Management, L.l.c. | 59.367 | 2.136 | ||||||
| 2026-02-17 | 13F | Crawford Investment Counsel Inc | 0 | -100,00 | 0 | |||||
| 2025-11-14 | 13F | Atom Investors LP | 0 | -100,00 | 0 | |||||
| 2026-04-21 | 13F | Pallas Capital Advisors LLC | 15.445 | -33,16 | 757 | -9,03 | ||||
| 2026-02-04 | 13F | Pensionmark Financial Group, Llc | 5.859 | -6,56 | 211 | -26,06 | ||||
| 2026-04-21 | 13F | Founders Capital Management | 175 | 9 | ||||||
| 2026-02-23 | 13F | Mv Capital Management, Inc. | 9 | 0,00 | 0 | |||||
| 2026-04-23 | 13F | Oppenheimer Asset Management Inc. | 291.947 | -4,71 | 14.302 | 29,75 | ||||
| 2026-01-16 | 13F | Postrock Partners Llc | 9.694 | 0,00 | 349 | -20,73 | ||||
| 2026-02-12 | 13F | Advisors Asset Management, Inc. | 20.121 | 8,64 | 724 | -13,72 | ||||
| 2026-02-05 | 13F | HFM Investment Advisors, LLC | 2 | 0,00 | 0 | |||||
| 2026-02-17 | 13F | XTX Topco Ltd | 11.275 | 406 | ||||||
| 2026-04-06 | 13F | Miller Global Investments, LLC | 1.079 | 0,00 | 53 | 36,84 | ||||
| 2026-01-23 | 13F | Successful Portfolios LLC | 0 | -100,00 | 0 | |||||
| 2026-02-02 | 13F | Mutual Advisors, LLC | 26.061 | -4,62 | 938 | -28,58 | ||||
| 2026-02-13 | 13F | Prudential Financial Inc | 16.770 | -87,78 | 603 | -90,30 | ||||
| 2026-01-20 | 13F | Philip James Wealth Mangement, LLC | 7.025 | 2,35 | 253 | -18,71 | ||||
| 2026-04-14 | 13F | Clean Yield Group | 1.000 | 0,00 | 49 | 37,14 | ||||
| 2026-02-17 | 13F | Summit Trail Advisors, Llc | 42.433 | 26,98 | 1.527 | 0,86 | ||||
| 2026-02-20 | 13F | Sunbelt Securities, Inc. | 245 | 0,00 | 9 | -27,27 | ||||
| 2026-02-17 | 13F | Susquehanna Fundamental Investments, Llc | 105.440 | 0,00 | 3.794 | -20,58 | ||||
| 2025-11-07 | 13F | Shell Asset Management Co | 0 | -100,00 | 0 | |||||
| 2025-11-06 | 13F | Versor Investments LP | 0 | -100,00 | 0 | -100,00 | ||||
| 2026-02-05 | 13F | Thrivent Financial For Lutherans | 293.191 | 9,83 | 11 | -16,67 | ||||
| 2026-02-09 | 13F | Geode Capital Management, Llc | 3.950.299 | 27,12 | 142.154 | 0,96 | ||||
| 2026-04-15 | 13F | Fortitude Family Office, LLC | 80 | 81,82 | 4 | 200,00 | ||||
| 2026-02-11 | 13F | Zions Bancorporation, National Association /ut/ | 30 | 1 | ||||||
| 2026-02-11 | 13F | Syon Capital Llc | 12.279 | 442 | ||||||
| 2026-04-24 | 13F | Retirement Systems of Alabama | 203.150 | 1,00 | 9.952 | 37,52 | ||||
| 2026-04-27 | 13F | Nvwm, Llc | 1.037 | 0,00 | 51 | 35,14 | ||||
| 2026-02-17 | 13F | Royal Bank Of Canada | 140.138 | -42,95 | 5.042 | -54,69 | ||||
| 2026-01-26 | 13F | Cwm, Llc | 157.990 | -9,29 | 6 | -28,57 | ||||
| 2026-02-11 | 13F | Hughes Financial Services, LLC | 19 | 0,00 | 1 | |||||
| 2026-01-22 | 13F | Personal Cfo Solutions, Llc | 6.581 | -2,71 | 237 | -22,88 | ||||
| 2026-02-13 | 13F | Wealth Alliance | 0 | -100,00 | 0 | |||||
| 2026-02-10 | 13F | Bank of New York Mellon Corp | 2.038.434 | -32,60 | 73.343 | -46,47 | ||||
| 2026-01-26 | 13F | Whittier Trust Co | 36 | 0,00 | 1 | 0,00 | ||||
| 2026-02-13 | 13F | Morgan Stanley | 1.517.130 | 6,04 | 54.586 | -15,78 | ||||
| 2026-02-13 | 13F | Ieq Capital, Llc | 126.786 | -43,19 | 4.562 | -54,88 | ||||
| 2026-02-12 | 13F | Dimensional Fund Advisors Lp | 2.415.046 | 3,72 | 86.897 | -17,62 | ||||
| 2026-02-05 | 13F | Atria Investments Llc | 8.402 | -8,37 | 302 | -27,23 | ||||
| 2026-04-23 | 13F | Caliber Wealth Management, LLC / KS | 13.492 | -2,73 | 661 | 32,26 | ||||
| 2026-02-17 | 13F | Quantinno Capital Management LP | 1.093.697 | 93,47 | 39.351 | 53,67 | ||||
| 2026-02-04 | 13F | Pacer Advisors, Inc. | 0 | -100,00 | 0 | |||||
| 2026-02-13 | 13F | Vontobel Holding Ltd. | 21.901 | -67,88 | 788 | -74,51 | ||||
| 2026-02-11 | 13F | O'shaughnessy Asset Management, Llc | 8.648 | -14,08 | 311 | -31,65 | ||||
| 2026-02-13 | 13F | Bridgefront Capital, LLC | 0 | -100,00 | 0 | |||||
| 2026-04-23 | 13F | Oppenheimer & Co Inc | 4.475 | -85,53 | 219 | -80,31 | ||||
| 2026-02-12 | 13F | Xponance, Inc. | 16.146 | -16,16 | 581 | -33,49 | ||||
| 2026-04-08 | 13F | Wealth Enhancement Trust Services, Inc. | 0 | -100,00 | 0 | |||||
| 2025-11-10 | 13F | Optiver Holding B.V. | 0 | -100,00 | 0 | -100,00 | ||||
| 2026-04-20 | 13F | Sowell Financial Services LLC | 5.191 | 254 | ||||||
| 2026-02-10 | 13F | Commonwealth Of Pennsylvania Public School Empls Retrmt Sys | 41.940 | -2,67 | 1.509 | -22,69 | ||||
| 2026-04-17 | 13F | CENTRAL TRUST Co | 275 | -26,67 | 13 | 0,00 | ||||
| 2026-02-11 | 13F | Prestige Wealth Management Group LLC | 102 | 0,00 | 4 | -25,00 | ||||
| 2026-02-17 | 13F | Qube Research & Technologies Ltd | 221.895 | 7.984 | ||||||
| 2025-11-07 | 13F | M&G Plc | 0 | -100,00 | 0 | |||||
| 2026-02-17 | 13F | California State Teachers Retirement System | 159.795 | 0,87 | 5.749 | -19,89 | ||||
| 2026-02-13 | 13F | Aigen Investment Management, Lp | 7.930 | 285 | ||||||
| 2026-01-28 | 13F | Peregrine Capital Management Llc | 0 | -100,00 | 0 | |||||
| 2026-02-12 | 13F | BlackRock, Inc. | 16.277.113 | 2,77 | 585.651 | -18,37 | ||||
| 2026-02-17 | 13F | Scientech Research LLC | 8.504 | 306 | ||||||
| 2026-02-05 | 13F | Elyxium Wealth, LLC | 87 | 3 | ||||||
| 2026-02-12 | 13F | CIBC Private Wealth Group, LLC | 445 | -41,75 | 16 | -52,94 | ||||
| 2026-02-11 | 13F | Fox Run Management, L.l.c. | 56.354 | 16,40 | 2.028 | -7,57 | ||||
| 2026-02-17 | 13F | MIRAE ASSET GLOBAL ETFS HOLDINGS Ltd. | 2.084.610 | 3,95 | 75.025 | -17,42 | ||||
| 2026-02-13 | 13F | Smartleaf Asset Management LLC | 630 | -32,62 | 23 | -47,62 | ||||
| 2026-02-14 | 13F | Rockefeller Capital Management L.P. | 24.336 | -61,74 | 876 | -69,63 | ||||
| 2026-02-13 | 13F | Walleye Trading LLC | Call | 7.600 | -28,97 | 273 | -43,60 | |||
| 2026-02-13 | 13F | Neo Ivy Capital Management | 103.878 | 3.738 | ||||||
| 2026-02-13 | 13F | Walleye Trading LLC | 11.439 | -82,65 | 412 | -86,24 | ||||
| 2026-02-11 | 13F | Parallel Advisors, LLC | 1.748 | -19,22 | 63 | -36,73 | ||||
| 2026-02-10 | 13F | REAP Financial Group, LLC | 0 | -100,00 | 0 | |||||
| 2026-02-13 | 13F | Walleye Trading LLC | Put | 13.800 | 1.280,00 | 497 | 1.002,22 | |||
| 2026-02-17 | 13F | Dark Forest Capital Management Lp | 35.251 | -59,38 | 1.268 | -67,74 | ||||
| 2026-04-22 | 13F | Coston, McIsaac & Partners | 4.239 | 0 | ||||||
| 2026-02-10 | 13F | Axq Capital, Lp | 19.031 | 685 | ||||||
| 2026-02-11 | 13F | SOUTH STATE Corp | 21 | 0,00 | 1 | |||||
| 2026-02-17 | 13F | Aquatic Capital Management LLC | 105.574 | 20,50 | 3.799 | -4,28 | ||||
| 2026-01-28 | 13F | CAPROCK Group, Inc. | 42.349 | 1.524 | ||||||
| 2026-02-13 | 13F | Parkside Financial Bank & Trust | 3.022 | -7,98 | 109 | -27,03 | ||||
| 2025-11-14 | 13F | Point72 Hong Kong Ltd | 40.451 | 717,52 | 1.832 | 1.074,36 | ||||
| 2026-02-17 | 13F | Aster Capital Management (DIFC) Ltd | 207 | -59,01 | 7 | -68,18 | ||||
| 2026-02-02 | 13F | Nkcfo Llc | 0 | -100,00 | 0 | |||||
| 2026-03-04 | 13F | SHP Wealth Management | 20 | 1 | ||||||
| 2026-01-30 | 13F | State of New Jersey Common Pension Fund D | 63.012 | 0,00 | 2.267 | -20,57 | ||||
| 2026-02-10 | 13F | Acadian Asset Management Llc | 1.978 | 0 | ||||||
| 2026-02-13 | 13F | Citigroup Inc | 34.590 | -11,33 | 1.245 | -29,60 | ||||
| 2026-02-05 | 13F | Bessemer Group Inc | 18.180 | -0,54 | 1 | |||||
| 2026-02-13 | 13F | Barclays Plc | 216.694 | -48,48 | 7.797 | -59,08 | ||||
| 2026-02-12 | 13F | Voya Investment Management Llc | 539.526 | 3.775,63 | 19.412 | 2.981,27 | ||||
| 2026-02-17 | 13F | First Manhattan Co | 0 | -100,00 | 0 | |||||
| 2026-04-10 | 13F | Perigon Wealth Management, LLC | 5.504 | 270 | ||||||
| 2026-02-05 | 13F | Phoenix Holdings Ltd. | 7.500 | -3,85 | 273 | -22,95 | ||||
| 2026-02-17 | 13F | Freestone Grove Partners LP | 86.543 | -74,13 | 3.114 | -79,46 | ||||
| 2026-01-29 | 13F | Teachers Retirement System Of The State Of Kentucky | 51.299 | 0,00 | 2 | -50,00 | ||||
| 2026-02-17 | 13F | Creative Planning | 76.726 | -10,92 | 2.761 | -29,25 | ||||
| 2025-11-21 | 13F | Nebula Research & Development LLC | 0 | -100,00 | 0 | |||||
| 2026-04-22 | 13F | Oak Harvest Investment Services | 86.972 | -10,09 | 4.261 | 22,41 | ||||
| 2026-02-17 | 13F | Boothbay Fund Management, Llc | 11.554 | -43,75 | 416 | -55,38 | ||||
| 2026-02-02 | 13F | Horizon Investments, LLC | 0 | -100,00 | 0 | |||||
| 2026-02-17 | 13F | Wiley Bros.-aintree Capital, Llc | 26.650 | -1,38 | 959 | -21,46 | ||||
| 2026-01-29 | 13F | UBS Group AG | Call | 0 | -100,00 | 0 | -100,00 | |||
| 2026-02-12 | 13F | Nuveen, LLC | 306.487 | -42,11 | 11.027 | -54,02 | ||||
| 2026-02-12 | 13F | Ci Investments Inc. | 0 | -100,00 | 0 | |||||
| 2025-11-14 | 13F | Point72 (DIFC) Ltd | 2.511 | -91,31 | 114 | -87,68 | ||||
| 2026-04-24 | 13F | UMA Financial Services, Inc. | 400 | -7,62 | 20 | 26,67 | ||||
| 2026-02-12 | 13F | Swiss National Bank | 331.000 | 1,72 | 11.909 | -19,21 | ||||
| 2025-11-04 | 13F | Pineridge Advisors LLC | 88 | 20,55 | 4 | 50,00 | ||||
| 2026-01-16 | 13F | Empirical Financial Services, LLC d.b.a. Empirical Wealth Management | 5.797 | 209 | ||||||
| 2026-01-20 | 13F | Cromwell Holdings LLC | 20 | 0,00 | 1 | |||||
| 2026-04-13 | 13F | True Wealth Design, LLC | 1.547 | -3,07 | 76 | 31,58 | ||||
| 2026-04-17 | 13F | Krilogy Financial LLC | 11.230 | 0,39 | 617 | 40,23 | ||||
| 2026-02-09 | 13F | Coldstream Capital Management Inc | 7.603 | -0,63 | 274 | -21,10 | ||||
| 2026-02-11 | 13F | GW&K Investment Management, LLC | 1.522.767 | 55 | ||||||
| 2026-02-05 | 13F | Amalgamated Bank | 74.661 | -2,59 | 3 | -33,33 | ||||
| 2026-02-06 | 13F | Envestnet Portfolio Solutions, Inc. | 24.676 | -0,52 | 888 | -21,02 | ||||
| 2026-02-19 | 13F/A | T. Rowe Price Investment Management, Inc. | 144 | 0,00 | 0 | |||||
| 2026-02-13 | 13F | Squarepoint Ops LLC | 6.738 | -98,95 | 242 | -99,17 | ||||
| 2026-02-17 | 13F | Capital Fund Management S.a. | 354.554 | 1,71 | 12.757 | -19,22 | ||||
| 2026-02-09 | 13F | AIA Group Ltd | 20.139 | -38,61 | 725 | -51,28 | ||||
| 2026-04-20 | 13F | Hilton Head Capital Partners, LLC | 332 | -33,33 | 16 | -5,88 | ||||
| 2026-02-09 | 13F | Hantz Financial Services, Inc. | 2.914 | 58,80 | 0 | |||||
| 2026-04-20 | 13F | Jfs Wealth Advisors, Llc | 23 | 64,29 | 1 | |||||
| 2026-02-17 | 13F | SageView Advisory Group, LLC | 62 | 2 | ||||||
| 2026-02-11 | 13F | Dorsey & Whitney Trust CO LLC | 27.866 | 166,94 | 1.003 | 112,29 | ||||
| 2026-02-17 | 13F | Electron Capital Partners, LLC | 852.984 | -38,45 | 30.690 | -51,12 | ||||
| 2026-02-17 | 13F | Aqr Capital Management Llc | 1.146.993 | -46,95 | 41.269 | -57,86 | ||||
| 2026-02-04 | 13F | Oregon Public Employees Retirement Fund | 33.311 | -1,48 | 1.199 | -21,75 | ||||
| 2026-04-24 | 13F | Washington Capital Management Inc | 10.950 | 65,91 | 536 | 126,16 | ||||
| 2026-02-03 | 13F | Premier Fund Managers Ltd | 9.996 | -23,17 | 0 | |||||
| 2026-02-13 | 13F | Resources Investment Advisors, LLC. | 12.613 | 59,42 | 454 | 26,54 | ||||
| 2026-04-10 | 13F | Quaker Wealth Management, LLC | 9 | 0,00 | 0 | |||||
| 2026-02-11 | 13F | Twin Tree Management, LP | Call | 0 | -100,00 | 0 | -100,00 | |||
| 2026-02-17 | 13F | Boreal Capital Management LLC | 220 | 0,00 | 8 | -22,22 | ||||
| 2025-11-14 | 13F | Point72 Europe (London) LLP | 1.577 | 71 | ||||||
| 2026-04-07 | 13F | Park Avenue Securities Llc | 9.548 | 6,55 | 0 | |||||
| 2026-02-13 | 13F | Mariner, LLC | 11.018 | -84,13 | 399 | -87,34 | ||||
| 2026-01-20 | 13F | Harbor Capital Advisors, Inc. | 11.869 | -4,47 | 0 | |||||
| 2026-02-18 | 13F | Front Street Capital Management, Inc. | 1.309.295 | 1,10 | 47 | -18,97 | ||||
| 2026-02-12 | 13F | California Public Employees Retirement System | 322.705 | 5,19 | 11.611 | -16,45 | ||||
| 2026-02-17 | 13F | Driehaus Capital Management Llc | 14.097 | 507 | ||||||
| 2026-01-29 | 13F | Sanctuary Advisors, LLC | 0 | -100,00 | 0 | -100,00 | ||||
| 2026-03-10 | 13F | Montanaro Asset Management Ltd | 42.012 | -36,64 | 1.512 | -49,68 | ||||
| 2026-03-12 | 13F/A | Peak6 Llc | 24.242 | 28,07 | 872 | 1,75 | ||||
| 2026-02-11 | 13F | Prudential Plc | 13.611 | 100,49 | 490 | 59,28 | ||||
| 2026-01-23 | 13F | Rsm Us Wealth Management Llc | 0 | -100,00 | 0 | |||||
| 2026-02-17 | 13F | Mercer Global Advisors Inc /adv | 46.520 | -11,01 | 1.674 | -28,84 | ||||
| 2026-04-17 | 13F | Willner & Heller, Llc | 4.289 | 210 | ||||||
| 2026-04-15 | 13F | Merit Financial Group, LLC | 21.243 | 20,41 | 1.041 | 64,04 | ||||
| 2026-02-17 | 13F | Westerly Capital Management, Llc | 100.000 | 17,65 | 3.598 | -6,55 | ||||
| 2026-04-24 | 13F | Root Financial Partners, LLC | 1.207 | 683,77 | 59 | 1.080,00 | ||||
| 2026-02-17 | 13F | Gotham Asset Management, LLC | 495.233 | 9,08 | 17.818 | -13,36 | ||||
| 2026-04-15 | 13F | Valley National Advisers Inc | 280 | 0,00 | 0 | |||||
| 2026-02-13 | 13F | Manufacturers Life Insurance Company, The | 0 | -100,00 | 0 | |||||
| 2026-02-06 | 13F | Global Retirement Partners, LLC | 2.779 | 700,86 | 100 | 560,00 | ||||
| 2026-02-10 | 13F | Savant Capital, LLC | 0 | -100,00 | 0 | -100,00 | ||||
| 2026-02-13 | 13F | Colony Group, LLC | 104.716 | 485,69 | 3.768 | 336,00 | ||||
| 2026-01-14 | 13F | Eastern Bank | 0 | -100,00 | 0 | |||||
| 2026-02-17 | 13F | Point72 Asset Management, L.P. | 3.714.380 | 35,46 | 133.643 | 7,59 | ||||
| 2026-02-17 | 13F | Northern Trust Corp | 1.632.580 | -4,98 | 58.740 | -24,53 | ||||
| 2026-04-14 | 13F | Wealthcare Advisory Partners LLC | 14.065 | 0,49 | 689 | 36,98 | ||||
| 2026-01-29 | 13F | Dunhill Financial, LLC | 4 | 0 | ||||||
| 2025-11-05 | 13F | Davy Global Fund Management Ltd | 0 | -100,00 | 0 | |||||
| 2026-02-17 | 13F | Moore Capital Management, Lp | 173.405 | 6.239 | ||||||
| 2026-02-10 | 13F | Natixis Advisors, L.p. | 46.383 | -1,67 | 2 | -50,00 | ||||
| 2026-02-11 | 13F | Cedar Mountain Advisors, LLC | 195 | 0,00 | 7 | -12,50 | ||||
| 2025-11-13 | 13F | Healthcare Of Ontario Pension Plan Trust Fund | 0 | -100,00 | 0 | |||||
| 2026-01-30 | 13F | Turning Point Benefit Group, Inc. | 470 | 0,00 | 17 | -23,81 | ||||
| 2026-02-12 | 13F | Rossby Financial, LCC | 58 | 81,25 | 2 | 100,00 | ||||
| 2026-02-02 | 13F | Principal Financial Group Inc | 360.526 | -3,32 | 12.972 | -23,21 | ||||
| 2026-02-05 | 13F | Td Private Client Wealth Llc | 81 | 0,00 | 3 | -33,33 | ||||
| 2026-02-10 | 13F | Td Asset Management Inc | 252.062 | -15,04 | 9.069 | -32,52 | ||||
| 2026-04-27 | 13F | Leonteq Securities AG | 2.671 | -15,53 | 131 | 15,04 | ||||
| 2026-02-12 | 13F/A | Pinebridge Investments Llc | 119.381 | 4.295 | ||||||
| 2026-02-05 | 13F | 1620 Investment Advisors, Inc. | 3.525 | -1,09 | 127 | -21,74 | ||||
| 2026-02-17 | 13F | Voloridge Investment Management, Llc | 279.639 | 478,41 | 10.061 | 359,41 | ||||
| 2025-11-14 | 13F | Wolverine Trading, Llc | Call | 48.800 | 2.223 | |||||
| 2026-02-09 | 13F | CBIZ Investment Advisory Services, LLC | 700 | 16,86 | 25 | -7,41 | ||||
| 2025-11-14 | 13F | Wolverine Trading, Llc | Put | 10.300 | 469 | |||||
| 2026-02-09 | 13F | Royce & Associates Lp | 1.057.659 | 0,98 | 38.055 | -19,79 | ||||
| 2026-02-10 | 13F | Welch & Forbes Llc | 330.638 | -2,50 | 11.896 | -22,56 | ||||
| 2026-01-28 | 13F | Arizona State Retirement System | 46.754 | -5,83 | 1.682 | -25,21 | ||||
| 2025-11-06 | 13F | Ing Groep Nv | 0 | -100,00 | 0 | -100,00 | ||||
| 2026-01-23 | 13F | Robbins Farley Llc | 0 | -100,00 | 0 | |||||
| 2026-02-05 | 13F | Cambridge Investment Research Advisors, Inc. | 5.766 | -9,33 | 0 | |||||
| 2026-04-24 | 13F | ProShare Advisors LLC | 168.225 | 7,81 | 8.241 | 46,79 | ||||
| 2026-02-06 | 13F | Gsa Capital Partners Llp | 10.720 | 52,21 | 0 | |||||
| 2026-04-21 | 13F | PharVision Advisers, LLC | 0 | -100,00 | 0 | |||||
| 2026-02-04 | 13F | Argos Wealth Advisors, LLC | 9.575 | 345 | ||||||
| 2026-02-17 | 13F | Price T Rowe Associates Inc /md/ | 5.314.896 | 31,03 | 191 | 4,37 | ||||
| 2025-11-14 | 13F | Wolverine Trading, Llc | 32.247 | 1.469 | ||||||
| 2026-04-06 | 13F | CX Institutional | 0 | -100,00 | 0 | |||||
| 2026-04-23 | 13F | CWM Advisors, LLC | 10.605 | -18,42 | 520 | 11,13 | ||||
| 2026-02-12 | 13F | Peterson Wealth Services | 4.094 | -90,50 | 147 | -20,54 | ||||
| 2026-04-27 | 13F | Y-Intercept (Hong Kong) Ltd | 18.640 | -87,81 | 913 | -83,40 | ||||
| 2026-02-17 | 13F | Jones Financial Companies Lllp | 3.255 | 20,42 | 117 | -4,88 | ||||
| 2026-02-10 | 13F | Nomura Asset Management Co Ltd | 1.050 | 0,00 | 38 | -21,28 | ||||
| 2026-02-10 | 13F | Quantbot Technologies LP | 22.157 | 797 | ||||||
| 2026-01-28 | 13F | Salomon & Ludwin, LLC | 91 | 0,00 | 3 | -25,00 | ||||
| 2026-02-17 | 13F | Susquehanna International Group, Llp | 126.551 | -60,75 | 4.553 | -68,83 | ||||
| 2026-02-19 | 13F | Invesco Ltd. | 401.487 | 9,62 | 14.446 | -12,93 | ||||
| 2025-11-14 | 13F | PineBridge Investments, L.P. | 141.996 | 652,30 | 6.432 | 975,59 | ||||
| 2026-01-08 | 13F | Nordea Investment Management Ab | 8.101.583 | 0,95 | 292.224 | -19,14 | ||||
| 2026-02-09 | 13F | Hartland & Co., LLC | 509 | -71,00 | 18 | -77,22 | ||||
| 2026-01-27 | 13F | TD Waterhouse Canada Inc. | 2.391 | 165,67 | 86 | 107,32 | ||||
| 2026-04-21 | 13F | Gagnon Securities Llc | 9.780 | 0,08 | 479 | 36,47 | ||||
| 2026-02-13 | 13F | First Trust Advisors Lp | 128.175 | 32,33 | 4.612 | 5,11 | ||||
| 2026-01-23 | 13F | Sumitomo Mitsui Trust Holdings, Inc. | 1.382.767 | -1,05 | 49.752 | -21,41 | ||||
| 2026-01-28 | 13F | WPG Advisers, LLC | 549 | 111,97 | 20 | 72,73 | ||||
| 2026-02-11 | 13F | Cerity Partners LLC | 134.695 | -23,85 | 4.846 | -39,52 | ||||
| 2026-02-13 | 13F | Missouri Trust & Investment Co | 80 | 0,00 | 3 | -33,33 | ||||
| 2026-02-17 | 13F | Cetera Investment Advisers | 46.333 | 10,20 | 1.667 | -12,45 | ||||
| 2026-02-06 | 13F | Kilter Group LLC | 0 | -100,00 | 0 | |||||
| 2026-02-20 | 13F | Kovitz Investment Group Partners, LLC | 0 | -100,00 | 0 | |||||
| 2026-02-13 | 13F | Panagora Asset Management Inc | 13.600 | -91,98 | 489 | -93,63 | ||||
| 2026-04-15 | 13F | Exchange Traded Concepts, Llc | 490.695 | -10,44 | 24.039 | 21,94 | ||||
| 2026-02-03 | 13F | Swedbank AB | 0 | -100,00 | 0 | |||||
| 2026-02-10 | 13F | Cherry Tree Wealth Management, LLC | 0 | -100,00 | 0 | |||||
| 2026-01-28 | 13F | DekaBank Deutsche Girozentrale | 1.610.000 | 0,00 | 74 | 1,37 | ||||
| 2026-02-17 | 13F | Susquehanna International Group, Llp | Put | 49.700 | -11,25 | 1.788 | -29,50 | |||
| 2026-02-17 | 13F | Sandler Capital Management | 0 | -100,00 | 0 | |||||
| 2026-02-17 | 13F | Susquehanna International Group, Llp | Call | 149.700 | -55,22 | 5.386 | -64,43 | |||
| 2026-02-17 | 13F | Public Employees Retirement System Of Ohio | 56.300 | 3,59 | 2.026 | -17,75 | ||||
| 2025-11-13 | 13F | Riggs Asset Managment Co. Inc. | 0 | -100,00 | 0 | |||||
| 2026-02-06 | 13F | Tortoise Investment Management, LLC | 0 | -100,00 | 0 | |||||
| 2026-02-13 | 13F | Charles Schwab Investment Management Inc | 1.493.460 | 0,29 | 53.735 | -20,34 | ||||
| 2026-04-08 | 13F | NorthCrest Asset Manangement, LLC | 5.294 | 260 | ||||||
| 2026-01-27 | 13F | Brighton Jones Llc | 0 | -100,00 | 0 | -100,00 | ||||
| 2026-02-11 | 13F | Twin Tree Management, LP | 529 | -99,24 | 19 | -99,40 | ||||
| 2026-04-13 | 13F | Global X Japan Co., Ltd. | 1.416 | -22,58 | 69 | 6,15 | ||||
| 2026-04-21 | 13F | Blue Jean Financial Llc | 0 | -100,00 | 0 | |||||
| 2026-02-17 | 13F | Toronto Dominion Bank | 9.729 | -8,00 | 350 | -27,39 | ||||
| 2026-02-17 | 13F | Kemnay Advisory Services Inc. | 3.019 | 109 | ||||||
| 2026-02-13 | 13F | Victory Capital Management Inc | 36.223 | 43,94 | 1.303 | 14,40 | ||||
| 2026-01-29 | 13F | Quent Capital, LLC | 422 | -26,09 | 15 | -40,00 | ||||
| 2026-02-12 | 13F | Federation des caisses Desjardins du Quebec | 14.918 | 875,03 | 537 | 676,81 | ||||
| 2026-02-02 | 13F | Cornerstone Planning Group LLC | 416 | 0,00 | 16 | -5,88 | ||||
| 2026-02-13 | 13F | Umb Bank N A/mo | 2.360 | 3,69 | 85 | -18,45 | ||||
| 2026-02-13 | 13F | Van Eck Associates Corp | 133.827 | 2.910,05 | 5 | |||||
| 2026-02-17 | 13F | Two Sigma Investments, Lp | 279.595 | 10.060 | ||||||
| 2026-04-06 | 13F | Versant Capital Management, Inc | 8.097 | -8,26 | 397 | 24,92 | ||||
| 2026-02-12 | 13F | Skandinaviska Enskilda Banken AB (publ) | 0 | -100,00 | 0 | |||||
| 2026-02-13 | 13F | Natixis | 64.145 | 2.308 | ||||||
| 2026-01-30 | 13F | Rachor Investment Advisory Services, LLC | 31 | 1 | ||||||
| 2026-02-12 | 13F | Penserra Capital Management LLC | 912 | -1,51 | 0 | |||||
| 2026-02-12 | 13F | Campbell & CO Investment Adviser LLC | 150.998 | 5.433 | ||||||
| 2026-02-10 | 13F | Envestnet Asset Management Inc | 494.826 | -15,82 | 17.804 | -33,14 | ||||
| 2026-01-08 | 13F | Armstrong Advisory Group, Inc | 0 | -100,00 | 0 | |||||
| 2026-02-17 | 13F | Utah Retirement Systems | 8.869 | 0,00 | 319 | -20,45 | ||||
| 2025-11-17 | 13F | Kestra Investment Management, LLC | 0 | -100,00 | 0 | -100,00 | ||||
| 2026-02-17 | 13F | Ancora Advisors, LLC | 814 | 835,63 | 29 | 866,67 | ||||
| 2026-04-16 | 13F | Capital Advisors, Ltd. LLC | 25 | 0,00 | 0 | |||||
| 2026-02-13 | 13F | Treasurer of the State of North Carolina | 70.298 | -6,82 | 3 | -33,33 | ||||
| 2026-02-03 | 13F | SBI Securities Co., Ltd. | 1.404 | 0,72 | 51 | -20,63 | ||||
| 2026-01-28 | 13F | Chicago Partners Investment Group LLC | 11.728 | -5,97 | 466 | -20,88 | ||||
| 2026-02-17 | 13F | Silvercrest Asset Management Group Llc | 10.581 | 1,96 | 381 | -19,15 | ||||
| 2026-02-13 | 13F | Marshall Wace, Llp | 106.038 | 3.815 | ||||||
| 2026-04-17 | 13F | Murphy & Mullick Capital Management Corp | 100 | 0,00 | 5 | 33,33 | ||||
| 2026-02-13 | 13F | Sei Investments Co | 216.327 | -31,39 | 7.784 | -45,50 | ||||
| 2026-02-17 | 13F | Blair William & Co/il | 19.643 | -9,44 | 707 | -28,11 | ||||
| 2025-11-14 | 13F | Texas Permanent School Fund | 0 | -100,00 | 0 | |||||
| 2026-01-29 | 13F | Concord Wealth Partners | 132 | 0,00 | 5 | -20,00 | ||||
| 2026-02-12 | 13F | Federated Hermes, Inc. | 1.343.015 | -4,19 | 48.322 | -23,91 | ||||
| 2026-02-13 | 13F | American Century Companies Inc | 949.415 | -2,61 | 34.160 | -22,65 | ||||
| 2025-10-29 | 13F | Lmcg Investments, Llc | 0 | -100,00 | 0 | -100,00 | ||||
| 2026-02-17 | 13F | Algert Global Llc | 165.337 | 0,00 | 6 | -28,57 | ||||
| 2026-04-13 | 13F | Wolff Wiese Magana Llc | 34 | 0,00 | 2 | 0,00 | ||||
| 2026-02-03 | 13F | Sequoia Financial Advisors, LLC | 11.835 | 3,74 | 426 | -17,64 | ||||
| 2026-02-12 | 13F | Hrt Financial Lp | 11.798 | 0 | ||||||
| 2026-02-19 | 13F | Atomi Financial Group, Inc. | 0 | -100,00 | 0 | |||||
| 2025-11-14 | 13F | Cubist Systematic Strategies, LLC | 0 | -100,00 | 0 | -100,00 | ||||
| 2026-02-17 | 13F | Two Sigma Advisers, Lp | 157.400 | 653,11 | 5.663 | 498,63 | ||||
| 2026-02-11 | 13F | Simplex Trading, Llc | 8.909 | 11,08 | 321 | |||||
| 2026-02-11 | 13F | Simplex Trading, Llc | Call | 74.900 | 16,49 | 2.695 | 134.600,00 | |||
| 2026-02-13 | 13F | Centaurus Financial, Inc. | 4.010 | 0,05 | 0 | |||||
| 2026-02-10 | 13F | Mawer Investment Management Ltd. | 1.282.831 | -10,89 | 46.156 | -29,23 | ||||
| 2026-02-13 | 13F | Diametric Capital, LP | 0 | -100,00 | 0 | |||||
| 2026-02-10 | 13F | Daiwa Securities Group Inc. | 265.268 | 3,50 | 10 | -18,18 | ||||
| 2026-02-11 | 13F | Simplex Trading, Llc | Put | 5.000 | -19,35 | 180 | ||||
| 2026-02-19 | 13F | CI Private Wealth, LLC | 57.009 | 77,29 | 2.058 | 41,28 | ||||
| 2026-02-17 | 13F | Wellington Management Group Llp | 808.862 | -43,89 | 29.103 | -55,44 | ||||
| 2025-11-14 | 13F | Balyasny Asset Management Llc | 0 | -100,00 | 0 | |||||
| 2026-01-30 | 13F | Camden Capital, LLC | 6.123 | 220 | ||||||
| 2026-02-10 | 13F | Norges Bank | 2.031.768 | 73.103 | ||||||
| 2026-02-23 | 13F | Virtu Financial LLC | 10.532 | 0 | ||||||
| 2026-01-29 | 13F | Quest 10 Wealth Builders, Inc. | 0 | -100,00 | 0 | |||||
| 2025-11-13 | 13F | RMB Capital Management, LLC | 0 | -100,00 | 0 | -100,00 | ||||
| 2026-02-10 | 13F | Ritter Daniher Financial Advisory LLC / DE | 350 | 0,00 | 13 | -20,00 | ||||
| 2026-02-02 | 13F | Equitable Trust Co | 19.146 | 121,01 | 689 | 75,51 | ||||
| 2026-02-12 | 13F | NZS Capital, LLC | 692.849 | 1,00 | 24.929 | -19,78 | ||||
| 2026-02-17 | 13F | Massar Capital Management, LP | 36.570 | 0,00 | 1.316 | -20,59 | ||||
| 2026-04-23 | 13F | Forum Financial Management, LP | 0 | -100,00 | 0 | |||||
| 2026-02-17 | 13F | Canada Pension Plan Investment Board | 44.600 | 1.605 | ||||||
| 2026-02-13 | 13F | Blueshift Asset Management, LLC | 22.709 | 817 | ||||||
| 2025-11-14 | 13F | Binnacle Investments Inc | 369 | 35,66 | 17 | 100,00 | ||||
| 2026-02-13 | 13F | Stifel Financial Corp | 133.148 | 0,74 | 4.791 | -19,98 | ||||
| 2025-11-12 | 13F | Roubaix Capital, LLC | 0 | -100,00 | 0 | -100,00 | ||||
| 2026-04-17 | 13F | Vermillion Wealth Management, Inc. | 11 | 1 | ||||||
| 2026-04-21 | 13F | Nemes Rush Group LLC | 0 | -100,00 | 0 | |||||
| 2026-02-03 | 13F | Crossmark Global Holdings, Inc. | 11.894 | 1,39 | 428 | -19,59 | ||||
| 2026-02-18 | 13F | First Citizens Bank & Trust Co | 21.824 | 1,99 | 785 | -18,99 | ||||
| 2026-02-13 | 13F | Toroso Investments, LLC | 35.650 | 32,74 | 1.283 | 5,43 | ||||
| 2026-02-17 | 13F | ISAM Funds (UK) Ltd | 0 | -100,00 | 0 | |||||
| 2026-02-10 | 13F | Principia Wealth Advisory, LLC | 3 | 0,00 | 0 | |||||
| 2026-04-21 | 13F | Pinnacle Wealth Management Advisory Group, LLC | 5.112 | 250 | ||||||
| 2026-01-29 | 13F | Rakuten Securities, Inc. | 151 | -55,98 | 5 | -66,67 | ||||
| 2026-02-17 | 13F | Ameriprise Financial Inc | 464.002 | 12,80 | 16.702 | -11,66 | ||||
| 2026-01-29 | 13F | Vanguard Group Inc | 18.576.640 | -0,12 | 668.388 | -20,67 | ||||
| 2026-04-20 | 13F | Banque Cantonale Vaudoise | 4.230 | 207 | ||||||
| 2025-11-14 | 13F | Point72 Asia (Singapore) Pte. Ltd. | 0 | -100,00 | 0 | |||||
| 2026-01-27 | 13F | Probity Advisors, Inc. | 7.256 | 11,32 | 261 | -11,53 | ||||
| 2026-02-12 | 13F | Ensign Peak Advisors, Inc | 37.595 | -93,20 | 1.353 | -94,60 | ||||
| 2026-02-11 | 13F | Ameritas Investment Partners, Inc. | 30.715 | 1.105 | ||||||
| 2026-04-08 | 13F | Wealth Enhancement Advisory Services, Llc | 67.686 | 11,07 | 3.068 | 30,40 | ||||
| 2026-04-15 | 13F | Trust Point Inc. | 8.972 | 5,76 | 440 | 43,93 | ||||
| 2026-04-23 | 13F | SJS Investment Consulting Inc. | 962 | -23,41 | 47 | 4,44 | ||||
| 2026-02-09 | 13F | Harbour Investments, Inc. | 153 | 0,00 | 6 | -16,67 | ||||
| 2026-02-23 | 13F | Kera Capital Partners, Inc. | 12.353 | 118,68 | 479 | 87,45 | ||||
| 2026-04-10 | 13F | Linden Thomas Advisory Services, LLC | 39.545 | 20,01 | 1.937 | 63,46 | ||||
| 2026-04-09 | 13F | Park Place Capital Corp | 464 | 0,00 | 23 | 37,50 | ||||
| 2026-02-17 | 13F | Twinbeech Capital Lp | 15.670 | -75,75 | 564 | -80,76 | ||||
| 2025-11-14 | 13F | Axa S.a. | 0 | -100,00 | 0 | -100,00 | ||||
| 2026-04-24 | 13F | Strs Ohio | 4.013 | -95,23 | 197 | -93,52 | ||||
| 2026-02-10 | 13F/A | Northwestern Mutual Wealth Management Co | 16.934 | 179,99 | 609 | 123,08 | ||||
| 2026-02-13 | 13F | Truvestments Capital Llc | 164 | 0,00 | 6 | -28,57 | ||||
| 2026-04-23 | 13F | Private Wealth Management Group, LLC | 61 | -42,45 | 3 | -33,33 | ||||
| 2026-02-13 | 13F | SG Capital Management LLC | Call | 0 | -100,00 | 0 | ||||
| 2026-01-29 | 13F | State Of Michigan Retirement System | 39.653 | -0,75 | 1.427 | -21,17 | ||||
| 2026-02-17 | 13F | Alpine Peaks Capital, LP | 138.019 | -5,61 | 4.966 | -25,03 | ||||
| 2026-01-30 | 13F | New York State Teachers Retirement System | 171.018 | -0,12 | 6 | -14,29 | ||||
| 2026-02-17 | 13F | American Capital Management Inc | 364.373 | -1,49 | 13.110 | -21,76 | ||||
| 2026-02-11 | 13F | LPL Financial LLC | 63.271 | 37,07 | 2.277 | 8,90 | ||||
| 2026-02-12 | 13F | Wealthspire Advisors, LLC | 0 | -100,00 | 0 | |||||
| 2026-04-23 | 13F | North Star Investment Management Corp. | 59 | 3 | ||||||
| 2026-01-30 | 13F/A | M&t Bank Corp | 80.511 | 57,97 | 2.897 | 25,53 | ||||
| 2026-04-23 | 13F | Interchange Capital Partners, LLC | 0 | -100,00 | 0 | |||||
| 2026-02-13 | 13F | National Bank Of Canada /fi/ | 103 | -71,78 | 4 | -81,25 | ||||
| 2026-02-17 | 13F | Amundi | 99.593 | 32,67 | 3.583 | 1,85 | ||||
| 2026-02-12 | 13F | BRYN MAWR TRUST Co | 1.000 | 0,00 | 36 | -22,22 | ||||
| 2026-01-21 | 13F | Rocky Mountain Advisers, Llc | 60 | 0,00 | 2 | 0,00 | ||||
| 2025-11-06 | 13F | Abich Financial Wealth Management LLC | 3.425 | 155 | ||||||
| 2026-02-17 | 13F | Oxford Asset Management Llp | 13.119 | 472 | ||||||
| 2026-02-11 | 13F | Rise Advisors, LLC | 0 | -100,00 | 0 | |||||
| 2026-02-17 | 13F | Man Group plc | 117.470 | 6,43 | 4.227 | -15,48 | ||||
| 2026-01-26 | 13F | KBC Group NV | 99.409 | -31,16 | 4 | -50,00 | ||||
| 2025-11-14 | 13F | WealthTrak Capital Management LLC | 0 | -100,00 | 0 | |||||
| 2026-02-10 | 13F | Goldman Sachs Group Inc | 436.465 | -32,56 | 15.704 | -46,44 | ||||
| 2026-01-23 | 13F | Optima Capital Llc | 19 | 1 | ||||||
| 2026-02-13 | 13F | Public Employees Retirement Association Of Colorado | 18.872 | 0,00 | 1 | |||||
| 2026-02-17 | 13F | Mairs & Power Inc | 1.171.596 | 91,03 | 42.154 | 51,73 | ||||
| 2026-02-17 | 13F/A | Northwest & Ethical Investments L.P. | 23.782 | -33,55 | 858 | -47,10 | ||||
| 2026-02-05 | 13F | Allworth Financial LP | 1.516 | -38,20 | 55 | -51,35 | ||||
| 2026-02-13 | 13F | Bank Of Nova Scotia | 30.500 | 1.097 | ||||||
| 2026-02-12 | 13F | Colonial Trust Advisors | 25 | 0,00 | 1 | -100,00 | ||||
| 2026-02-17 | 13F | Sciencast Management LP | 92.160 | 69,26 | 3.316 | 34,43 | ||||
| 2026-02-17 | 13F | Russell Investments Group, Ltd. | 64.155 | -0,86 | 2.308 | -21,26 | ||||
| 2026-02-13 | 13F | Centerpoint Advisors, LLC | 438 | 0,00 | 0 | |||||
| 2026-02-17 | 13F | Millennium Management Llc | 255.041 | 496,74 | 9.176 | 373,97 | ||||
| 2026-02-17 | 13F | Millennium Management Llc | Call | 151.500 | 46,66 | 5.451 | 16,48 | |||
| 2026-02-03 | 13F | Bokf, Na | 50.000 | 1.799 | ||||||
| 2026-02-06 | 13F | Pnc Financial Services Group, Inc. | 13.824 | 8,25 | 497 | -14,01 | ||||
| 2026-02-10 | 13F | Basepoint Wealth LLC | 50 | 2 | ||||||
| 2026-02-12 | 13F | Bradley Foster & Sargent Inc/ct | 292.591 | 1,43 | 10.527 | -19,44 | ||||
| 2025-11-14 | 13F | Lighthouse Investment Partners, LLC | 0 | -100,00 | 0 | |||||
| 2026-01-30 | 13F | Shaker Investments Llc/oh | 5.635 | -60,01 | 203 | -68,34 | ||||
| 2026-02-12 | 13F | Renaissance Technologies Llc | 835.058 | 40,59 | 30.045 | 11,67 | ||||
| 2026-01-29 | 13F | UBS Group AG | Put | 0 | -100,00 | 0 | -100,00 | |||
| 2026-02-04 | 13F | C WorldWide Group Holding A/S | 0 | -100,00 | 0 | |||||
| 2026-01-27 | 13F | Regions Financial Corp | 8.628 | -3,68 | 310 | -23,46 | ||||
| 2026-04-13 | 13F | IFP Advisors, Inc | 786 | 9,62 | 39 | 52,00 | ||||
| 2026-02-18 | 13F | State of Tennessee, Treasury Department | 74.840 | 33,60 | 2.899 | 14,27 | ||||
| 2026-02-12 | 13F | Cloud Capital Management, LLC | 0 | -100,00 | 0 | |||||
| 2026-02-10 | 13F | Sivia Capital Partners, LLC | 6.109 | -6,45 | 220 | -25,76 | ||||
| 2026-02-17 | 13F | J. Goldman & Co LP | 154.998 | 5.577 | ||||||
| 2026-04-23 | 13F | Farmers & Merchants Investments Inc | 155 | 0,00 | 8 | 40,00 | ||||
| 2026-01-15 | 13F | Nisa Investment Advisors, Llc | 16.168 | 0,00 | 582 | -20,63 | ||||
| 2026-02-12 | 13F | Steward Partners Investment Advisory, Llc | 12.203 | 3,73 | 439 | -17,48 | ||||
| 2025-10-30 | 13F | Twin Peaks Wealth Advisors, LLC | 0 | -100,00 | 0 | |||||
| 2026-04-08 | 13F | M.e. Allison & Co., Inc. | 8.310 | 0,54 | 407 | 37,04 | ||||
| 2026-04-20 | 13F | Inscription Capital, LLC | 16.922 | 1,27 | 829 | 37,94 | ||||
| 2026-02-17 | 13F | Disciplined Growth Investors Inc /mn | 4.655.358 | 1,10 | 167.500 | -19,70 | ||||
| 2026-01-27 | 13F | Asset Management One Co., Ltd. | 3.985 | 145 | ||||||
| 2026-02-04 | 13F | TradeLink Capital LLC | 0 | -100,00 | 0 | |||||
| 2026-02-17 | 13F | Artisan Partners Limited Partnership | 1.076.924 | 66,02 | 38.748 | 31,86 | ||||
| 2026-02-05 | 13F | North Dakota State Investment Board | 5.979 | 215 | ||||||
| 2026-02-10 | 13F | State of Wyoming | 11.811 | 38,06 | 425 | 9,56 | ||||
| 2026-02-10 | 13F | Rothschild Investment Llc | 13 | -98,77 | 0 | -100,00 | ||||
| 2026-01-28 | 13F | Universal- Beteiligungs- und Servicegesellschaft mbH | 93.806 | 4,31 | 3.377 | -17,09 | ||||
| 2026-01-23 | 13F | Assetmark, Inc | 100 | 20,48 | 4 | 0,00 | ||||
| 2026-01-23 | 13F | Baillie Gifford & Co | 173.538 | -82,79 | 6.244 | -86,33 | ||||
| 2026-02-06 | 13F | EverSource Wealth Advisors, LLC | 3.000 | 1,69 | 108 | -19,55 | ||||
| 2026-02-10 | 13F | Private Wealth Asset Management, LLC | 3 | 0,00 | 0 | |||||
| 2026-04-24 | 13F | Private Advisor Group, LLC | 8.366 | -1,93 | 410 | 33,66 | ||||
| 2026-02-17 | 13F | Limestone Investment Advisors LP | Call | 0 | -100,00 | 0 | ||||
| 2026-02-13 | 13F | Rice Hall James & Associates, Llc | 58.331 | -0,23 | 2.099 | -20,77 | ||||
| 2026-02-13 | 13F | Verition Fund Management LLC | 13.334 | -90,83 | 480 | -92,73 | ||||
| 2026-03-06 | 13F | Hsbc Holdings Plc | 58.932 | 210,25 | 2.127 | 150,24 | ||||
| 2026-02-09 | 13F | New Age Alpha Advisors, LLC | 20.658 | 743 | ||||||
| 2025-11-06 | 13F | Peregrine Investment Management Inc | 0 | -100,00 | 0 | |||||
| 2026-02-10 | 13F | Intech Investment Management Llc | 98.451 | 124,51 | 3.542 | 78,35 | ||||
| 2026-01-28 | 13F | Teacher Retirement System Of Texas | 58.968 | 2,96 | 2.122 | -18,23 | ||||
| 2026-02-17 | 13F | Lazard Asset Management Llc | 1.486.438 | -0,28 | 53.482 | -20,79 | ||||
| 2026-04-15 | 13F | Covea Finance | 83.900 | 4.110 | ||||||
| 2026-01-30 | 13F | Catalytic Wealth RIA, LLC | 0 | -100,00 | 0 | |||||
| 2026-02-17 | 13F | Tudor Investment Corp Et Al | Call | 18.900 | 680 | |||||
| 2026-02-17 | 13F | Tudor Investment Corp Et Al | 687.088 | -22,13 | 24.721 | -38,15 | ||||
| 2026-02-12 | 13F | Brinker Capital Investments, LLC | 38.021 | -4,15 | 1.368 | -23,83 | ||||
| 2026-04-14 | 13F | Zrc Wealth Management, Llc | 65 | 3 | ||||||
| 2026-02-06 | 13F | Bare Financial Services, Inc | 133 | 0,00 | 5 | -33,33 | ||||
| 2026-02-10 | 13F | CIBC Asset Management Inc | 5.694 | 0,00 | 205 | -20,62 | ||||
| 2026-01-27 | 13F | Evergreen Capital Management Llc | 7.004 | 55,23 | 252 | 23,53 | ||||
| 2026-02-13 | 13F | Quarry LP | 723 | 8,89 | 26 | -13,33 | ||||
| 2025-11-14 | 13F | Numerai GP LLC | 0 | -100,00 | 0 | |||||
| 2026-01-14 | 13F | ORG Partners LLC | 220 | 8 | ||||||
| 2026-04-24 | 13F | Sumitomo Mitsui DS Asset Management Company, Ltd | 18.107 | 4,49 | 887 | 42,38 | ||||
| 2026-01-28 | 13F | Confluence Wealth Services, Inc. | 30.648 | -14,02 | 1.103 | -31,72 | ||||
| 2026-02-06 | 13F | GPS Wealth Strategies Group, LLC | 0 | -100,00 | 0 | |||||
| 2026-04-20 | 13F | State of Alaska, Department of Revenue | 24.283 | 0,00 | 1 | |||||
| 2026-04-24 | 13F | Greenfield Seitz Capital Management, LLC | 36.861 | -10,64 | 1.806 | 21,63 | ||||
| 2026-02-11 | 13F | Los Angeles Capital Management Llc | 419.164 | 2,01 | 17.316 | -6,97 | ||||
| 2026-02-12 | 13F | SMA Capital LLC | 60.000 | 2.159 | ||||||
| 2025-11-12 | 13F | Headlands Technologies LLC | 0 | -100,00 | 0 | |||||
| 2026-04-15 | 13F | Bayforest Capital Ltd | 1.634 | -44,72 | 80 | -24,53 | ||||
| 2026-02-17 | 13F | Weiss Asset Management LP | 71.581 | 130,75 | 2.575 | 105,02 | ||||
| 2026-02-13 | 13F | Wexford Capital Lp | 0 | -100,00 | 0 | |||||
| 2026-02-13 | 13F | Integrated Wealth Concepts LLC | 0 | -100,00 | 0 | |||||
| 2026-02-17 | 13F | Engineers Gate Manager LP | 96.388 | 37,93 | 3.468 | 9,57 | ||||
| 2026-01-26 | 13F | Whittier Trust Co Of Nevada Inc | 150 | 0,00 | 6 | -16,67 | ||||
| 2026-02-10 | 13F | One Capital Management, LLC | 54.060 | 1.945 | ||||||
| 2026-02-13 | 13F | Dynamic Technology Lab Private Ltd | 33.048 | 1.189 | ||||||
| 2026-02-04 | 13F | Securian Asset Management, Inc | 12.214 | -2,86 | 439 | -22,85 | ||||
| 2026-02-17 | 13F | Bamco Inc /ny/ | 1.900.166 | 0,00 | 68.368 | -20,57 | ||||
| 2026-02-11 | 13F | BI Asset Management Fondsmaeglerselskab A/S | 0 | -100,00 | 0 | |||||
| 2026-02-11 | 13F | MCF Advisors LLC | 200 | 7 | ||||||
| 2025-11-14 | 13F | Worldquant Millennium Advisors Llc | 0 | -100,00 | 0 | -100,00 | ||||
| 2026-04-17 | 13F | Values First Advisors, Inc. | 58.579 | -0,46 | 2.870 | 35,52 | ||||
| 2026-02-13 | 13F | Great West Life Assurance Co /can/ | 1.018.857 | -8,76 | 37 | -28,00 | ||||
| 2026-04-23 | 13F | Impact Partnership Wealth, LLC | 7.136 | 1,86 | 350 | 38,49 | ||||
| 2026-02-11 | 13F | Meeder Asset Management Inc | 1.306 | 47 | ||||||
| 2026-02-10 | 13F | Eurizon Capital SGR S.p.A. | 1.798 | 65 | ||||||
| 2026-02-03 | 13F | Mitsubishi UFJ Kokusai Asset Management Co., Ltd. | 357 | 0,00 | 13 | -18,75 | ||||
| 2026-04-22 | 13F | Janney Montgomery Scott LLC | 54.462 | 44,04 | 3 | 100,00 | ||||
| 2026-04-27 | 13F | La Banque Postale Asset Management SA | 10.976 | -86,93 | 538 | -82,22 | ||||
| 2026-02-10 | 13F | Mutual Of America Capital Management Llc | 69.750 | -10,05 | 2.510 | -28,56 | ||||
| 2026-02-12 | 13F | State Board Of Administration Of Florida Retirement System | 157.347 | -5,25 | 5.661 | -24,74 | ||||
| 2026-02-12 | 13F | Alps Advisors Inc | 53.912 | 38,85 | 1.940 | 10,30 | ||||
| 2026-02-13 | 13F | JustInvest LLC | 35.380 | -7,60 | 1.273 | -26,64 | ||||
| 2025-11-06 | 13F | MQS Management LLC | 0 | -100,00 | 0 | -100,00 | ||||
| 2026-02-13 | 13F | Entropy Technologies, LP | 26.404 | 104,65 | 950 | 62,67 | ||||
| 2026-02-13 | 13F | Kayne Anderson Rudnick Investment Management Llc | 14 | 0,00 | 1 | |||||
| 2026-02-11 | 13F | Group One Trading, L.p. | Put | 1.800 | 1.700,00 | 65 | 1.500,00 | |||
| 2026-02-11 | 13F | Group One Trading, L.p. | Call | 1.200 | -88,99 | 43 | -91,28 | |||
| 2026-01-30 | 13F | Us Bancorp \de\ | 38.816 | -4,85 | 1.397 | -24,46 | ||||
| 2026-02-11 | 13F | Group One Trading, L.p. | 26.977 | -47,70 | 971 | -58,48 | ||||
| 2026-02-12 | 13F | New York State Common Retirement Fund | 388.268 | 48,75 | 13.970 | 18,14 | ||||
| 2026-02-13 | 13F | Pin Oak Investment Advisors Inc | 249 | 0,00 | 0 | -100,00 | ||||
| 2026-02-13 | 13F | Golden State Wealth Management, LLC | 0 | -100,00 | 0 | |||||
| 2026-04-16 | 13F | Evolve Private Wealth, Llc | 6.764 | 4,50 | 331 | 42,67 | ||||
| 2026-02-04 | 13F | Swiss Life Asset Management Ltd | 7.687 | 0,00 | 277 | -20,69 | ||||
| 2026-02-13 | 13F | State Street Corp | 5.213.828 | -0,14 | 187.594 | -20,69 | ||||
| 2026-04-13 | 13F | Creative Financial Designs Inc /adv | 27 | 1 | ||||||
| 2026-02-12 | 13F | QSV Equity Investors LLC | 18.944 | -33,64 | 682 | -47,33 | ||||
| 2026-02-11 | 13F | Financiere des Professionnels - Fonds d,investissement inc. | 16.082 | 0,00 | 579 | -20,60 |