Grundlæggende statistik
| Institutionelle aktier (lange) | 100.381.586 - 107,80% (ex 13D/G) - change of -30,20MM shares -23,13% MRQ |
| Institutionel værdi (lang) | $ 7.213.100 USD ($1000) |
Institutionelt ejerskab og aktionærer
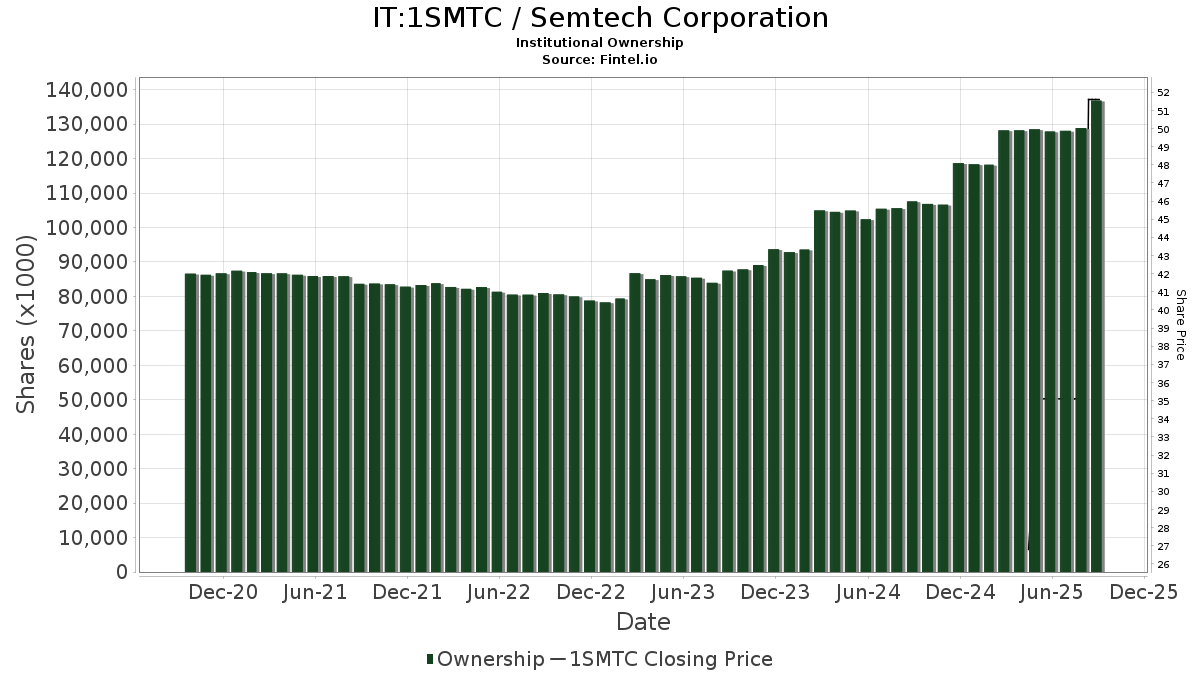
Semtech Corporation (IT:1SMTC) har 410 institutionelle ejere og aktionærer, der har indsendt 13D/G- eller 13F-formularer til Securities Exchange Commission (SEC). Disse institutioner har i alt 100,381,586 aktier. Største aktionærer omfatter BlackRock, Inc., Vanguard Group Inc, Ameriprise Financial Inc, Capital Research Global Investors, Whale Rock Capital Management LLC, State Street Corp, Alliancebernstein L.p., Disciplined Growth Investors Inc /mn, Delaware Management Holdings, Inc., and Westfield Capital Management Co Lp .
Semtech Corporation (BIT:1SMTC) institutionel ejerskabsstruktur viser aktuelle positioner i virksomheden efter institutioner og fonde, samt seneste ændringer i positionsstørrelse. Større aktionærer kan omfatte individuelle investorer, investeringsforeninger, hedgefonde eller institutioner. Skema 13D angiver, at investoren besidder (eller besidder) mere end 5 % af virksomheden og har til hensigt (eller har til hensigt at) aktivt at forfølge en ændring i forretningsstrategi. Skema 13G indikerer en passiv investering på over 5%.
The share price as of April 29, 2026 is 88,82 / share. Previously, on May 2, 2025, the share price was 29,63 / share. This represents an increase of 199,76% over that period.
Fondens stemningsscore
Fund Sentiment Score (fka Ownership Accumulation Score) finder de aktier, der bliver mest købt af fonde. Det er resultatet af en sofistikeret, multi-faktor kvantitativ model, der identificerer virksomheder med de højeste niveauer af institutionel akkumulering. Scoringsmodellen bruger en kombination af den samlede stigning i oplyste ejere, ændringerne i porteføljeallokeringer i disse ejere og andre målinger. Tallet går fra 0 til 100, hvor højere tal indikerer et højere niveau af akkumulering for sine jævnaldrende, og 50 er gennemsnittet.
Opdateringsfrekvens: Dagligt
Se Ownership Explorer, som giver en liste over højest rangerende virksomheder.
AI+ Ask Fintel’s AI assistant about Semtech Corporation.
Select a question to share a public post with an AI-crafted answer.
Thinking of good questions…
13F og NPORT arkivering
Detaljer om 13F-arkivering er gratis. Detaljer om NP-ansøgninger kræver et premium-medlemskab. Grønne rækker angiver nye positioner. Røde rækker angiver lukkede positioner. Klik på linket ikon for at se den fulde transaktionshistorik.
Opgrader
for at låse premium-data op og eksportere til Excel ![]() .
.
| Fil dato | Kilde | Investor | Type | Gennemsnitlig pris (Øst) |
Aktier | Δ Aktier (%) |
Rapporteret Værdi ($1000) |
Δ Værdi (%) |
Port Alloc (%) |
|
|---|---|---|---|---|---|---|---|---|---|---|
| 2026-02-11 | 13F | Capital International Investors | 537.298 | 39.593 | ||||||
| 2026-01-23 | 13F | Optima Capital Llc | 7 | 1 | ||||||
| 2026-02-09 | 13F | Hartland & Co., LLC | 1.833 | 82,21 | 135 | 90,14 | ||||
| 2026-04-27 | 13F | Quantum Private Wealth, LLC | 3.050 | 0,00 | 235 | 4,46 | ||||
| 2025-11-14 | 13F | Ossiam | 0 | -100,00 | 0 | -100,00 | ||||
| 2026-02-13 | 13F | Marshall Wace, Llp | 0 | -100,00 | 0 | |||||
| 2026-02-17 | 13F | Public Employees Retirement System Of Ohio | 321 | -23,39 | 24 | -20,69 | ||||
| 2026-01-29 | 13F | Rakuten Securities, Inc. | 26 | 2.500,00 | 2 | |||||
| 2026-02-13 | 13F | Parkside Financial Bank & Trust | 486 | 13,02 | 36 | 16,67 | ||||
| 2026-02-17 | 13F | Jones Financial Companies Lllp | 2.078 | 249,83 | 153 | 313,51 | ||||
| 2025-11-04 | 13F | Raleigh Capital Management Inc. | 0 | -100,00 | 0 | |||||
| 2026-02-17 | 13F | Millennium Management Llc | Call | 28.600 | -63,89 | 2.108 | -62,76 | |||
| 2026-02-17 | 13F | Cape Investment Advisory, Inc. | 18 | 1 | ||||||
| 2026-02-18 | 13F/A | Fuller & Thaler Asset Management, Inc. | 6.724 | -99,54 | 495 | -99,53 | ||||
| 2026-02-13 | 13F | Kilter Group LLC | 25 | 0,00 | 2 | 0,00 | ||||
| 2026-04-30 | 13F | Nuveen, LLC | 771.120 | -25,73 | 59.291 | -22,50 | ||||
| 2026-02-17 | 13F | Millennium Management Llc | 1.041.730 | -0,58 | 76.765 | 2,54 | ||||
| 2026-02-17 | 13F | Millennium Management Llc | Put | 8.000 | -18,37 | 590 | -15,86 | |||
| 2026-02-10 | 13F | Envestnet Asset Management Inc | 57.920 | 26,71 | 4.268 | 30,68 | ||||
| 2026-02-12 | 13F | Xponance, Inc. | 6.888 | 0,35 | 508 | 3,47 | ||||
| 2026-02-13 | 13F | Victory Capital Management Inc | 192.624 | -53,38 | 14.194 | -51,92 | ||||
| 2026-02-13 | 13F | Neuberger Berman Group LLC | 931.947 | -2,61 | 68.730 | 1,04 | ||||
| 2026-02-17 | 13F | Two Sigma Securities, Llc | 11.263 | 830 | ||||||
| 2026-02-17 | 13F | Creative Planning | 43.869 | 24,48 | 3.233 | 28,36 | ||||
| 2026-04-20 | 13F | Louisiana State Employees Retirement System | 41.000 | 3,27 | 3.152 | 7,76 | ||||
| 2026-04-20 | 13F | Ronald Blue Trust, Inc. | 200 | 0,00 | 15 | 7,14 | ||||
| 2026-02-17 | 13F | Capital Fund Management S.a. | Put | 22.900 | -4,18 | 1.688 | -1,17 | |||
| 2026-04-17 | 13F | Bell Investment Advisors, Inc | 53 | 12,77 | 4 | 33,33 | ||||
| 2026-02-17 | 13F | Capital Fund Management S.a. | Call | 21.600 | -28,48 | 1.592 | -26,24 | |||
| 2026-02-17 | 13F | Fmr Llc | 15.497 | 27,05 | 1.142 | 31,00 | ||||
| 2026-02-02 | 13F | Wolverine Asset Management Llc | Put | 100 | 0,00 | 7 | 0,00 | |||
| 2026-04-07 | 13F | CoreCap Advisors, LLC | 8 | 0,00 | 1 | |||||
| 2026-02-13 | 13F | State Street Corp | 3.848.245 | -1,56 | 283.577 | 1,53 | ||||
| 2026-02-17 | 13F | J. Goldman & Co LP | 4.226 | -70,03 | 311 | -69,12 | ||||
| 2026-02-09 | 13F | Hantz Financial Services, Inc. | 965 | 89,96 | 0 | |||||
| 2026-02-17 | 13F | Sora Investors Llc | 337.491 | 82,19 | 24.870 | 87,90 | ||||
| 2026-02-27 | 13F | Strategic Investment Solutions, Inc. /IL | 0 | -100,00 | 0 | |||||
| 2026-04-30 | 13F | Cedar Mountain Advisors, LLC | 209 | 1.000,00 | 16 | 1.500,00 | ||||
| 2026-02-12 | 13F | Castleark Management Llc | 102.958 | 85,04 | 7.587 | 90,84 | ||||
| 2026-02-13 | 13F | American Century Companies Inc | 12.924 | 26,97 | 952 | 30,95 | ||||
| 2026-02-17 | 13F | Man Group plc | 99.621 | -42,27 | 7.341 | -40,46 | ||||
| 2025-11-13 | 13F | Riggs Asset Managment Co. Inc. | 0 | -100,00 | 0 | -100,00 | ||||
| 2026-02-12 | 13F | Counterpoint Mutual Funds LLC | 0 | -100,00 | 0 | |||||
| 2026-02-13 | 13F | TRUE Private Wealth Advisors | 3.000 | -25,00 | 221 | -22,46 | ||||
| 2026-02-11 | 13F | Los Angeles Capital Management Llc | 49.315 | 0,00 | 3.344 | -5,08 | ||||
| 2026-02-12 | 13F | Dimensional Fund Advisors Lp | 369.725 | -14,82 | 27.249 | -12,04 | ||||
| 2026-02-17 | 13F | Clearline Capital LP | 285.967 | -59,09 | 21.073 | -57,80 | ||||
| 2026-02-17 | 13F | Alliancebernstein L.p. | 2.965.189 | -17,81 | 218.505 | -15,23 | ||||
| 2026-01-29 | 13F | IMC-Chicago, LLC | Call | 45.300 | -12,38 | 3.338 | -9,61 | |||
| 2025-11-14 | 13F | Woodline Partners LP | 0 | -100,00 | 0 | -100,00 | ||||
| 2026-02-12 | 13F | Bank Of Montreal /can/ | 5.657 | -2,72 | 417 | 0,24 | ||||
| 2026-02-17 | 13F | Atom Investors LP | 12.676 | 934 | ||||||
| 2026-04-30 | 13F | Kestra Advisory Services, LLC | 0 | -100,00 | 0 | |||||
| 2026-04-08 | 13F | Wealth Enhancement Advisory Services, Llc | 20.475 | 321,64 | 303 | -29,21 | ||||
| 2026-01-12 | 13F | Rialto Wealth Management, LLC | 1 | 0,00 | 0 | |||||
| 2026-01-30 | 13F | Turning Point Benefit Group, Inc. | 2 | 0,00 | 0 | |||||
| 2026-02-17 | 13F | Quantinno Capital Management LP | 9.369 | 27,07 | 690 | 31,18 | ||||
| 2026-04-30 | 13F | Sequoia Financial Advisors, LLC | 0 | -100,00 | 0 | |||||
| 2026-04-15 | 13F | Archford Capital Strategies, LLC | 0 | -100,00 | 0 | |||||
| 2026-01-30 | 13F | Us Bancorp \de\ | 12.276 | 1,52 | 905 | 4,75 | ||||
| 2026-02-06 | 13F | Mizuho Markets Americas Llc | 84.675 | 6.240 | ||||||
| 2025-11-12 | 13F | Nomura Asset Management Co Ltd | 0 | -100,00 | 0 | -100,00 | ||||
| 2026-02-09 | 13F | Atlantic Trust, LLC | 0 | -100,00 | 0 | |||||
| 2026-02-17 | 13F | Algert Global Llc | 95.964 | 117,10 | 7 | 133,33 | ||||
| 2026-01-29 | 13F | IMC-Chicago, LLC | Put | 42.800 | -12,83 | 3.154 | -10,12 | |||
| 2026-02-09 | 13F | Legal & General Group Plc | 216.333 | -4,89 | 15.942 | -1,91 | ||||
| 2026-02-13 | 13F | Motiv8 Investments LLC | 20 | 0 | ||||||
| 2026-02-13 | 13F | Commerce Bank | 4.947 | -0,90 | 365 | 2,25 | ||||
| 2026-02-04 | 13F | Katamaran Capital LLP | 16.515 | -61,90 | 1.217 | -60,74 | ||||
| 2026-02-05 | 13F | HFM Investment Advisors, LLC | 3 | 0,00 | 0 | |||||
| 2026-02-17 | 13F | Polar Asset Management Partners Inc. | 278.683 | -13,04 | 20.536 | -10,31 | ||||
| 2026-02-17 | 13F | Polar Asset Management Partners Inc. | Put | 35.000 | 2.579 | |||||
| 2026-02-09 | 13F | Royce & Associates Lp | 107.617 | 144,51 | 7.930 | 152,23 | ||||
| 2026-02-13 | 13F | Squarepoint Ops LLC | Put | 176.800 | 28,21 | 13.028 | 32,24 | |||
| 2026-04-02 | 13F | Ares Financial Consulting, LLC | 313 | 25 | ||||||
| 2026-02-09 | 13F | Emerald Mutual Fund Advisers Trust | 285.037 | 14,73 | 21.004 | 18,33 | ||||
| 2026-02-13 | 13F | Squarepoint Ops LLC | 114.448 | 8.434 | ||||||
| 2026-01-30 | 13F | State of New Jersey Common Pension Fund D | 34.394 | -20,14 | 2.534 | -17,65 | ||||
| 2026-02-12 | 13F | Brinker Capital Investments, LLC | 10.074 | 195,08 | 742 | 205,35 | ||||
| 2026-02-13 | 13F | Squarepoint Ops LLC | Call | 29.400 | 2.166 | |||||
| 2026-02-17 | 13F | Jain Global LLC | 98.399 | -40,90 | 7.251 | -39,05 | ||||
| 2026-02-17 | 13F | Northern Trust Corp | 921.769 | -2,84 | 67.925 | 0,21 | ||||
| 2026-02-13 | 13F | BNP Paribas Asset Management Holding S.A. | 1.200 | 42,01 | 0 | |||||
| 2026-02-19 | 13F | CI Private Wealth, LLC | 2.951 | 217 | ||||||
| 2026-02-17 | 13F | Kemnay Advisory Services Inc. | 292 | 22 | ||||||
| 2026-04-23 | 13F | Oppenheimer Asset Management Inc. | 10.307 | -3,25 | 793 | 0,89 | ||||
| 2026-02-13 | 13F | Inspire Advisors, LLC | 4.073 | -27,29 | 300 | -25,00 | ||||
| 2026-04-10 | 13F | Abound Wealth Management | 4 | 0,00 | 0 | |||||
| 2026-02-17 | 13F | Caisse De Depot Et Placement Du Quebec | 0 | -100,00 | 0 | |||||
| 2026-02-17 | 13F | MIRAE ASSET GLOBAL ETFS HOLDINGS Ltd. | 57.503 | -0,81 | 4.237 | 2,29 | ||||
| 2026-04-14 | 13F | Nbc Securities, Inc. | 4.368 | 48,32 | 336 | 55,09 | ||||
| 2026-02-09 | 13F | Connors Investor Services Inc | 60.654 | -2,88 | 4.470 | 0,16 | ||||
| 2025-11-14 | 13F | Mount Yale Investment Advisors, LLC | 0 | -100,00 | 0 | -100,00 | ||||
| 2026-04-08 | 13F | NorthCrest Asset Manangement, LLC | 16.807 | -0,05 | 1.389 | 11,12 | ||||
| 2026-04-20 | 13F | State of Alaska, Department of Revenue | 49.897 | 3,25 | 4 | 0,00 | ||||
| 2026-02-26 | 13F/A | Alpine Global Management, LLC | 5.000 | 368 | ||||||
| 2025-11-14 | 13F | Aigen Investment Management, Lp | 0 | -100,00 | 0 | -100,00 | ||||
| 2026-02-18 | 13F | Vident Advisory, LLC | 4.852 | -20,32 | 358 | -17,93 | ||||
| 2026-02-02 | 13F | Wolverine Asset Management Llc | 2 | -75,00 | 0 | |||||
| 2026-02-13 | 13F | Ubs Asset Management Americas Inc | 210.378 | 28,84 | 15.503 | 32,88 | ||||
| 2026-02-12 | 13F | Cibc World Markets Corp | 5.771 | -46,31 | 425 | -12,37 | ||||
| 2026-02-17 | 13F | Credit Agricole S A | 19.873 | 1.464 | ||||||
| 2026-02-13 | 13F | Mariner, LLC | 0 | -100,00 | 0 | |||||
| 2025-11-06 | 13F | Ameritas Advisory Services, LLC | 0 | -100,00 | 0 | -100,00 | ||||
| 2026-02-17 | 13F | Silvercrest Asset Management Group Llc | 290.192 | -7,31 | 21.384 | -4,41 | ||||
| 2026-02-17 | 13F | Alta Park Capital, LP | 283.726 | 39,34 | 20.908 | 43,71 | ||||
| 2026-04-24 | 13F | Bellevue Asset Management, Llc | 19 | 0,00 | 1 | 0,00 | ||||
| 2026-02-17 | 13F | Artisan Partners Limited Partnership | 493.605 | 55,39 | 36.374 | 60,26 | ||||
| 2026-02-13 | 13F | First Trust Advisors Lp | 107.075 | 37,98 | 7.890 | 42,32 | ||||
| 2025-11-13 | 13F | Glenmede Investment Management, LP | 19.529 | -4,59 | 1.395 | 51,14 | ||||
| 2026-02-13 | 13F | Lord, Abbett & Co. Llc | 282.893 | 21 | ||||||
| 2026-04-27 | 13F | Y-Intercept (Hong Kong) Ltd | 0 | -100,00 | 0 | |||||
| 2026-02-17 | 13F | XTX Topco Ltd | 7.673 | 565 | ||||||
| 2026-04-15 | 13F | Journey Strategic Wealth Llc | 5.748 | 13,26 | 442 | 18,23 | ||||
| 2026-02-17 | 13F | T. Rowe Price Investment Management, Inc. | 306.995 | -80,97 | 23 | -80,87 | ||||
| 2026-01-08 | 13F | Nordea Investment Management Ab | 104.421 | -11,26 | 7.776 | -2,70 | ||||
| 2026-02-17 | 13F | Diker Management Llc | 10.000 | 737 | ||||||
| 2026-02-17 | 13F | Moore Capital Management, Lp | 82.221 | 6.059 | ||||||
| 2026-02-13 | 13F | Boston Partners | 32.337 | 9,01 | 2.383 | 12,41 | ||||
| 2026-04-24 | 13F | Abacus Wealth Partners, LLC | 2.673 | 206 | ||||||
| 2026-02-17 | 13F | Susquehanna International Group, Llp | 0 | -100,00 | 0 | |||||
| 2026-04-28 | 13F | SBI Securities Co., Ltd. | 139 | 40,40 | 11 | 42,86 | ||||
| 2026-02-06 | 13F | Vestmark Advisory Solutions, Inc. | 12.017 | 886 | ||||||
| 2025-11-13 | 13F | Clear Street Markets Llc | 0 | -100,00 | 0 | -100,00 | ||||
| 2026-02-06 | 13F | Pnc Financial Services Group, Inc. | 13.680 | -23,41 | 1.008 | -21,00 | ||||
| 2026-02-13 | 13F | Public Sector Pension Investment Board | 0 | -100,00 | 0 | |||||
| 2026-04-30 | 13F | Cookson Peirce & Co Inc | 12.358 | 950 | ||||||
| 2026-02-13 | 13F | Pinpoint Asset Management (Singapore) Pte. Ltd. | 0 | -100,00 | 0 | |||||
| 2026-02-13 | 13F | Baird Financial Group, Inc. | 15.066 | -7,67 | 1.110 | -4,72 | ||||
| 2026-02-13 | 13F | Sei Investments Co | 215.678 | 16,52 | 15.893 | 20,18 | ||||
| 2026-02-17 | 13F | Elequin Capital Lp | 50 | 4 | ||||||
| 2026-04-24 | 13F | Private Advisor Group, LLC | 2.895 | -6,37 | 223 | -2,20 | ||||
| 2026-02-11 | 13F | LPL Financial LLC | 26.591 | 16,58 | 1.959 | 20,26 | ||||
| 2026-02-17 | 13F | SummitTX Capital, L.P. | 124.724 | -36,41 | 9.191 | -34,42 | ||||
| 2026-02-17 | 13F | Cetera Investment Advisers | 11.737 | 1,53 | 865 | 4,73 | ||||
| 2026-04-06 | 13F | GAMMA Investing LLC | 5.078 | 9,35 | 390 | 14,04 | ||||
| 2026-02-13 | 13F | Bridgefront Capital, LLC | 3.064 | 226 | ||||||
| 2026-04-28 | 13F | Handelsbanken Fonder AB | 26.588 | 0,00 | 2 | 100,00 | ||||
| 2026-04-24 | 13F | CHICAGO TRUST Co NA | 3.868 | 19,86 | 297 | 25,32 | ||||
| 2026-02-11 | 13F | Fiera Capital Corp | 329.991 | 24.317 | ||||||
| 2026-02-17 | 13F | Qube Research & Technologies Ltd | 33.763 | 2.488 | ||||||
| 2026-02-17 | 13F | Delaware Management Holdings, Inc. | 2.453.294 | 180.783 | ||||||
| 2026-02-09 | 13F | Prospera Financial Services Inc | 0 | -100,00 | 0 | |||||
| 2026-04-22 | 13F | Janney Montgomery Scott LLC | 40.582 | 4,91 | 3 | 50,00 | ||||
| 2026-02-13 | 13F | Kayne Anderson Rudnick Investment Management Llc | 11.066 | 66,53 | 815 | 71,94 | ||||
| 2025-11-13 | 13F | Renaissance Technologies Llc | 0 | -100,00 | 0 | -100,00 | ||||
| 2025-12-09 | 13F/A | Tudor Investment Corp Et Al | Put | 0 | -100,00 | 0 | -100,00 | |||
| 2026-04-16 | 13F | Campbell Newman Asset Management Inc | 20.957 | 1.611 | ||||||
| 2026-04-16 | 13F | SG Americas Securities, LLC | 125.582 | 16,47 | 10 | 28,57 | ||||
| 2026-02-09 | 13F | Optimize Financial Inc | 23.112 | 1,46 | 1.703 | 4,67 | ||||
| 2026-02-17 | 13F | Citadel Advisors Llc | Put | 175.600 | -16,26 | 12.940 | -13,64 | |||
| 2026-02-17 | 13F | Citadel Advisors Llc | 1.670.218 | 135,96 | 123.078 | 143,36 | ||||
| 2026-02-17 | 13F | Price T Rowe Associates Inc /md/ | 181.864 | 2,05 | 13 | 8,33 | ||||
| 2026-04-30 | 13F | Teacher Retirement System Of Texas | 12.057 | 320,98 | 927 | 339,34 | ||||
| 2026-02-11 | 13F | Jpmorgan Chase & Co | 383.681 | -54,85 | 28.273 | -53,43 | ||||
| 2026-02-10 | 13F | Eurizon Capital SGR S.p.A. | 261 | 20 | ||||||
| 2026-02-12 | 13F | Skandinaviska Enskilda Banken AB (publ) | 3.036 | 26,50 | 224 | 30,41 | ||||
| 2026-02-17 | 13F | Citadel Advisors Llc | Call | 203.400 | 32,25 | 14.989 | 36,39 | |||
| 2026-02-09 | 13F | Harbour Investments, Inc. | 173 | -8,47 | 13 | -7,69 | ||||
| 2026-04-07 | 13F | Farther Finance Advisors, LLC | 357 | 40,55 | 29 | 55,56 | ||||
| 2026-02-10 | 13F | Td Asset Management Inc | 47.654 | 44,22 | 3.512 | 48,77 | ||||
| 2026-02-17 | 13F | Whale Rock Capital Management LLC | 3.901.469 | 11,31 | 287.499 | 14,80 | ||||
| 2026-02-17 | 13F | Optiver Holding B.V. | 101 | -70,29 | 7 | -70,83 | ||||
| 2026-02-13 | 13F | SRS Capital Advisors, Inc. | 91 | 7 | ||||||
| 2026-02-09 | 13F | Quest Partners LLC | 437 | -24,66 | 32 | -21,95 | ||||
| 2026-02-17 | 13F | EFG International AG | 88.701 | 6.538 | ||||||
| 2025-11-14 | 13F | Wolverine Trading, Llc | 22.410 | -4,31 | 1.389 | 32,06 | ||||
| 2025-11-14 | 13F | Wolverine Trading, Llc | Call | 28.500 | -54,40 | 1.766 | -37,06 | |||
| 2026-02-11 | 13F | Westfield Capital Management Co Lp | 2.448.612 | -27,56 | 180.438 | -25,29 | ||||
| 2025-11-14 | 13F | Wolverine Trading, Llc | Put | 37.900 | 10,82 | 2.349 | 53,03 | |||
| 2026-02-06 | 13F | Legato Capital Management LLC | 38.835 | 48,93 | 2.862 | 53,57 | ||||
| 2026-04-15 | 13F | Exchange Traded Concepts, Llc | 2.075 | -4,07 | 160 | 0,00 | ||||
| 2026-02-09 | 13F | Keating Financial Advisory Services, Inc. | 4 | 0 | ||||||
| 2026-02-12 | 13F | Steward Partners Investment Advisory, Llc | 493 | 0,00 | 36 | 2,86 | ||||
| 2026-02-09 | 13F | Fisher Asset Management, LLC | 7.001 | -70,91 | 516 | -70,04 | ||||
| 2026-02-17 | 13F | California State Teachers Retirement System | 82.410 | -2,66 | 6.073 | 0,38 | ||||
| 2025-12-09 | 13F/A | Tudor Investment Corp Et Al | 0 | -100,00 | 0 | -100,00 | ||||
| 2026-04-07 | 13F | Eastern Bank | 217 | 0,00 | 17 | 6,67 | ||||
| 2026-04-15 | 13F | Fortitude Family Office, LLC | 20 | 0,00 | 2 | 0,00 | ||||
| 2025-11-12 | 13F | Accent Capital Management, LLC | 0 | -100,00 | 0 | -100,00 | ||||
| 2026-04-27 | 13F | Sound Income Strategies, LLC | 776 | 0,00 | 62 | 3,33 | ||||
| 2026-04-29 | 13F | Skopos Labs, Inc. | 3.090 | -17,49 | 238 | -16,25 | ||||
| 2026-01-15 | 13F | Allspring Global Investments Holdings, LLC | 155.576 | 21,74 | 11.709 | 27,82 | ||||
| 2026-04-20 | 13F | Moody Aldrich Partners Llc | 64.326 | 9,05 | 4.946 | 13,81 | ||||
| 2026-02-10 | 13F | Acadian Asset Management Llc | 13.235 | 1 | ||||||
| 2026-02-17 | 13F | Sender Co & Partners, Inc. | Call | 0 | -100,00 | 0 | ||||
| 2026-02-17 | 13F | Brevan Howard Capital Management LP | 0 | -100,00 | 0 | |||||
| 2026-04-23 | 13F | SJS Investment Consulting Inc. | 5 | 0 | ||||||
| 2026-02-05 | 13F | High Note Wealth, LLC | 44 | 3 | ||||||
| 2026-02-09 | 13F | Knights of Columbus Asset Advisors LLC | 37.633 | 2.773 | ||||||
| 2026-02-17 | 13F | Sender Co & Partners, Inc. | 0 | -100,00 | 0 | |||||
| 2026-02-11 | 13F | Capital Research Global Investors | 4.502.720 | -4,03 | 331.805 | -1,02 | ||||
| 2026-04-14 | 13F | Congress Asset Management Co /ma | 36.978 | 2.843 | ||||||
| 2026-02-17 | 13F | Caption Management, LLC | Call | 0 | -100,00 | 0 | ||||
| 2026-04-09 | 13F | Moody National Bank Trust Division | 26.915 | -4,45 | 2.069 | -0,29 | ||||
| 2026-04-27 | 13F | New York State Teachers Retirement System | 76.582 | -6,95 | 6 | -16,67 | ||||
| 2026-04-27 | 13F | Leonteq Securities AG | 1.171 | 11,21 | 90 | 16,88 | ||||
| 2026-04-28 | 13F | Abel Hall, LLC | 4.291 | 15,82 | 330 | 20,51 | ||||
| 2026-02-17 | 13F | Caption Management, LLC | 0 | -100,00 | 0 | |||||
| 2026-02-13 | 13F | Headlands Technologies LLC | 13.796 | 1.017 | ||||||
| 2026-04-27 | 13F | Sierra Summit Advisors Llc | 5.968 | 459 | ||||||
| 2026-03-26 | 13F/A | Peak6 Llc | 0 | -100,00 | 0 | -100,00 | ||||
| 2026-03-12 | 13F/A | Peak6 Llc | Call | 134.100 | 185,32 | 9.882 | 194,25 | |||
| 2025-11-14 | 13F | Sapience Investments, LLC | 0 | -100,00 | 0 | -100,00 | ||||
| 2025-11-14 | 13F | Susquehanna Fundamental Investments, Llc | 0 | -100,00 | 0 | -100,00 | ||||
| 2026-02-13 | 13F | Dymon Asia Capital (singapore) Pte. Ltd. | 0 | -100,00 | 0 | |||||
| 2025-11-07 | 13F | Sierra Ocean, Llc | 0 | -100,00 | 0 | |||||
| 2026-02-13 | 13F | Wells Fargo & Company/mn | 237.624 | 186,48 | 17.511 | 195,48 | ||||
| 2026-02-11 | 13F | Rise Advisors, LLC | 0 | -100,00 | 0 | |||||
| 2025-11-13 | 13F | Hsbc Holdings Plc | 0 | -100,00 | 0 | -100,00 | ||||
| 2026-04-22 | 13F | Pictet Asset Management Holding SA | 15.177 | 11,94 | 1.167 | 16,72 | ||||
| 2026-01-27 | 13F | Asset Management One Co., Ltd. | 2.482 | -13,19 | 188 | -7,84 | ||||
| 2026-02-17 | 13F | Russell Investments Group, Ltd. | 122.070 | 8,87 | 8.995 | 12,28 | ||||
| 2026-02-13 | 13F | Macquarie Group Ltd | 0 | -100,00 | 0 | -100,00 | ||||
| 2026-02-10 | 13F | Commonwealth Of Pennsylvania Public School Empls Retrmt Sys | 21.482 | -2,64 | 1.583 | 0,44 | ||||
| 2025-11-17 | 13F | PDT Partners, LLC | 0 | -100,00 | 0 | -100,00 | ||||
| 2026-02-13 | 13F | Barclays Plc | 140.093 | -72,10 | 10.323 | -71,23 | ||||
| 2026-04-23 | 13F | Oppenheimer & Co Inc | 5.793 | 41,22 | 445 | 47,35 | ||||
| 2025-11-17 | 13F | Jacobs Levy Equity Management, Inc | 0 | -100,00 | 0 | -100,00 | ||||
| 2026-02-11 | 13F | Cerity Partners LLC | 7.920 | 584 | ||||||
| 2026-01-29 | 13F | UBS Group AG | 601.124 | 51,83 | 44.297 | 56,59 | ||||
| 2026-04-27 | 13F | JB Capital LLC | 58.623 | -12,61 | 4.508 | -8,82 | ||||
| 2026-01-29 | 13F | Dunhill Financial, LLC | 2 | 0 | ||||||
| 2026-02-17 | 13F | Paloma Partners Management Co | 0 | -100,00 | 0 | |||||
| 2026-02-17 | 13F | Shelton Capital Management | 2.827 | -9,19 | 208 | -6,31 | ||||
| 2026-02-20 | 13F | Sunbelt Securities, Inc. | 6 | 0,00 | 0 | |||||
| 2026-02-03 | 13F | Pier Capital, LLC | 49.209 | 3.626 | ||||||
| 2026-02-11 | 13F | GW&K Investment Management, LLC | 412.569 | 30 | ||||||
| 2026-01-29 | 13F | Comerica Bank | 21.659 | -95,96 | 1.596 | -95,83 | ||||
| 2026-02-12 | 13F | Hollencrest Capital Management | 3.001 | 221 | ||||||
| 2026-02-17 | 13F | Gilder Gagnon Howe & Co Llc | 33.471 | 2.466 | ||||||
| 2026-02-17 | 13F | Tudor Investment Corp Et Al | Call | 0 | -100,00 | 0 | -100,00 | |||
| 2026-02-06 | 13F | HighTower Advisors, LLC | 5.120 | 29,42 | 377 | 33,69 | ||||
| 2025-11-14 | 13F | Marex Group plc | 0 | -100,00 | 0 | -100,00 | ||||
| 2026-02-17 | 13F | SageView Advisory Group, LLC | 85 | 6 | ||||||
| 2026-02-11 | 13F | Deutsche Bank Ag\ | 137.582 | -91,64 | 10.138 | -91,37 | ||||
| 2026-02-17 | 13F | Weiss Asset Management LP | 0 | -100,00 | 0 | -100,00 | ||||
| 2026-02-17 | 13F | ExodusPoint Capital Management, LP | 0 | -100,00 | 0 | -100,00 | ||||
| 2026-02-12 | 13F | Great Lakes Advisors, Llc | 144.281 | -31,57 | 10.632 | -29,43 | ||||
| 2026-02-10 | 13F | Advisor Resource Council | 5.322 | 467 | ||||||
| 2026-02-17 | 13F | Raymond James Financial Inc | 24.835 | 313,30 | 1.830 | 326,57 | ||||
| 2026-04-07 | 13F | Signaturefd, Llc | 374 | 1,08 | 29 | 3,70 | ||||
| 2026-02-09 | 13F | New Age Alpha Advisors, LLC | 4.208 | 310 | ||||||
| 2026-04-30 | 13F | Candriam Luxembourg S.C.A. | 97.140 | 7.469 | ||||||
| 2026-02-12 | 13F | CIBC Private Wealth Group, LLC | 172 | 5.633,33 | 13 | |||||
| 2026-02-13 | 13F | Smartleaf Asset Management LLC | 1.600 | 1,59 | 120 | 23,71 | ||||
| 2026-02-13 | 13F | Nicholas Investment Partners, LP | 64.399 | 4.746 | ||||||
| 2026-02-14 | 13F | Rockefeller Capital Management L.P. | 1.988 | 70,64 | 146 | 75,90 | ||||
| 2026-02-12 | 13F | Federated Hermes, Inc. | 75.451 | 188,76 | 5.560 | 197,91 | ||||
| 2026-01-27 | 13F | Evergreen Capital Management Llc | 5.945 | 2,34 | 438 | 5,54 | ||||
| 2026-02-09 | 13F | Annis Gardner Whiting Capital Advisors, LLC | 49 | -20,97 | 4 | -25,00 | ||||
| 2026-02-09 | 13F | Wcm Investment Management, Llc | 284.347 | -44,47 | 21.372 | -32,67 | ||||
| 2026-02-13 | 13F | Fiduciary Trust Co | 5.999 | -1,82 | 442 | 1,38 | ||||
| 2026-01-26 | 13F | KBC Group NV | 2.433 | 0,00 | 0 | |||||
| 2026-02-17 | 13F | State Of Wisconsin Investment Board | 154.662 | -8,53 | 11.397 | -5,66 | ||||
| 2026-04-08 | 13F | Miracle Mile Advisors, LLC | 30.888 | 0,00 | 2.375 | 4,31 | ||||
| 2025-11-12 | 13F | Catalyst Funds Management Pty Ltd | 0 | -100,00 | 0 | -100,00 | ||||
| 2026-02-04 | 13F | Pacer Advisors, Inc. | 0 | -100,00 | 0 | |||||
| 2026-02-26 | 13F | TD Capital Management LLC | 6 | 0 | ||||||
| 2026-02-13 | 13F | Stifel Financial Corp | 10.343 | 193,75 | 762 | 203,59 | ||||
| 2026-04-30 | 13F | Oak Ridge Investments Llc | 43.375 | 1,11 | 3.335 | 5,50 | ||||
| 2026-04-20 | 13F | Banque Cantonale Vaudoise | 431 | 33 | ||||||
| 2026-02-12 | 13F | Jane Street Group, Llc | Call | 121.000 | 37,34 | 8.916 | 41,66 | |||
| 2026-04-30 | 13F | Kornitzer Capital Management Inc /ks | 54.115 | 4.161 | ||||||
| 2026-02-18 | 13F | GWM Advisors LLC | 0 | -100,00 | 0 | |||||
| 2026-04-24 | 13F | Root Financial Partners, LLC | 70 | 27,27 | 5 | 25,00 | ||||
| 2026-02-17 | 13F | Susquehanna International Group, Llp | Put | 170.500 | 9,79 | 12.564 | 13,23 | |||
| 2026-02-17 | 13F | Susquehanna International Group, Llp | Call | 369.400 | 35,61 | 27.221 | 39,87 | |||
| 2026-01-27 | 13F | TD Waterhouse Canada Inc. | 1.463 | 5.752,00 | 108 | 10.600,00 | ||||
| 2026-02-17 | 13F | Think Investments LP | 666.400 | -18,77 | 49.107 | -16,22 | ||||
| 2026-02-17 | 13F | Advisor Group Holdings, Inc. | 8.623 | 55,93 | 635 | 94,19 | ||||
| 2026-02-10 | 13F | Bank of New York Mellon Corp | 495.513 | -1,68 | 36.514 | 1,40 | ||||
| 2026-02-03 | 13F | Pilgrim Partners Asia Pte Ltd | 1.100 | 81 | ||||||
| 2026-02-18 | 13F | EP Wealth Advisors, Inc. | 6.974 | -7,82 | 514 | 50,44 | ||||
| 2026-02-17 | 13F | Hancock Whitney Corp | 7.270 | 5,33 | 536 | 8,52 | ||||
| 2026-02-05 | 13F | Bessemer Group Inc | 63.339 | 2.038,39 | 5 | |||||
| 2026-02-13 | 13F | Pathstone Holdings, LLC | 10.557 | 7,22 | 778 | 10,53 | ||||
| 2026-02-06 | 13F | Covestor Ltd | 245 | 7,46 | 0 | |||||
| 2026-02-17 | 13F | Susquehanna Portfolio Strategies, LLC | 82.569 | 0,00 | 6.085 | 3,14 | ||||
| 2025-11-06 | 13F | CIBC World Markets Inc. | 0 | -100,00 | 0 | -100,00 | ||||
| 2026-04-24 | 13F | ProShare Advisors LLC | 14.721 | -14,10 | 1.132 | -10,38 | ||||
| 2026-01-29 | 13F | Vanguard Group Inc | 11.858.352 | 2,59 | 873.842 | 5,80 | ||||
| 2026-02-13 | 13F | MAI Capital Management | 421 | -15,29 | 31 | -11,43 | ||||
| 2026-02-11 | 13F | Simplex Trading, Llc | Put | 15.000 | -19,35 | 1.105 | 110.400,00 | |||
| 2026-02-11 | 13F | Simplex Trading, Llc | 9.936 | -19,04 | 732 | |||||
| 2026-02-11 | 13F | Parallel Advisors, LLC | 252 | 0,00 | 19 | 0,00 | ||||
| 2026-04-07 | 13F/A | Round Rock Advisors, LLC | 3.036 | 0,00 | 224 | 3,24 | ||||
| 2026-02-12 | 13F | Quadrant Capital Group Llc | 2.334 | 2,91 | 172 | 5,56 | ||||
| 2026-02-12 | 13F | Wealthspire Advisors, LLC | 0 | -100,00 | 0 | |||||
| 2026-02-11 | 13F | Simplex Trading, Llc | Call | 19.300 | 22,15 | 1.422 | 142.100,00 | |||
| 2026-02-10 | 13F | CIBC Asset Management Inc | 4.388 | 323 | ||||||
| 2026-02-11 | 13F | Potomac Capital Management, Inc. | 0 | -100,00 | 0 | |||||
| 2026-02-03 | 13F | Crossmark Global Holdings, Inc. | 4.446 | 1,44 | 328 | 4,47 | ||||
| 2026-02-17 | 13F | Capital Fund Management S.a. | 0 | -100,00 | 0 | |||||
| 2025-11-14 | 13F | Toronto Dominion Bank | Call | 0 | -100,00 | 0 | ||||
| 2025-11-14 | 13F | Toronto Dominion Bank | 0 | -100,00 | 0 | |||||
| 2026-02-13 | 13F | Pinnacle Wealth Planning Services, Inc. | 5.628 | -15,23 | 415 | -12,66 | ||||
| 2026-02-17 | 13F | Graham Capital Management, L.P. | 7.096 | 19,76 | 523 | 23,40 | ||||
| 2026-02-12 | 13F | Brown Brothers Harriman & Co | 184 | 14 | ||||||
| 2026-02-13 | 13F | Citigroup Inc | 26.529 | -87,15 | 1.955 | -86,76 | ||||
| 2026-01-30 | 13F | Jennison Associates Llc | 643.828 | 60,48 | 47.444 | 65,51 | ||||
| 2026-02-17 | 13F | Gotham Asset Management, LLC | 28.760 | -57,04 | 2.119 | -55,70 | ||||
| 2026-01-30 | 13F | Archer Investment Corp | 2.683 | 7,28 | 198 | 10,67 | ||||
| 2026-02-09 | 13F | Huntington National Bank | 758 | 1,20 | 56 | 3,77 | ||||
| 2026-02-12 | 13F | Rossby Financial, LCC | 3 | 0 | ||||||
| 2026-02-17 | 13F | Wealth Watch Advisors, INC | 15 | 0,00 | 1 | 0,00 | ||||
| 2026-04-07 | 13F | Financially Speaking Inc | 0 | -100,00 | 0 | |||||
| 2026-02-13 | 13F | Banco Santander, S.A. | 85.000 | 6.264 | ||||||
| 2026-02-17 | 13F | Freestone Grove Partners LP | 277.634 | 73,15 | 20.459 | 78,58 | ||||
| 2026-04-21 | 13F | Gilpin Wealth Management, Llc | 14 | 100,00 | 1 | |||||
| 2026-02-03 | 13F | Mitsubishi UFJ Kokusai Asset Management Co., Ltd. | 200 | 0,00 | 15 | 7,14 | ||||
| 2026-04-28 | 13F | Everence Capital Management Inc | 3.740 | -5,79 | 0 | |||||
| 2025-11-04 | 13F | IMC-Chicago, LLC | 0 | -100,00 | 0 | -100,00 | ||||
| 2026-04-30 | 13F | Nisa Investment Advisors, Llc | 18.852 | 27,52 | 1.450 | 33,06 | ||||
| 2026-02-17 | 13F | Parallax Volatility Advisers, L.P. | Put | 299.000 | 7,17 | 22.033 | 10,53 | |||
| 2026-02-11 | 13F | Empowered Funds, LLC | 8.839 | 1,18 | 651 | 4,33 | ||||
| 2026-02-17 | 13F | Wiley Bros.-aintree Capital, Llc | 15.478 | 7,85 | 1.141 | 11,22 | ||||
| 2026-02-12 | 13F | Swiss National Bank | 171.200 | 1,97 | 12.616 | 5,16 | ||||
| 2026-04-28 | 13F | Sage Rhino Capital Llc | 2.877 | 221 | ||||||
| 2026-02-13 | 13F | Prudential Financial Inc | 81.223 | -6,65 | 5.985 | -3,72 | ||||
| 2026-02-13 | 13F | Walleye Trading LLC | Put | 2.600 | -79,84 | 192 | -79,26 | |||
| 2026-02-13 | 13F | Walleye Trading LLC | Call | 15.600 | -16,58 | 1.150 | -14,00 | |||
| 2026-02-11 | 13F | Heartland Advisors Inc | 64.332 | -36,75 | 4.741 | -34,77 | ||||
| 2026-04-06 | 13F | Versant Capital Management, Inc | 793 | -0,25 | 61 | 3,45 | ||||
| 2026-04-13 | 13F | Massmutual Trust Co Fsb/adv | 216 | 20,67 | 17 | 23,08 | ||||
| 2026-02-04 | 13F | Swiss Life Asset Management Ltd | 4.033 | 0,00 | 297 | 3,13 | ||||
| 2026-02-10 | 13F/A | Northwestern Mutual Wealth Management Co | 1.901 | -25,28 | 140 | -22,65 | ||||
| 2026-02-04 | 13F | Versor Investments LP | 4.691 | -59,02 | 346 | -57,77 | ||||
| 2026-01-27 | 13F | Zurcher Kantonalbank (Zurich Cantonalbank) | 29.299 | 7,57 | 2.159 | 10,95 | ||||
| 2026-02-17 | 13F | Hood River Capital Management LLC | 2.236.224 | 1,80 | 164.787 | 4,99 | ||||
| 2026-02-19 | 13F | Invesco Ltd. | 1.251.104 | 20,30 | 92.194 | 24,08 | ||||
| 2026-02-13 | 13F | Van Eck Associates Corp | 58.301 | 2,80 | 4 | 0,00 | ||||
| 2026-02-17 | 13F | Mangrove Partners | 3.724 | 274 | ||||||
| 2026-02-17 | 13F | Parallax Volatility Advisers, L.P. | 20.000 | -15,68 | 1.474 | -13,05 | ||||
| 2026-01-29 | 13F | Nbc Securities, Inc. | Call | 0 | -100,00 | 0 | -100,00 | |||
| 2025-11-13 | 13F | Panagora Asset Management Inc | 0 | -100,00 | 0 | -100,00 | ||||
| 2026-04-16 | 13F | First Community Trust Na | 145 | 0,00 | 11 | 10,00 | ||||
| 2026-02-11 | 13F | Illinois Municipal Retirement Fund | 43.806 | 2,82 | 3.228 | 6,04 | ||||
| 2026-04-09 | 13F | Nelson, Van Denburg & Campbell Wealth Management Group, LLC | 2.838 | -41,02 | 218 | -38,42 | ||||
| 2026-02-13 | 13F | Essex Investment Management Co Llc | 49.707 | -2,43 | 3.663 | 0,60 | ||||
| 2026-02-17 | 13F | Bank Of America Corp /de/ | 1.008.027 | 17,64 | 74.282 | 21,33 | ||||
| 2026-02-10 | 13F | Godfrey Financial Associates, Inc. | 6 | 0 | ||||||
| 2026-02-02 | 13F | Fifth Third Bancorp | 926 | -8,41 | 68 | -5,56 | ||||
| 2026-04-27 | 13F | Truist Financial Corp | 40.737 | 341,59 | 3.132 | 361,27 | ||||
| 2026-02-17 | 13F | Cinctive Capital Management LP | 94.424 | 6.958 | ||||||
| 2026-02-04 | 13F | Virginia Retirement Systems Et Al | 15.050 | 50,50 | 1.109 | 55,32 | ||||
| 2026-02-12 | 13F | New York State Common Retirement Fund | 430.443 | 55,02 | 31.719 | 59,89 | ||||
| 2026-04-21 | 13F | Blue Jean Financial Llc | 24.092 | 1.852 | ||||||
| 2026-04-23 | 13F | Marquette Asset Management, LLC | 6 | 0 | ||||||
| 2025-11-14 | 13F | Nomura Holdings Inc | Put | 0 | -100,00 | 0 | -100,00 | |||
| 2026-01-28 | 13F | B. Metzler seel. Sohn & Co. AG | 38.980 | -47,14 | 2.872 | -45,48 | ||||
| 2026-02-17 | 13F | Nomura Holdings Inc | 6.437 | 474 | ||||||
| 2026-02-10 | 13F | Goldman Sachs Group Inc | 777.681 | -19,85 | 57.307 | -17,34 | ||||
| 2026-02-17 | 13F | Nomura Holdings Inc | Call | 175.000 | 0,00 | 12.896 | 3,14 | |||
| 2026-02-10 | 13F | Natixis Advisors, L.p. | 37.818 | -2,91 | 3 | 0,00 | ||||
| 2026-02-13 | 13F | Walleye Capital LLC | Call | 4.000 | -60,00 | 295 | -58,82 | |||
| 2026-02-13 | 13F | Walleye Capital LLC | Put | 8.500 | -72,58 | 626 | -71,73 | |||
| 2026-02-13 | 13F | Walleye Capital LLC | 35.100 | 2.587 | ||||||
| 2026-02-13 | 13F | Rhumbline Advisers | 228.460 | -4,48 | 16.835 | -1,49 | ||||
| 2026-02-06 | 13F | Global Retirement Partners, LLC | 3.792 | 9.878,95 | 279 | 13.850,00 | ||||
| 2026-04-23 | 13F | CWM Advisors, LLC | 12.927 | 64,42 | 994 | 71,50 | ||||
| 2026-04-24 | 13F | Keybank National Association/oh | 8.778 | 14,06 | 675 | 18,87 | ||||
| 2026-04-29 | 13F | Klp Kapitalforvaltning As | 20.400 | 4,08 | 1.569 | 8,59 | ||||
| 2026-04-30 | 13F | First Horizon Corp | 1.971 | 0,00 | 152 | 4,14 | ||||
| 2026-02-03 | 13F | International Assets Investment Management, Llc | 45 | 3 | ||||||
| 2026-02-10 | 13F | Bnp Paribas Arbitrage, Sa | 255.270 | 1.047,33 | 18.811 | 1.083,76 | ||||
| 2026-02-17 | 13F | Schonfeld Strategic Advisors LLC | 387.610 | 261,59 | 28.563 | 272,92 | ||||
| 2026-03-12 | 13F/A | Peak6 Llc | Put | 0 | -100,00 | 0 | -100,00 | |||
| 2026-04-15 | 13F | FNY Investment Advisers, LLC | 20 | -85,40 | 0 | |||||
| 2026-02-05 | 13F | Atria Investments Llc | 8.422 | -15,30 | 621 | -12,68 | ||||
| 2025-11-17 | 13F | Alyeska Investment Group, L.P. | 0 | -100,00 | 0 | -100,00 | ||||
| 2026-02-17 | 13F | Trexquant Investment LP | 0 | -100,00 | 0 | |||||
| 2026-02-17 | 13F | Aster Capital Management (DIFC) Ltd | 119 | 9 | ||||||
| 2026-02-17 | 13F | Royal Bank Of Canada | 46.209 | -56,71 | 3.405 | -55,36 | ||||
| 2026-02-17 | 13F | Portolan Capital Management, LLC | 508.655 | -23,95 | 37.483 | -21,57 | ||||
| 2026-02-13 | 13F | Cornerstone Financial Management LLC | 20 | 1 | ||||||
| 2026-04-30 | 13F | Cambridge Investment Research Advisors, Inc. | 8.394 | 32,25 | 1 | |||||
| 2026-01-26 | 13F | Cwm, Llc | 2.879 | 4,20 | 0 | |||||
| 2026-02-17 | 13F | Granahan Investment Management Inc/ma | 0 | -100,00 | 0 | |||||
| 2026-04-24 | 13F | Strs Ohio | 50.500 | 4,99 | 3.883 | 9,54 | ||||
| 2026-02-17 | 13F | Wellington Management Group Llp | 2.340.343 | 0,33 | 172.460 | 3,47 | ||||
| 2026-02-17 | 13F | Fred Alger Management, Llc | 859.855 | 12,04 | 63.363 | 15,55 | ||||
| 2026-01-29 | 13F | Teachers Retirement System Of The State Of Kentucky | 21.711 | 2,37 | 2 | 0,00 | ||||
| 2026-04-29 | 13F | WPG Advisers, LLC | 51 | 0,00 | 4 | 0,00 | ||||
| 2026-01-13 | 13F | Mather Group, Llc. | 0 | -100,00 | 0 | |||||
| 2026-02-12 | 13F | BlackRock, Inc. | 13.189.055 | 2,91 | 971.901 | 6,14 | ||||
| 2025-11-12 | 13F | NewSquare Capital LLC | 0 | -100,00 | 0 | -100,00 | ||||
| 2026-02-12 | 13F | Scotia Capital Inc. | 42.603 | 0,56 | 3.139 | 3,73 | ||||
| 2026-02-17 | 13F | North Capital, Inc. | 0 | -100,00 | 0 | |||||
| 2026-02-12 | 13F | Cloud Capital Management, LLC | 0 | -100,00 | 0 | |||||
| 2026-02-13 | 13F | Mml Investors Services, Llc | 2.948 | 217 | ||||||
| 2026-02-02 | 13F | Danske Bank A/s | 600 | -95,50 | 44 | -95,37 | ||||
| 2026-02-06 | 13F | FourThought Financial Partners, LLC | 0 | -100,00 | 0 | |||||
| 2026-02-13 | 13F | Public Employees Retirement Association Of Colorado | 7.670 | 0,00 | 1 | |||||
| 2026-02-17 | 13F | Canada Pension Plan Investment Board | 10.900 | 803 | ||||||
| 2026-04-28 | 13F | Golden State Equity Partners | 18 | 1 | ||||||
| 2026-02-17 | 13F | Css Llc/il | Put | 15.000 | 0,00 | 1.105 | 3,17 | |||
| 2026-02-13 | 13F | Charles Schwab Investment Management Inc | 984.191 | -2,91 | 72.525 | 0,13 | ||||
| 2026-02-17 | 13F | Css Llc/il | 38.535 | 7,53 | 2.840 | 10,90 | ||||
| 2026-02-17 | 13F | D. E. Shaw & Co., Inc. | Put | 11.400 | 840 | |||||
| 2026-02-17 | 13F | Mercer Global Advisors Inc /adv | 5.828 | -17,89 | 429 | -15,38 | ||||
| 2026-02-17 | 13F | D. E. Shaw & Co., Inc. | 17.605 | 291,22 | 1.297 | 304,05 | ||||
| 2026-02-17 | 13F | Balyasny Asset Management Llc | 467.340 | -1,41 | 34.438 | 1,68 | ||||
| 2025-11-14 | 13F | Sherbrooke Park Advisers Llc | 0 | -100,00 | 0 | |||||
| 2026-04-24 | 13F | Profund Advisors Llc | 4.292 | -27,34 | 330 | -24,14 | ||||
| 2026-04-24 | 13F | Yousif Capital Management, Llc | 25.059 | 6,31 | 1.927 | 6,17 | ||||
| 2026-02-11 | 13F | Group One Trading, L.p. | Put | 6.900 | -29,59 | 508 | -27,43 | |||
| 2026-02-11 | 13F | Group One Trading, L.p. | 11.504 | -60,45 | 848 | -59,24 | ||||
| 2026-02-11 | 13F | Group One Trading, L.p. | Call | 22.200 | -45,32 | 1.636 | -43,62 | |||
| 2026-02-17 | 13F | Guggenheim Capital Llc | 18.110 | 31,10 | 1.335 | 35,16 | ||||
| 2026-02-11 | 13F | O'shaughnessy Asset Management, Llc | 6.859 | 15,88 | 505 | 19,67 | ||||
| 2025-11-03 | 13F | EFG Asset Management (North America) Corp. | 109.606 | 15,53 | 7.830 | 82,88 | ||||
| 2026-02-17 | 13F | LMR Partners LLP | 386.810 | 3.768,10 | 28.504 | 3.892,16 | ||||
| 2026-02-12 | 13F | Ankerstar Wealth, LLC | 14 | 1 | ||||||
| 2026-02-13 | 13F | Fieldview Capital Management, LLC | 0 | -100,00 | 0 | -100,00 | ||||
| 2026-04-08 | 13F | DiNuzzo Private Wealth, Inc. | 5 | 0,00 | 0 | |||||
| 2026-02-11 | 13F | Zions Bancorporation, National Association /ut/ | 15 | 1 | ||||||
| 2026-01-28 | 13F | Universal- Beteiligungs- und Servicegesellschaft mbH | 201.884 | 24,97 | 14.877 | 28,89 | ||||
| 2026-02-17 | 13F | Duquesne Family Office LLC | 0 | -100,00 | 0 | |||||
| 2026-04-09 | 13F | Park Place Capital Corp | 10 | 0,00 | 1 | |||||
| 2026-04-29 | 13F | Police & Firemen's Retirement System of New Jersey | 25.468 | 7,70 | 1.958 | 12,40 | ||||
| 2026-02-17 | 13F | Amundi | 17.638 | 14,06 | 1.300 | 23,24 | ||||
| 2026-02-17 | 13F | Ardsley Advisory Partners Lp | 237.000 | 196,25 | 17.465 | 205,53 | ||||
| 2026-02-17 | 13F | Ardsley Advisory Partners Lp | Call | 22.000 | -45,00 | 1.621 | -43,28 | |||
| 2026-02-10 | 13F | Connor, Clark & Lunn Investment Management Ltd. | 0 | -100,00 | 0 | -100,00 | ||||
| 2026-02-17 | 13F | Point72 Asset Management, L.P. | 1.208.272 | 189,23 | 89.038 | 198,30 | ||||
| 2026-02-12 | 13F | Ensign Peak Advisors, Inc | 4.706 | -69,84 | 347 | -68,97 | ||||
| 2025-11-12 | 13F | Picton Mahoney Asset Management | 0 | -100,00 | 0 | |||||
| 2026-02-17 | 13F | Point72 Asset Management, L.P. | Call | 4.000 | 295 | |||||
| 2026-02-02 | 13F | CENTRAL TRUST Co | 0 | -100,00 | 0 | |||||
| 2026-02-13 | 13F | Caxton Associates Llp | 6.918 | 510 | ||||||
| 2026-02-10 | 13F | Mutual Of America Capital Management Llc | 9.918 | 2,19 | 731 | 5,34 | ||||
| 2026-02-13 | 13F | JustInvest LLC | 5.515 | 10,99 | 406 | 14,37 | ||||
| 2026-01-26 | 13F | AE Wealth Management LLC | 5.928 | 25,73 | 437 | 29,76 | ||||
| 2026-02-17 | 13F | Atreides Management, LP | 691.591 | 1,98 | 50.963 | 5,18 | ||||
| 2026-02-17 | 13F | Driehaus Capital Management Llc | 931.305 | 108,33 | 68.628 | 114,86 | ||||
| 2026-02-13 | 13F | Umb Bank N A/mo | 488 | 27,42 | 36 | 29,63 | ||||
| 2026-02-10 | 13F | Rothschild Investment Llc | 168 | 12,00 | 12 | 20,00 | ||||
| 2026-02-13 | 13F | Schroder Investment Management Group | 830.928 | -5,56 | 62.453 | 14,52 | ||||
| 2026-02-06 | 13F | Bare Financial Services, Inc | 186 | 9,41 | 14 | 8,33 | ||||
| 2026-02-05 | 13F | Allworth Financial LP | 327 | 24,33 | 24 | 33,33 | ||||
| 2026-02-12 | 13F | Integrated Quantitative Investments LLC | 19.709 | 1.452 | ||||||
| 2026-04-13 | 13F | IFP Advisors, Inc | 718 | -0,28 | 55 | 3,77 | ||||
| 2026-02-10 | 13F | Intech Investment Management Llc | 43.051 | -2,85 | 3.172 | 0,19 | ||||
| 2026-02-13 | 13F | Diametric Capital, LP | 9.030 | 10,08 | 665 | 13,48 | ||||
| 2025-12-15 | 13F | FNY Investment Advisers, LLC | Call | 0 | -100,00 | 0 | ||||
| 2026-02-13 | 13F | Edgestream Partners, L.P. | 39.150 | 398,60 | 2.885 | 414,08 | ||||
| 2026-02-17 | 13F | Lazard Asset Management Llc | 528 | 39 | ||||||
| 2026-04-24 | 13F | UMA Financial Services, Inc. | 0 | -100,00 | 0 | |||||
| 2026-02-18 | 13F | State of Tennessee, Treasury Department | 34.222 | -6,74 | 2.729 | 4,12 | ||||
| 2026-02-18 | 13F | Mackenzie Financial Corp | 5.528 | -0,23 | 415 | 4,81 | ||||
| 2026-02-17 | 13F | Cooper Creek Partners Management Llc | 614.233 | 105,67 | 45 | 114,29 | ||||
| 2026-02-17 | 13F | Disciplined Growth Investors Inc /mn | 2.801.291 | 2,63 | 206.427 | 5,85 | ||||
| 2026-02-02 | 13F | Principal Financial Group Inc | 414.981 | -0,95 | 30.580 | 2,15 | ||||
| 2026-02-11 | 13F | Franklin Resources Inc | 17.621 | -0,73 | 1.298 | 2,37 | ||||
| 2026-02-17 | 13F | Tower Research Capital LLC (TRC) | 3.028 | -7,09 | 223 | -3,88 | ||||
| 2026-02-17 | 13F | Aqr Capital Management Llc | 62.380 | 20,88 | 4.597 | 24,65 | ||||
| 2025-11-14 | 13F | Shellback Capital, LP | 0 | -100,00 | 0 | -100,00 | ||||
| 2026-02-10 | 13F | State of Wyoming | 1.524 | 19,34 | 112 | 23,08 | ||||
| 2026-04-28 | 13F | Flagship Harbor Advisors, Llc | 0 | -100,00 | 0 | |||||
| 2026-02-12 | 13F | Principal Securities, Inc. | 6.336 | -0,13 | 467 | 2,87 | ||||
| 2026-02-10 | 13F | Norges Bank | 119.216 | 8.785 | ||||||
| 2025-11-05 | 13F | BI Asset Management Fondsmaeglerselskab A/S | 0 | -100,00 | 0 | |||||
| 2026-02-17 | 13F | Engineers Gate Manager LP | 0 | -100,00 | 0 | -100,00 | ||||
| 2026-04-22 | 13F | Sterling Capital Management LLC | 14.716 | -68,91 | 1.132 | -67,57 | ||||
| 2026-04-28 | 13F | Harbor Capital Advisors, Inc. | 16.566 | -14,62 | 1 | 0,00 | ||||
| 2026-02-10 | 13F | Andar Capital Management HK Ltd | 189.525 | 89,53 | 13.966 | 95,47 | ||||
| 2026-02-09 | 13F | Geode Capital Management, Llc | 2.099.033 | 0,32 | 154.704 | 3,47 | ||||
| 2026-02-11 | 13F | Atlantic Private Wealth, LLC | 5 | 0 | ||||||
| 2026-04-14 | 13F | Bay Harbor Wealth Management, LLC | 2 | 0,00 | 0 | |||||
| 2026-02-17 | 13F | Strive Financial Group ,LLC | 225 | 17 | ||||||
| 2026-02-13 | 13F | Great West Life Assurance Co /can/ | 74.361 | -15,57 | 5 | 0,00 | ||||
| 2025-11-14 | 13F | Toroso Investments, LLC | 0 | -100,00 | 0 | -100,00 | ||||
| 2026-04-23 | 13F | Farmers & Merchants Investments Inc | 45 | 0,00 | 3 | 0,00 | ||||
| 2026-04-30 | 13F | Torren Management, LLC | 18 | 0,00 | 1 | 0,00 | ||||
| 2026-02-17 | 13F | Scientech Research LLC | 0 | -100,00 | 0 | |||||
| 2026-02-12 | 13F | Commonwealth Equity Services, Llc | 5.381 | -21,31 | 397 | |||||
| 2026-01-07 | 13F | Aventura Private Wealth, LLC | 0 | -100,00 | 0 | |||||
| 2026-02-12 | 13F | State Board Of Administration Of Florida Retirement System | 18.258 | 0,00 | 1.345 | 3,14 | ||||
| 2026-02-02 | 13F | Montag A & Associates Inc | 0 | -100,00 | 0 | |||||
| 2026-02-13 | 13F | Tairen Capital Ltd | 8.100 | 597 | ||||||
| 2026-02-13 | 13F | Wells Fargo & Company/mn | Call | 0 | -100,00 | 0 | -100,00 | |||
| 2026-02-17 | 13F | Captrust Financial Advisors | 19.302 | 0,85 | 1.422 | 4,02 | ||||
| 2026-01-30 | 13F/A | M&t Bank Corp | 3.332 | 246 | ||||||
| 2026-04-27 | 13F | Argos Wealth Advisors, LLC | 7.584 | -12,65 | 583 | -8,76 | ||||
| 2026-02-17 | 13F | Two Sigma Advisers, Lp | 14.200 | -84,01 | 1.046 | -83,51 | ||||
| 2026-02-09 | 13F | Emerald Advisers, Llc | 470.751 | 12,33 | 34.690 | 15,85 | ||||
| 2026-01-23 | 13F | Assetmark, Inc | 9.028 | 1.382,43 | 665 | 1.446,51 | ||||
| 2026-02-10 | 13F | Hillsdale Investment Management Inc. | 110 | 0,00 | 8 | 14,29 | ||||
| 2026-02-17 | 13F | Glenmede Trust Co Na | 17.843 | -4,02 | 1.315 | 105,63 | ||||
| 2026-02-02 | 13F | Horizon Investments, LLC | 13.477 | 993 | ||||||
| 2026-02-13 | 13F | Landscape Capital Management, L.l.c. | 34.868 | 26,24 | 2.569 | 30,21 | ||||
| 2026-02-13 | 13F | Quarry LP | 0 | -100,00 | 0 | |||||
| 2025-11-14 | 13F | Texas Permanent School Fund | 0 | -100,00 | 0 | -100,00 | ||||
| 2026-02-09 | 13F | Jefferies Financial Group Inc. | 0 | -100,00 | 0 | |||||
| 2026-02-06 | 13F | EverSource Wealth Advisors, LLC | 78 | 13,04 | 6 | 25,00 | ||||
| 2026-02-04 | 13F | Valeo Financial Advisors, LLC | 2.729 | 201 | ||||||
| 2026-02-10 | 13F | Daiwa Securities Group Inc. | 1.195 | 100,84 | 0 | |||||
| 2026-02-17 | 13F | Palisade Capital Management Llc/nj | 587.696 | 3,78 | 43.307 | 7,03 | ||||
| 2026-02-09 | 13F | Lisanti Capital Growth, LLC | 54.040 | -10,59 | 3.982 | -7,78 | ||||
| 2026-02-17 | 13F | Maryland State Retirement & Pension System | 12.709 | 2,04 | 937 | 5,29 | ||||
| 2026-04-13 | 13F | True Wealth Design, LLC | 34 | 0,00 | 3 | 0,00 | ||||
| 2026-02-17 | 13F | Two Sigma Investments, Lp | Put | 730.000 | 0,00 | 53.794 | 3,13 | |||
| 2026-04-08 | 13F | Sax Wealth Advisors, Llc | 3.293 | 0,00 | 243 | 0,00 | ||||
| 2026-02-11 | 13F | Ameritas Investment Partners, Inc. | 7.081 | 522 | ||||||
| 2026-02-17 | 13F | Two Sigma Investments, Lp | 215.354 | -43,42 | 15.869 | -41,65 | ||||
| 2026-04-28 | 13F | Hodges Capital Management Inc. | 89.525 | 8,75 | 6.884 | 13,47 | ||||
| 2026-01-20 | 13F | Accel Wealth Management | 0 | -100,00 | 0 | |||||
| 2026-02-17 | 13F | Janus Henderson Group Plc | 55.744 | 45,60 | 4.108 | 50,26 | ||||
| 2025-11-06 | 13F | Stratos Wealth Partners, LTD. | 0 | -100,00 | 0 | |||||
| 2026-02-06 | 13F | Larson Financial Group LLC | 141 | 540,91 | 10 | 900,00 | ||||
| 2026-02-12 | 13F | Voya Investment Management Llc | 28.321 | 7,07 | 2.087 | 10,43 | ||||
| 2026-01-08 | 13F | Chesapeake Asset Management Llc | 153 | 11 | ||||||
| 2026-02-13 | 13F | Morgan Stanley | 1.389.257 | -55,67 | 102.375 | -54,28 | ||||
| 2026-04-20 | 13F | Jfs Wealth Advisors, Llc | 6 | 0,00 | 0 | |||||
| 2025-11-21 | 13F/A | CIBC Bancorp USA Inc. | 9.299 | 664 | ||||||
| 2026-02-05 | 13F | Amalgamated Bank | 25.284 | 3,17 | 2 | 0,00 | ||||
| 2026-02-12 | 13F | Jane Street Group, Llc | 182.324 | 13.435 | ||||||
| 2026-04-20 | 13F | Assenagon Asset Management S.A. | 781.003 | 323,01 | 60.051 | 341,39 | ||||
| 2026-02-12 | 13F | Jane Street Group, Llc | Put | 71.400 | -8,34 | 5.261 | -5,46 | |||
| 2026-04-27 | 13F | Nvwm, Llc | 50 | 0,00 | 4 | 0,00 | ||||
| 2026-02-17 | 13F | Advisory Services Network, LLC | 0 | -100,00 | 0 | |||||
| 2026-02-13 | 13F | Manufacturers Life Insurance Company, The | 0 | -100,00 | 0 | |||||
| 2026-02-05 | 13F | Thrivent Financial For Lutherans | 59.624 | -4,60 | 4 | 0,00 | ||||
| 2026-02-17 | 13F | DV Trading LLC | 2 | 0 | ||||||
| 2026-01-28 | 13F | Salomon & Ludwin, LLC | 650 | 13,44 | 48 | 17,07 | ||||
| 2026-02-17 | 13F | Ameriprise Financial Inc | 7.552.252 | 2,42 | 556.525 | 5,63 | ||||
| 2026-01-28 | 13F | Arizona State Retirement System | 24.270 | -5,23 | 1.788 | -2,24 | ||||
| 2026-02-12 | 13F | MetLife Investment Management, LLC | 48.919 | -8,12 | 3.605 | -5,26 | ||||
| 2026-04-28 | 13F | Whittier Trust Co Of Nevada Inc | 37 | 131,25 | 3 | 200,00 | ||||
| 2026-04-28 | 13F | Stephens Inc /ar/ | 5.216 | 18,28 | 401 | 23,77 | ||||
| 2026-01-21 | 13F | Future Financial Wealth Managment LLC | 0 | -100,00 | 0 | |||||
| 2025-11-14 | 13F | Aquatic Capital Management LLC | 0 | -100,00 | 0 | |||||
| 2026-04-29 | 13F | Oregon Public Employees Retirement Fund | 21.134 | 6,54 | 1.625 | 11,16 | ||||
| 2026-02-17 | 13F | Concentric Capital Strategies, LP | 0 | -100,00 | 0 | |||||
| 2026-02-13 | 13F | Verition Fund Management LLC | 41.300 | 0,66 | 3.043 | 3,82 |