Grundlæggende statistik
| Institutionelle aktier (lange) | 48.507.468 - 62,45% (ex 13D/G) - change of -1,18MM shares -2,38% MRQ |
| Institutionel værdi (lang) | $ 1.637.079 USD ($1000) |
Institutionelt ejerskab og aktionærer
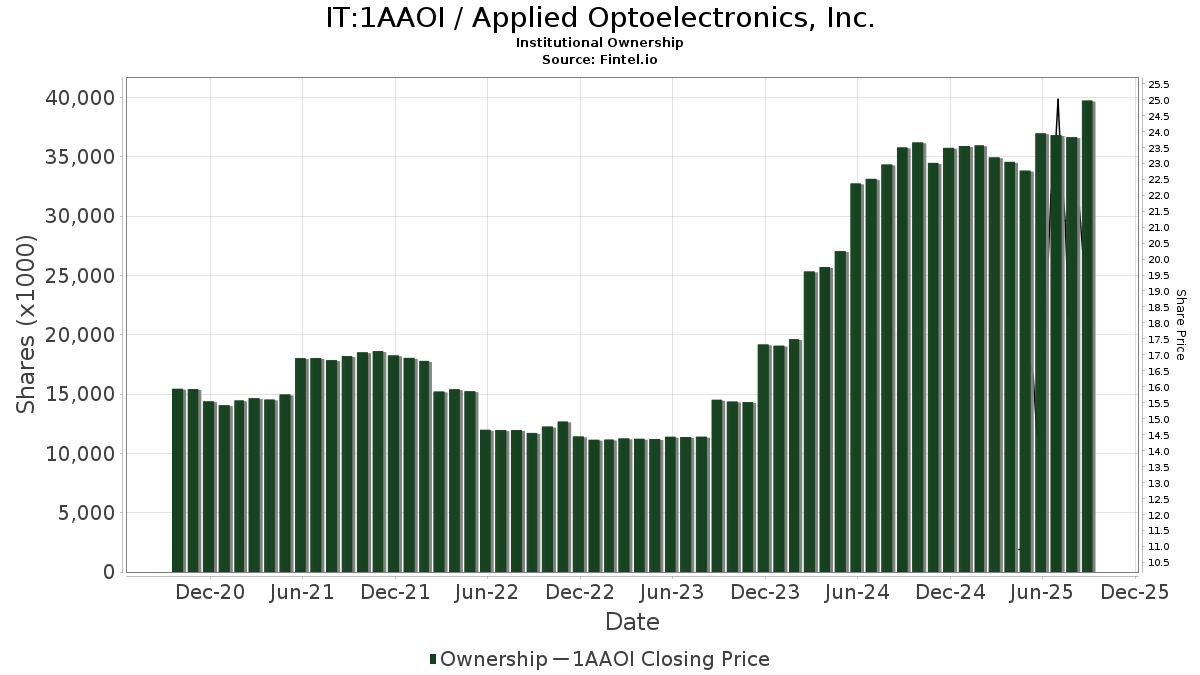
Applied Optoelectronics, Inc. (IT:1AAOI) har 263 institutionelle ejere og aktionærer, der har indsendt 13D/G- eller 13F-formularer til Securities Exchange Commission (SEC). Disse institutioner har i alt 48,507,468 aktier. Største aktionærer omfatter BlackRock, Inc., Vanguard Group Inc, Invesco Ltd., Jane Street Group, Llc, Susquehanna International Group, Llp, Price T Rowe Associates Inc /md/, Oberweis Asset Management Inc/, Hawk Ridge Capital Management Lp, Morgan Stanley, and Jane Street Group, Llc .
Applied Optoelectronics, Inc. (BIT:1AAOI) institutionel ejerskabsstruktur viser aktuelle positioner i virksomheden efter institutioner og fonde, samt seneste ændringer i positionsstørrelse. Større aktionærer kan omfatte individuelle investorer, investeringsforeninger, hedgefonde eller institutioner. Skema 13D angiver, at investoren besidder (eller besidder) mere end 5 % af virksomheden og har til hensigt (eller har til hensigt at) aktivt at forfølge en ændring i forretningsstrategi. Skema 13G indikerer en passiv investering på over 5%.
The share price as of April 27, 2026 is 123,00 / share. Previously, on April 28, 2025, the share price was 10,90 / share. This represents an increase of 1.028,44% over that period.
Fondens stemningsscore
Fund Sentiment Score (fka Ownership Accumulation Score) finder de aktier, der bliver mest købt af fonde. Det er resultatet af en sofistikeret, multi-faktor kvantitativ model, der identificerer virksomheder med de højeste niveauer af institutionel akkumulering. Scoringsmodellen bruger en kombination af den samlede stigning i oplyste ejere, ændringerne i porteføljeallokeringer i disse ejere og andre målinger. Tallet går fra 0 til 100, hvor højere tal indikerer et højere niveau af akkumulering for sine jævnaldrende, og 50 er gennemsnittet.
Opdateringsfrekvens: Dagligt
Se Ownership Explorer, som giver en liste over højest rangerende virksomheder.
AI+ Ask Fintel’s AI assistant about Applied Optoelectronics, Inc..
Select a question to share a public post with an AI-crafted answer.
Thinking of good questions…
13F og NPORT arkivering
Detaljer om 13F-arkivering er gratis. Detaljer om NP-ansøgninger kræver et premium-medlemskab. Grønne rækker angiver nye positioner. Røde rækker angiver lukkede positioner. Klik på linket ikon for at se den fulde transaktionshistorik.
Opgrader
for at låse premium-data op og eksportere til Excel ![]() .
.
| Fil dato | Kilde | Investor | Type | Gennemsnitlig pris (Øst) |
Aktier | Δ Aktier (%) |
Rapporteret Værdi ($1000) |
Δ Værdi (%) |
Port Alloc (%) |
|
|---|---|---|---|---|---|---|---|---|---|---|
| 2026-04-27 | 13F | Albion Financial Group /ut | 1.000 | 85 | ||||||
| 2026-02-09 | 13F | Penn Capital Management Co Inc | 446.032 | 4,71 | 15.565 | 40,78 | ||||
| 2026-04-22 | 13F | Oak Harvest Investment Services | 37.872 | 3.204 | ||||||
| 2026-02-02 | 13F | Principal Financial Group Inc | 0 | -100,00 | 0 | |||||
| 2026-02-13 | 13F | Pinnacle Wealth Planning Services, Inc. | 451 | 16 | ||||||
| 2026-02-17 | 13F | Schonfeld Strategic Advisors LLC | 0 | -100,00 | 0 | |||||
| 2026-02-17 | 13F | Hawk Ridge Capital Management Lp | 1.700.900 | 106,17 | 59.293 | 177,17 | ||||
| 2026-04-13 | 13F | Artemis Investment Management LLP | 340.148 | -55,96 | 28.773 | 6,87 | ||||
| 2026-04-28 | 13F | Westfuller Advisors, LLC | 111 | 9 | ||||||
| 2026-02-13 | 13F | Marshall Wace, Llp | Put | 0 | -100,00 | 0 | ||||
| 2026-02-13 | 13F | Truvestments Capital Llc | 27.256 | 14,59 | 950 | 54,22 | ||||
| 2026-04-24 | 13F | Patten Group, Inc. | 3.240 | 274 | ||||||
| 2026-02-11 | 13F | Los Angeles Capital Management Llc | 7.150 | 251 | ||||||
| 2026-04-27 | 13F | Sierra Summit Advisors Llc | 10.102 | 855 | ||||||
| 2026-02-11 | 13F | Franklin Resources Inc | 10.052 | -11,00 | 350 | 19,86 | ||||
| 2026-02-17 | 13F | Scientech Research LLC | 5.938 | 207 | ||||||
| 2025-11-14 | 13F | Two Sigma Advisers, Lp | 0 | -100,00 | 0 | |||||
| 2026-02-11 | 13F | Ameritas Investment Partners, Inc. | 4.902 | 171 | ||||||
| 2026-02-13 | 13F | Alyeska Investment Group, L.P. | 0 | -100,00 | 0 | -100,00 | ||||
| 2026-02-17 | 13F | Diker Management Llc | 0 | -100,00 | 0 | |||||
| 2026-04-21 | 13F | Trilogy Capital Inc. | 6.750 | 0,00 | 571 | 142,55 | ||||
| 2026-02-17 | 13F | Prelude Capital Management, Llc | 48.748 | 1.699 | ||||||
| 2026-02-02 | 13F | Wolverine Asset Management Llc | 3.660 | -59,22 | 128 | -45,26 | ||||
| 2026-02-12 | 13F | AI-Squared Management Ltd | 0 | -100,00 | 0 | -100,00 | ||||
| 2026-03-25 | 13F/A | Barclays Plc | Put | 0 | -100,00 | 0 | -100,00 | |||
| 2025-12-09 | 13F/A | Tudor Investment Corp Et Al | Call | 0 | -100,00 | 0 | -100,00 | |||
| 2026-02-04 | 13F | LRI Investments, LLC | 99 | 43,48 | 3 | 200,00 | ||||
| 2026-02-17 | 13F | Shay Capital LLC | 25.000 | 872 | ||||||
| 2026-02-11 | 13F | LPL Financial LLC | 27.004 | 8,84 | 941 | 46,35 | ||||
| 2026-02-17 | 13F | Caption Management, LLC | Call | 65.000 | 61,29 | 2.266 | 116,95 | |||
| 2026-03-12 | 13F/A | Peak6 Llc | Put | 77.500 | 19.275,00 | 2.702 | 26.910,00 | |||
| 2026-03-12 | 13F/A | Peak6 Llc | Call | 32.800 | 134,29 | 1.143 | 214,88 | |||
| 2026-02-17 | 13F | Symmetry Investments LP | Call | 20.000 | 697 | |||||
| 2026-02-12 | 13F | Ensign Peak Advisors, Inc | 3.800 | -68,85 | 132 | -58,23 | ||||
| 2026-02-02 | 13F | Wolverine Asset Management Llc | Put | 250.300 | 0,00 | 8.725 | 34,44 | |||
| 2026-02-13 | 13F | Wells Fargo & Company/mn | 88.822 | 111,27 | 3.096 | 184,04 | ||||
| 2026-02-17 | 13F | Creative Planning | 11.804 | 40,44 | 411 | 89,40 | ||||
| 2026-02-17 | 13F | Capital Fund Management S.a. | Call | 42.100 | -61,31 | 1.468 | -48,00 | |||
| 2026-02-17 | 13F | Advisory Services Network, LLC | 0 | -100,00 | 0 | |||||
| 2026-02-17 | 13F | Capital Fund Management S.a. | Put | 26.900 | -63,30 | 938 | -50,68 | |||
| 2026-01-28 | 13F | CAPROCK Group, Inc. | 6.239 | 217 | ||||||
| 2026-02-17 | 13F | Jones Financial Companies Lllp | 217 | -0,46 | 8 | 40,00 | ||||
| 2026-02-09 | 13F | Geode Capital Management, Llc | 1.512.902 | 10,73 | 52.750 | 48,88 | ||||
| 2026-02-13 | 13F | Walleye Trading LLC | Put | 251.100 | 5,42 | 8.753 | 41,73 | |||
| 2026-04-22 | 13F | Stone House Investment Management, LLC | 5 | 0 | ||||||
| 2026-02-13 | 13F | Walleye Trading LLC | Call | 152.700 | 67,80 | 5.323 | 125,65 | |||
| 2026-02-12 | 13F | Bank Of Montreal /can/ | 30.339 | 1.058 | ||||||
| 2026-02-17 | 13F | Strive Financial Group ,LLC | 370 | 13 | ||||||
| 2026-02-11 | 13F | Jpmorgan Chase & Co | 55.465 | 61,98 | 1.934 | 117,93 | ||||
| 2026-02-06 | 13F | EverSource Wealth Advisors, LLC | 62 | 0,00 | 2 | 100,00 | ||||
| 2026-04-16 | 13F | Brookstone Capital Management | 6.391 | 541 | ||||||
| 2026-02-06 | 13F | Covestor Ltd | 4 | 0,00 | 0 | |||||
| 2026-02-13 | 13F | National Bank Of Canada /fi/ | 38 | -17,39 | 1 | 0,00 | ||||
| 2026-02-17 | 13F | Caption Management, LLC | Put | 0 | -100,00 | 0 | ||||
| 2026-02-17 | 13F | Caption Management, LLC | 0 | -100,00 | 0 | |||||
| 2026-02-06 | 13F | Larson Financial Group LLC | 10.433 | 45,69 | 364 | 96,22 | ||||
| 2025-11-14 | 13F | Cubist Systematic Strategies, LLC | Put | 139.000 | 62,19 | 3.604 | 63,74 | |||
| 2026-01-14 | 13F | ORG Partners LLC | 0 | -100,00 | 0 | -100,00 | ||||
| 2026-02-17 | 13F | Hampton Road Capital Management LP | 71.500 | 2.492 | ||||||
| 2025-11-14 | 13F | Cubist Systematic Strategies, LLC | Call | 94.600 | 27,67 | 2.453 | 28,85 | |||
| 2026-04-21 | 13F | Financial Consulate, Inc | 5 | 0 | ||||||
| 2026-02-12 | 13F | Hrt Financial Lp | 53.935 | 13,23 | 2 | 0,00 | ||||
| 2026-04-23 | 13F | Global Trust Asset Management, LLC | 59.562 | 114,22 | 5.038 | 419,92 | ||||
| 2026-02-17 | 13F | Gilder Gagnon Howe & Co Llc | 475.015 | 450,76 | 16.559 | 640,56 | ||||
| 2026-02-13 | 13F | Squarepoint Ops LLC | 193.153 | 81,14 | 6.733 | 143,60 | ||||
| 2025-11-14 | 13F | Point72 Asia (Singapore) Pte. Ltd. | 338.976 | 8.790 | ||||||
| 2026-02-10 | 13F | Bnp Paribas Arbitrage, Sa | 955.287 | 8.508,52 | 33.301 | 11.503,14 | ||||
| 2025-11-14 | 13F | Point72 Hong Kong Ltd | 646.759 | 16.770 | ||||||
| 2026-01-27 | 13F | WealthCollab, LLC | 13 | 0,00 | 0 | |||||
| 2026-02-12 | 13F | Quadrant Capital Group Llc | 990 | 2,06 | 35 | 36,00 | ||||
| 2026-02-20 | 13F | Sunbelt Securities, Inc. | 100 | 0,00 | 3 | 50,00 | ||||
| 2026-02-17 | 13F | Driehaus Capital Management Llc | 507.473 | 35,22 | 17.691 | 81,79 | ||||
| 2026-04-20 | 13F | Hilton Head Capital Partners, LLC | 178 | 15 | ||||||
| 2026-02-11 | 13F | Havemeyer Place LP | 23.546 | 821 | ||||||
| 2026-02-13 | 13F | Soros Fund Management Llc | 11.576 | 404 | ||||||
| 2026-02-13 | 13F | Next Century Growth Investors Llc | 465.288 | 16.220 | ||||||
| 2026-04-17 | 13F | Krilogy Financial LLC | 1.785 | 281 | ||||||
| 2026-02-13 | 13F | Pathstone Holdings, LLC | 7.181 | 250 | ||||||
| 2025-11-07 | 13F | Gf Fund Management Co. Ltd. | 0 | -100,00 | 0 | |||||
| 2026-02-09 | 13F | Emerald Advisers, Llc | 670.577 | 9,99 | 23.376 | 47,87 | ||||
| 2026-02-17 | 13F | ExodusPoint Capital Management, LP | Call | 0 | -100,00 | 0 | -100,00 | |||
| 2026-01-28 | 13F | Klp Kapitalforvaltning As | 14.500 | 38,10 | 505 | 85,66 | ||||
| 2026-02-13 | 13F | State Street Corp | 1.606.236 | 11,50 | 55.993 | 49,90 | ||||
| 2026-02-11 | 13F | Deutsche Bank Ag\ | 55.035 | 33,14 | 1.919 | 79,08 | ||||
| 2026-02-13 | 13F | Walleye Trading LLC | 102.588 | 18,94 | 3.576 | 59,93 | ||||
| 2026-02-09 | 13F | Legal & General Group Plc | 69.745 | 1,14 | 2.431 | 35,96 | ||||
| 2026-02-12 | 13F | Gerber Kawasaki Wealth & Investment Management | 0 | -100,00 | 0 | |||||
| 2026-02-13 | 13F | American Century Companies Inc | 32.734 | 78,92 | 1.141 | 140,72 | ||||
| 2026-02-17 | 13F | Point72 Asset Management, L.P. | Put | 196.100 | 6.836 | |||||
| 2026-01-29 | 13F | UBS Group AG | Call | 0 | -100,00 | 0 | -100,00 | |||
| 2026-04-07 | 13F | CoreCap Advisors, LLC | 4.503 | -17,66 | 381 | 100,00 | ||||
| 2026-02-17 | 13F | Northern Trust Corp | 526.928 | 3,77 | 18.369 | 39,51 | ||||
| 2026-04-08 | 13F | Oliver Luxxe Assets LLC | 17.928 | 1.517 | ||||||
| 2026-02-13 | 13F | SRS Capital Advisors, Inc. | 2 | -84,62 | 0 | |||||
| 2026-02-17 | 13F | Point72 Asset Management, L.P. | Call | 110.500 | 3.852 | |||||
| 2026-02-17 | 13F | Janus Henderson Group Plc | 24.155 | 0,00 | 842 | 34,56 | ||||
| 2026-02-10 | 13F | State of Wyoming | 4.598 | 160 | ||||||
| 2026-02-03 | 13F | F/M Investments LLC | 94.120 | 46,62 | 3.281 | 97,18 | ||||
| 2026-02-10 | 13F | Zweig-DiMenna Associates LLC | 78.500 | 2.737 | ||||||
| 2026-04-23 | 13F | SJS Investment Consulting Inc. | 450 | -10,00 | 38 | 123,53 | ||||
| 2026-02-12 | 13F | BlackRock, Inc. | 5.306.432 | 9,37 | 184.982 | 47,04 | ||||
| 2026-02-06 | 13F | CloudAlpha Capital Management Limited/Hong Kong | 0 | -100,00 | 0 | |||||
| 2026-02-09 | 13F | Royce & Associates Lp | 773.948 | -7,52 | 26.980 | 24,33 | ||||
| 2026-01-29 | 13F | Comerica Bank | 1.386 | 27,62 | 48 | 71,43 | ||||
| 2025-11-13 | 13F | Blueshift Asset Management, LLC | 0 | -100,00 | 0 | -100,00 | ||||
| 2026-02-10 | 13F | Envestnet Asset Management Inc | 13.839 | 53,00 | 482 | 105,98 | ||||
| 2026-04-13 | 13F | Gill Capital Partners, Llc | 25 | 2 | ||||||
| 2026-04-28 | 13F | SBI Securities Co., Ltd. | 5.619 | 191,59 | 475 | 608,96 | ||||
| 2026-02-09 | 13F | Roubaix Capital, LLC | 108.275 | 3.774 | ||||||
| 2026-02-11 | 13F | MCF Advisors LLC | 596 | 21 | ||||||
| 2026-04-22 | 13F | Princeton Global Asset Management LLC | 25 | 0,00 | 2 | |||||
| 2026-02-17 | 13F | Cetera Investment Advisers | 12.903 | -13,35 | 450 | 16,32 | ||||
| 2026-01-29 | 13F | WT Asset Management Ltd | 0 | -100,00 | 0 | -100,00 | ||||
| 2026-02-19 | 13F | Invesco Ltd. | 3.512.309 | 5.208,89 | 122.439 | 7.039,30 | ||||
| 2025-11-14 | 13F | Point72 Europe (London) LLP | 9.033 | 234 | ||||||
| 2026-02-17 | 13F | Point72 Asset Management, L.P. | 0 | -100,00 | 0 | |||||
| 2026-02-06 | 13F | Global Retirement Partners, LLC | 12 | 0 | ||||||
| 2026-02-13 | 13F | Citigroup Inc | 14.890 | -98,72 | 519 | -98,28 | ||||
| 2026-04-28 | 13F | Ariose Capital Management Ltd | 104.000 | 8.797 | ||||||
| 2026-04-22 | 13F | Sterling Capital Management LLC | 793 | -22,18 | 67 | 91,43 | ||||
| 2026-04-20 | 13F | Friedenthal Financial | 10 | 1 | ||||||
| 2026-02-13 | 13F | Citigroup Inc | Call | 130.000 | 4.532 | |||||
| 2026-04-16 | 13F | SG Americas Securities, LLC | 195.908 | 129,80 | 17 | 700,00 | ||||
| 2026-02-13 | 13F | Atika Capital Management LLC | 87.657 | 3.056 | ||||||
| 2026-02-13 | 13F | Police & Firemen's Retirement System of New Jersey | 16.073 | 3,58 | 560 | 39,30 | ||||
| 2026-04-24 | 13F | Private Advisor Group, LLC | 3.093 | 262 | ||||||
| 2025-11-14 | 13F | Credit Agricole S A | 0 | -100,00 | 0 | |||||
| 2026-04-21 | 13F | GFG Capital, LLC | 2.555 | 216 | ||||||
| 2026-02-13 | 13F | Barclays Plc | 235.704 | 4,40 | 8.217 | 40,35 | ||||
| 2026-02-17 | 13F | State Of Wisconsin Investment Board | 0 | -100,00 | 0 | |||||
| 2026-04-22 | 13F | Advocate Investing Services LLC | 125 | 11 | ||||||
| 2026-02-17 | 13F | Susquehanna International Group, Llp | Call | 1.262.100 | 91,34 | 43.997 | 157,24 | |||
| 2026-04-24 | 13F | Root Financial Partners, LLC | 8 | 1 | ||||||
| 2026-02-17 | 13F | California State Teachers Retirement System | 57.199 | 14,49 | 1.994 | 53,90 | ||||
| 2026-02-17 | 13F | Susquehanna International Group, Llp | 329.471 | -67,80 | 11.485 | -56,71 | ||||
| 2026-02-17 | 13F | Susquehanna International Group, Llp | Put | 2.401.100 | -29,66 | 83.702 | -5,43 | |||
| 2026-02-11 | 13F | Simplex Trading, Llc | Call | 78.100 | -56,66 | 2.723 | 67.950,00 | |||
| 2026-02-17 | 13F | Raymond James Financial Inc | 379.221 | 139,89 | 13.564 | 230,89 | ||||
| 2026-02-11 | 13F | Simplex Trading, Llc | Put | 515.100 | 67,02 | 17.956 | 256.414,29 | |||
| 2026-02-10 | 13F | Goldman Sachs Group Inc | 967.305 | -41,84 | 33.720 | -21,81 | ||||
| 2026-02-11 | 13F | Simplex Trading, Llc | 162.908 | 31,65 | 5.679 | 189.166,67 | ||||
| 2026-02-13 | 13F | Victory Capital Management Inc | 7.421 | 146,54 | 259 | 1.021,74 | ||||
| 2026-02-13 | 13F | Great West Life Assurance Co /can/ | 5.435 | -54,27 | 0 | |||||
| 2026-04-20 | 13F | Assenagon Asset Management S.A. | 48.762 | 4.125 | ||||||
| 2026-04-08 | 13F | Wealth Enhancement Advisory Services, Llc | 2.660 | 276 | ||||||
| 2026-02-17 | 13F | Oberweis Asset Management Inc/ | 2.039.641 | 8,03 | 71.102 | 45,23 | ||||
| 2026-02-17 | 13F | Royal Bank Of Canada | 5.883 | -97,68 | 205 | -96,89 | ||||
| 2026-02-12 | 13F | Jane Street Group, Llc | Call | 386.200 | -34,46 | 13.463 | -11,90 | |||
| 2026-02-12 | 13F | Jane Street Group, Llc | Put | 2.431.300 | 91,40 | 84.755 | 157,32 | |||
| 2025-11-14 | 13F | Marex Group plc | 0 | -100,00 | 0 | -100,00 | ||||
| 2026-02-12 | 13F | Jane Street Group, Llc | 1.682.894 | 4.312,76 | 58.666 | 5.837,75 | ||||
| 2026-04-06 | 13F | Versant Capital Management, Inc | 133 | 9,02 | 11 | 175,00 | ||||
| 2026-02-17 | 13F | Lazard Asset Management Llc | 9.881 | 344 | ||||||
| 2026-02-13 | 13F | Polymer Capital Management (HK) LTD | 0 | -100,00 | 0 | |||||
| 2025-11-12 | 13F | Quantbot Technologies LP | 0 | -100,00 | 0 | |||||
| 2025-11-13 | 13F | Eschler Asset Management LLP | 0 | -100,00 | 0 | -100,00 | ||||
| 2026-02-13 | 13F | Quarry LP | 74 | 54,17 | 3 | 100,00 | ||||
| 2026-02-17 | 13F | Scalar Gauge Management, Llc | 137.000 | 4.776 | ||||||
| 2026-02-05 | 13F | Gamco Investors, Inc. Et Al | 9.200 | -68,28 | 321 | -57,39 | ||||
| 2026-02-17 | 13F | Brevan Howard Capital Management LP | 6.178 | 215 | ||||||
| 2026-04-10 | 13F | Armstrong Advisory Group, Inc | 12 | 1 | ||||||
| 2026-01-22 | 13F | BOCHK Asset Management Ltd | 0 | -100,00 | 0 | -100,00 | ||||
| 2026-02-17 | 13F | Alliancebernstein L.p. | 59.012 | -0,27 | 2.057 | 34,09 | ||||
| 2026-04-23 | 13F | Dupree Financial Group, LLC | 8.179 | 692 | ||||||
| 2025-11-14 | 13F | Wolverine Trading, Llc | 40.561 | 348,98 | 1.052 | 345,76 | ||||
| 2025-11-14 | 13F | Wolverine Trading, Llc | Call | 205.800 | 41,64 | 5.338 | 40,14 | |||
| 2025-11-14 | 13F | Wolverine Trading, Llc | Put | 159.200 | 163,14 | 4.130 | 160,34 | |||
| 2026-02-17 | 13F | D. E. Shaw & Co., Inc. | Call | 635.900 | 64,06 | 22.167 | 120,57 | |||
| 2026-02-17 | 13F | D. E. Shaw & Co., Inc. | Put | 133.500 | -7,80 | 4.654 | 23,95 | |||
| 2026-02-17 | 13F | D. E. Shaw & Co., Inc. | 1.366.856 | 47.649 | ||||||
| 2026-02-17 | 13F | Ameriprise Financial Inc | 55.218 | -86,60 | 1.925 | -81,99 | ||||
| 2026-04-21 | 13F | Blue Jean Financial Llc | 44.039 | 3.725 | ||||||
| 2026-04-28 | 13F | Belpointe Asset Management LLC | 6.172 | 522 | ||||||
| 2026-02-17 | 13F | Persistent Asset Partners Ltd | 6.797 | 237 | ||||||
| 2026-04-23 | 13F | J.w. Cole Advisors, Inc. | 6.519 | 551 | ||||||
| 2026-01-16 | 13F | FNY Investment Advisers, LLC | 0 | -100,00 | 0 | |||||
| 2026-02-02 | 13F | Kornitzer Capital Management Inc /ks | 50.213 | -16,72 | 1.750 | 11,96 | ||||
| 2026-02-17 | 13F | Ardsley Advisory Partners Lp | Call | 0 | -100,00 | 0 | ||||
| 2026-02-17 | 13F | SummitTX Capital, L.P. | 7.293 | 254 | ||||||
| 2026-04-16 | 13F | REX Advisers, LLC | Put | 21.900 | 115 | |||||
| 2026-04-16 | 13F | REX Advisers, LLC | Call | 14.600 | 5 | |||||
| 2026-04-16 | 13F | REX Advisers, LLC | 7.300 | 618 | ||||||
| 2026-02-17 | 13F | Millennium Management Llc | 10.268 | 358 | ||||||
| 2026-04-24 | 13F | UMA Financial Services, Inc. | 38 | 100,00 | 3 | |||||
| 2026-01-30 | 13F | Rachor Investment Advisory Services, LLC | 39 | 1 | ||||||
| 2026-02-17 | 13F/A | Kovack Advisors, Inc. | 11.055 | 1,75 | 385 | 37,01 | ||||
| 2026-02-11 | 13F | Group One Trading, L.p. | Put | 485.100 | 41,97 | 16.911 | 90,86 | |||
| 2026-02-12 | 13F | StoneX Group Inc. | 7.465 | -51,23 | 260 | -34,34 | ||||
| 2026-02-11 | 13F | Group One Trading, L.p. | 160.726 | -16,72 | 5.603 | 11,95 | ||||
| 2026-02-11 | 13F | Group One Trading, L.p. | Call | 284.700 | 16,78 | 9.925 | 57,00 | |||
| 2026-02-11 | 13F | CenterBook Partners LP | 30.812 | 1.074 | ||||||
| 2026-02-17 | 13F | Citadel Advisors Llc | Put | 388.500 | -13,42 | 13.543 | 16,41 | |||
| 2026-02-17 | 13F | Citadel Advisors Llc | 551.297 | -15,67 | 19.218 | 13,37 | ||||
| 2026-02-17 | 13F | Citadel Advisors Llc | Call | 396.800 | 42,32 | 13.832 | 91,34 | |||
| 2026-02-17 | 13F | Two Sigma Investments, Lp | Put | 8.000 | 279 | |||||
| 2026-02-17 | 13F | Two Sigma Investments, Lp | 263.616 | -8,90 | 9.190 | 22,47 | ||||
| 2026-02-12 | 13F | Swiss National Bank | 116.800 | 12,96 | 4.072 | 51,85 | ||||
| 2026-02-12 | 13F | Skopos Labs, Inc. | 19.956 | 35.535,71 | 733 | |||||
| 2026-02-12 | 13F | Voya Investment Management Llc | 10.533 | 8,01 | 367 | 45,63 | ||||
| 2026-02-17 | 13F | Hood River Capital Management LLC | 1.275.621 | -19,04 | 44.468 | 8,84 | ||||
| 2026-04-14 | 13F | Opal Wealth Advisors, LLC | 335 | 28 | ||||||
| 2026-04-15 | 13F | Compagnie Lombard Odier SCmA | 530 | 45 | ||||||
| 2026-02-09 | 13F | Cypress Capital Management LLC (WY) | 50 | 0,00 | 2 | 0,00 | ||||
| 2026-02-10 | 13F/A | Northwestern Mutual Wealth Management Co | 1.200 | 166,67 | 42 | 272,73 | ||||
| 2026-02-17 | 13F | J. Goldman & Co LP | 0 | -100,00 | 0 | |||||
| 2025-11-10 | 13F | Axq Capital, Lp | 0 | -100,00 | 0 | -100,00 | ||||
| 2026-02-17 | 13F | XTX Topco Ltd | 24.771 | 167,56 | 864 | 259,58 | ||||
| 2026-01-29 | 13F | Vanguard Group Inc | 4.982.660 | 7,74 | 173.696 | 44,85 | ||||
| 2026-04-27 | 13F | Td Private Client Wealth Llc | 0 | -100,00 | 0 | |||||
| 2026-02-13 | 13F | Parkside Financial Bank & Trust | 35 | -37,50 | 1 | 0,00 | ||||
| 2026-02-13 | 13F | Rhumbline Advisers | 71.089 | -7,75 | 2.478 | 24,02 | ||||
| 2026-02-17 | 13F | Silvercrest Asset Management Group Llc | 266.272 | -20,09 | 9.282 | 7,43 | ||||
| 2026-04-16 | 13F | Thompson Davis & Co., Inc. | 3.659 | 310 | ||||||
| 2026-02-13 | 13F | Kennedy Capital Management, Inc. | 447.109 | 15.586 | ||||||
| 2026-02-13 | 13F | Sei Investments Co | 123.651 | 4.310 | ||||||
| 2026-04-27 | 13F | Leonteq Securities AG | 13.513 | 1.143 | ||||||
| 2026-02-12 | 13F | State Board Of Administration Of Florida Retirement System | 6.820 | 238 | ||||||
| 2026-01-28 | 13F | Geneos Wealth Management Inc. | 17.829 | 622 | ||||||
| 2026-02-13 | 13F | Charles Schwab Investment Management Inc | 528.343 | 9,76 | 18.418 | 47,57 | ||||
| 2026-02-06 | 13F | Pnc Financial Services Group, Inc. | 9.076 | 0,14 | 316 | 34,47 | ||||
| 2026-02-17 | 13F | Adage Capital Partners Gp, L.l.c. | 0 | -100,00 | 0 | |||||
| 2026-02-17 | 13F | Concentric Capital Strategies, LP | 46.021 | 1.604 | ||||||
| 2026-02-12 | 13F | Dimensional Fund Advisors Lp | 418.219 | -1,75 | 14.584 | 32,14 | ||||
| 2026-02-10 | 13F | Intech Investment Management Llc | 22.538 | -15,29 | 786 | 13,93 | ||||
| 2026-04-13 | 13F | E Fund Management Co., Ltd. | 0 | -100,00 | 0 | -100,00 | ||||
| 2026-02-17 | 13F | Quantinno Capital Management LP | 14.958 | 521 | ||||||
| 2026-04-06 | 13F | GAMMA Investing LLC | 1.883 | 12,02 | 159 | 174,14 | ||||
| 2026-02-02 | 13F | Chung Wu Investment Group, LLC | 21.910 | 4,33 | 774 | 42,10 | ||||
| 2025-11-12 | 13F | Neuberger Berman Group LLC | 0 | -100,00 | 0 | |||||
| 2026-01-15 | 13F | Nisa Investment Advisors, Llc | 660 | -31,39 | 23 | -4,17 | ||||
| 2026-02-11 | 13F | Inceptionr Llc | 10.855 | 12,14 | 378 | 50,60 | ||||
| 2026-02-13 | 13F | Morgan Stanley | 1.699.855 | 157,13 | 59.257 | 245,70 | ||||
| 2026-02-12 | 13F | Castleark Management Llc | 0 | -100,00 | 0 | |||||
| 2026-04-15 | 13F | Exchange Traded Concepts, Llc | 9.291 | 786 | ||||||
| 2026-04-27 | 13F | Y-Intercept (Hong Kong) Ltd | 0 | -100,00 | 0 | |||||
| 2026-02-09 | 13F | Emerald Mutual Fund Advisers Trust | 399.050 | 5,07 | 13.911 | 41,25 | ||||
| 2026-02-13 | 13F | Marshall Wace, Llp | Call | 0 | -100,00 | 0 | ||||
| 2026-02-17 | 13F | SageView Advisory Group, LLC | 3 | 0 | ||||||
| 2026-02-17 | 13F | Fmr Llc | 133.534 | 781,99 | 4.655 | 1.087,24 | ||||
| 2026-02-09 | 13F | Blue Bell Private Wealth Management, Llc | 400 | -42,45 | 14 | -27,78 | ||||
| 2026-02-13 | 13F | Marshall Wace, Llp | 0 | -100,00 | 0 | |||||
| 2026-02-17 | 13F | Jump Financial, LLC | 8.775 | 306 | ||||||
| 2026-04-13 | 13F | True Wealth Design, LLC | 18 | 0,00 | 2 | |||||
| 2026-01-21 | 13F | Pacific Point Advisors, LLC | 40.000 | 1.394 | ||||||
| 2026-02-13 | 13F | Walleye Capital LLC | Call | 65.900 | 6,12 | 2.297 | 42,67 | |||
| 2025-12-18 | 13F | Danske Bank A/s | 0 | -100,00 | 0 | |||||
| 2026-02-13 | 13F | Walleye Capital LLC | Put | 100.700 | 12,39 | 3.510 | 51,10 | |||
| 2026-02-13 | 13F | Walleye Capital LLC | 63.343 | 171,19 | 2.208 | 264,96 | ||||
| 2026-04-14 | 13F | Nbc Securities, Inc. | 1.579 | 134 | ||||||
| 2026-02-17 | 13F | Portolan Capital Management, LLC | 228.458 | -58,17 | 7.964 | -43,77 | ||||
| 2026-01-15 | 13F | Allspring Global Investments Holdings, LLC | 144.727 | -18,03 | 5.731 | 14,23 | ||||
| 2026-04-02 | 13F | Silverleafe Capital Partners, LLC | 3.208 | 271 | ||||||
| 2026-04-28 | 13F | Stratos Wealth Partners, LTD. | 5.678 | 480 | ||||||
| 2026-01-12 | 13F | Rialto Wealth Management, LLC | 40 | 0,00 | 1 | 0,00 | ||||
| 2026-02-13 | 13F | BNP Paribas Asset Management Holding S.A. | 733 | 61,10 | 0 | |||||
| 2026-02-17 | 13F | Balyasny Asset Management Llc | Call | 25.000 | 0,00 | 872 | 34,41 | |||
| 2026-02-06 | 13F | Gsa Capital Partners Llp | 26.737 | 5,26 | 1 | |||||
| 2026-02-17 | 13F | Balyasny Asset Management Llc | 166.364 | 1.594,31 | 5.799 | 2.183,07 | ||||
| 2026-02-13 | 13F | Caitong International Asset Management Co., Ltd | 419 | 15 | ||||||
| 2026-04-13 | 13F | Massmutual Trust Co Fsb/adv | 2 | 0 | ||||||
| 2026-04-24 | 13F | ProShare Advisors LLC | 9.584 | -13,20 | 811 | 110,94 | ||||
| 2026-01-30 | 13F | Us Bancorp \de\ | 126 | 0,00 | 4 | 33,33 | ||||
| 2026-04-16 | 13F | Capital Advisors, Ltd. LLC | 20 | 566,67 | 0 | |||||
| 2026-02-12 | 13F | New York State Common Retirement Fund | 315.039 | 7,83 | 10.982 | 44,98 | ||||
| 2026-04-13 | 13F | IFP Advisors, Inc | 2.123 | -56,54 | 180 | 5,29 | ||||
| 2026-01-26 | 13F | Cwm, Llc | 2.177 | 1,35 | 0 | |||||
| 2026-04-22 | 13F | Pictet Asset Management Holding SA | 10.307 | 30,02 | 872 | 215,58 | ||||
| 2025-11-05 | 13F | Bessemer Group Inc | 0 | -100,00 | 0 | |||||
| 2026-02-17 | 13F | LMR Partners LLP | 0 | -100,00 | 0 | |||||
| 2026-02-09 | 13F | Quest Partners LLC | 6.123 | -18,39 | 213 | 9,79 | ||||
| 2026-02-13 | 13F | Smartleaf Asset Management LLC | 57 | 46,15 | 2 | 100,00 | ||||
| 2026-01-30 | 13F | Archer Investment Corp | 275 | 0,00 | 10 | 28,57 | ||||
| 2026-02-13 | 13F | Wexford Capital Lp | 0 | -100,00 | 0 | |||||
| 2026-02-13 | 13F | Colony Group, LLC | 18.485 | 644 | ||||||
| 2026-04-15 | 13F | Seacrest Wealth Management, Llc | 22.145 | 308,20 | 1.873 | 809,22 | ||||
| 2026-02-10 | 13F | Skaana Management L.P. | Put | 7.200 | 0,00 | 251 | 34,41 | |||
| 2026-02-10 | 13F | Skaana Management L.P. | Call | 16.500 | 0,61 | 575 | 35,29 | |||
| 2026-01-28 | 13F | Arizona State Retirement System | 16.519 | 4,88 | 576 | 40,93 | ||||
| 2026-02-10 | 13F | Rothschild Investment Llc | 108 | -1,82 | 4 | 50,00 | ||||
| 2026-02-17 | 13F | Cinctive Capital Management LP | 30.743 | -0,33 | 1.072 | 34,04 | ||||
| 2026-02-12 | 13F | Steward Partners Investment Advisory, Llc | 366.417 | -0,35 | 12.773 | 33,97 | ||||
| 2026-02-12 | 13F | CIBC Private Wealth Group, LLC | 4.937 | 5.574,71 | 172 | 8.500,00 | ||||
| 2026-04-15 | 13F | Fortitude Family Office, LLC | 59 | 22,92 | 5 | 300,00 | ||||
| 2026-04-22 | 13F | 1492 Capital Management LLC | 125.136 | -42,06 | 10.585 | 40,59 | ||||
| 2026-02-17 | 13F | MIRAE ASSET GLOBAL ETFS HOLDINGS Ltd. | 28.051 | 11,60 | 978 | 50,08 | ||||
| 2025-11-12 | 13F | Headlands Technologies LLC | 0 | -100,00 | 0 | |||||
| 2026-01-29 | 13F | UBS Group AG | 951.065 | -4,08 | 33.154 | 28,96 | ||||
| 2026-02-17 | 13F | Tower Research Capital LLC (TRC) | 5.847 | 68,70 | 204 | 128,09 | ||||
| 2026-02-17 | 13F | Algert Global Llc | 82.092 | 0,41 | 3 | 0,00 | ||||
| 2026-02-17 | 13F | Guggenheim Capital Llc | 0 | -100,00 | 0 | |||||
| 2026-02-17 | 13F | Price T Rowe Associates Inc /md/ | 2.229.757 | 5.321,64 | 78 | 7.600,00 | ||||
| 2026-02-17 | 13F | Russell Investments Group, Ltd. | 69.978 | 39,92 | 2.439 | 88,19 | ||||
| 2026-02-11 | 13F | Modus Advisors, LLC | 290 | 10 | ||||||
| 2025-11-14 | 13F | Sherbrooke Park Advisers Llc | 0 | -100,00 | 0 | -100,00 | ||||
| 2026-02-17 | 13F | Sciencast Management LP | 7.127 | 248 | ||||||
| 2026-01-23 | 13F | Avion Wealth | 31 | 0 | ||||||
| 2026-02-13 | 13F | Pinpoint Asset Management (Singapore) Pte. Ltd. | 4.273 | 427.200,00 | 149 | |||||
| 2026-02-17 | 13F | Holocene Advisors, LP | 12.484 | 435 | ||||||
| 2026-02-17 | 13F | Quadrature Capital Ltd | 41.671 | 1.453 | ||||||
| 2026-04-07 | 13F | Signaturefd, Llc | 515 | 252,74 | 44 | 760,00 | ||||
| 2026-02-13 | 13F | Rice Hall James & Associates, Llc | 171.570 | -13,87 | 5.981 | 15,78 | ||||
| 2026-02-17 | 13F | Jain Global LLC | 100.731 | -42,07 | 3.511 | -22,12 | ||||
| 2026-02-23 | 13F | Virtu Financial LLC | 52.412 | -18,20 | 2 | 0,00 | ||||
| 2026-04-07 | 13F | Farther Finance Advisors, LLC | 656 | 3,14 | 57 | 154,55 | ||||
| 2026-04-27 | 13F | Nvwm, Llc | 40 | 3 | ||||||
| 2026-02-17 | 13F | Css Llc/il | Put | 33.800 | 0,00 | 1.178 | 34,47 | |||
| 2025-11-10 | 13F | China Universal Asset Management Co., Ltd. | 0 | -100,00 | 0 | |||||
| 2026-02-13 | 13F | Stifel Financial Corp | 20.267 | 37,92 | 707 | 85,30 | ||||
| 2026-01-23 | 13F | Oak Ridge Investments Llc | 45.854 | 1.598 | ||||||
| 2026-02-09 | 13F | Hartland & Co., LLC | 59 | 2 | ||||||
| 2026-04-09 | 13F | Brown Wealth Management, Llc | 5.159 | 436 | ||||||
| 2026-01-29 | 13F | IMC-Chicago, LLC | 203.249 | 218,37 | 7.085 | 328,10 | ||||
| 2026-02-10 | 13F | Bank of New York Mellon Corp | 162.181 | 5,16 | 5.654 | 41,36 | ||||
| 2026-01-29 | 13F | IMC-Chicago, LLC | Put | 403.500 | 29,16 | 14.066 | 73,65 | |||
| 2026-02-09 | 13F | White Pine Capital Llc | 34.776 | 184,33 | 1.212 | 282,33 | ||||
| 2026-01-29 | 13F | IMC-Chicago, LLC | Call | 349.400 | 7,01 | 12.180 | 43,87 | |||
| 2026-04-23 | 13F | Kohmann Bosshard Financial Services, LLC | 1.589 | 0,00 | 134 | 143,64 | ||||
| 2026-02-05 | 13F | Amalgamated Bank | 1.897 | 27,83 | 0 | |||||
| 2026-02-13 | 13F | First Trust Advisors Lp | 242.010 | 70,06 | 8.436 | 128,68 | ||||
| 2026-02-14 | 13F | Rockefeller Capital Management L.P. | 199 | -0,50 | 7 | 20,00 | ||||
| 2026-04-20 | 13F | Kestra Private Wealth Services, Llc | 0 | -100,00 | 0 | |||||
| 2026-02-13 | 13F | Squarepoint Ops LLC | Call | 0 | -100,00 | 0 | -100,00 | |||
| 2026-02-17 | 13F | Bank Of America Corp /de/ | 325.842 | -18,33 | 11.359 | 9,80 | ||||
| 2026-02-12 | 13F | MetLife Investment Management, LLC | 33.089 | 2,93 | 1.153 | 38,42 | ||||
| 2026-02-12 | 13F | Nuveen, LLC | 225.288 | 16,47 | 7.854 | 56,59 | ||||
| 2026-02-17 | 13F | Capital Fund Management S.a. | 44.164 | -81,70 | 1.540 | -75,41 | ||||
| 2026-04-24 | 13F | Strs Ohio | 5.600 | 474 | ||||||
| 2026-02-06 | 13F | FourThought Financial Partners, LLC | 10.539 | 367 | ||||||
| 2026-02-05 | 13F | Allworth Financial LP | 769 | 1.923,68 | 27 | |||||
| 2026-02-13 | 13F | Verition Fund Management LLC | 87.312 | 267,97 | 3.044 | 394,80 | ||||
| 2026-01-27 | 13F | Zurcher Kantonalbank (Zurich Cantonalbank) | 13.685 | 49,92 | 477 | 102,12 | ||||
| 2026-02-13 | 13F | Squarepoint Ops LLC | Put | 0 | -100,00 | 0 | -100,00 | |||
| 2026-02-18 | 13F | GWM Advisors LLC | 0 | -100,00 | 0 | |||||
| 2026-02-17 | 13F | Advisor Group Holdings, Inc. | 1.609 | -67,59 | 56 | -53,33 | ||||
| 2026-04-07 | 13F | Carolina Wealth Advisors, LLC | 35 | 3 | ||||||
| 2026-02-13 | 13F | Ubs Asset Management Americas Inc | 93.485 | 56,96 | 3.259 | 111,01 | ||||
| 2026-02-17 | 13F | Aqr Capital Management Llc | 26.494 | 20,92 | 924 | 62,50 | ||||
| 2026-02-13 | 13F | Kilter Group LLC | 0 | -100,00 | 0 | |||||
| 2026-02-05 | 13F | Cambridge Investment Research Advisors, Inc. | 30.475 | 50,23 | 1 | |||||
| 2026-02-17 | 13F | Ardsley Advisory Partners Lp | 25.000 | -93,14 | 872 | -90,89 | ||||
| 2026-02-12 | 13F | Commonwealth Equity Services, Llc | 80.964 | 2.822 | ||||||
| 2026-02-17 | 13F | EFG International AG | 500 | 17 | ||||||
| 2026-02-17 | 13F | Nomura Holdings Inc | 13.833 | 482 | ||||||
| 2026-04-14 | 13F | Jeppson Wealth Management, Llc | 3.604 | 305 | ||||||
| 2026-02-13 | 13F | Manufacturers Life Insurance Company, The | 30.977 | 11,50 | 1.080 | 49,86 | ||||
| 2026-02-17 | 13F | Tudor Investment Corp Et Al | Put | 24.400 | 851 | |||||
| 2026-02-17 | 13F | Dark Forest Capital Management Lp | 63.183 | 157,69 | 2.203 | 250,08 | ||||
| 2026-02-17 | 13F | Tudor Investment Corp Et Al | 95.133 | -78,81 | 3.316 | -71,51 | ||||
| 2026-02-17 | 13F | Optiver Holding B.V. | 2.370 | 562,01 | 83 | 811,11 |