Grundlæggende statistik
| Institutionelle aktier (lange) | 524.398.906 - 58,08% (ex 13D/G) - change of -114,65MM shares -17,94% MRQ |
| Institutionel værdi (lang) | $ 1.139.509 USD ($1000) |
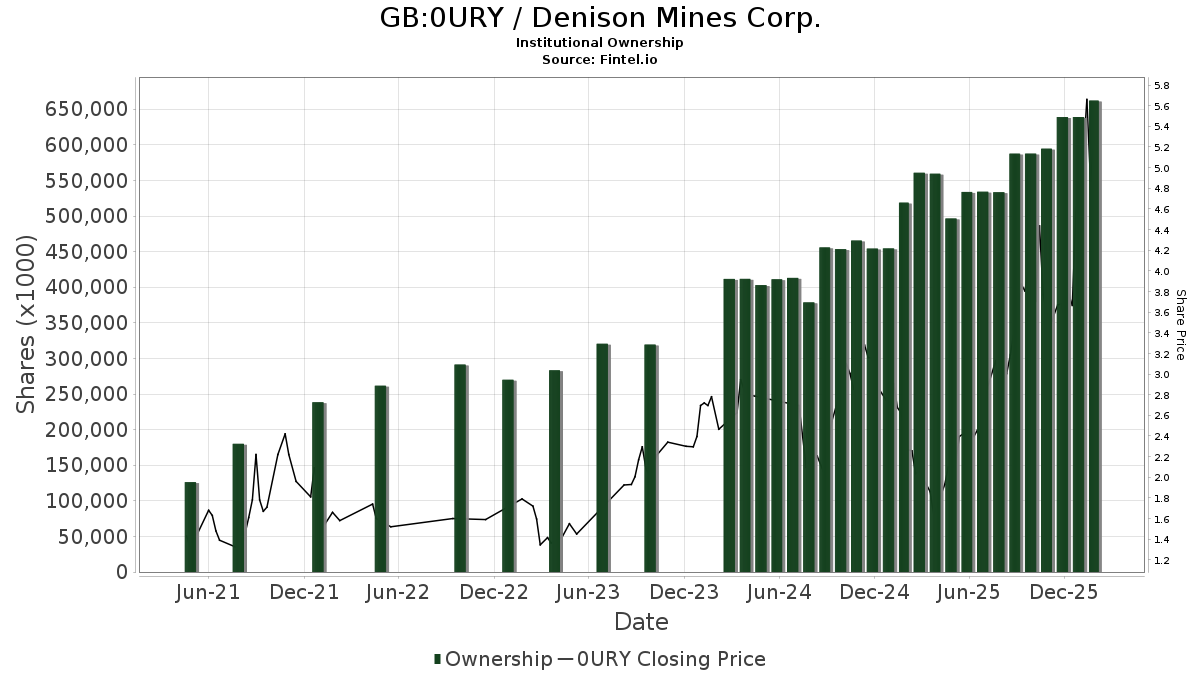
Institutionelt ejerskab og aktionærer
Denison Mines Corp. (GB:0URY) har 312 institutionelle ejere og aktionærer, der har indsendt 13D/G- eller 13F-formularer til Securities Exchange Commission (SEC). Disse institutioner har i alt 524,398,906 aktier. Største aktionærer omfatter Van Eck Associates Corp, MIRAE ASSET GLOBAL ETFS HOLDINGS Ltd., URA - Global X Uranium ETF, Alps Advisors Inc, Hood River Capital Management LLC, Vanguard Group Inc, UBS Group AG, Two Sigma Investments, Lp, Jane Street Group, Llc, and Toronto Dominion Bank .
Denison Mines Corp. (LSE:0URY) institutionel ejerskabsstruktur viser aktuelle positioner i virksomheden efter institutioner og fonde, samt seneste ændringer i positionsstørrelse. Større aktionærer kan omfatte individuelle investorer, investeringsforeninger, hedgefonde eller institutioner. Skema 13D angiver, at investoren besidder (eller besidder) mere end 5 % af virksomheden og har til hensigt (eller har til hensigt at) aktivt at forfølge en ændring i forretningsstrategi. Skema 13G indikerer en passiv investering på over 5%.
The share price as of March 13, 2026 is 5,24 / share. Previously, on March 17, 2025, the share price was 2,04 / share. This represents an increase of 157,49% over that period.
Fondens stemningsscore
Fund Sentiment Score (fka Ownership Accumulation Score) finder de aktier, der bliver mest købt af fonde. Det er resultatet af en sofistikeret, multi-faktor kvantitativ model, der identificerer virksomheder med de højeste niveauer af institutionel akkumulering. Scoringsmodellen bruger en kombination af den samlede stigning i oplyste ejere, ændringerne i porteføljeallokeringer i disse ejere og andre målinger. Tallet går fra 0 til 100, hvor højere tal indikerer et højere niveau af akkumulering for sine jævnaldrende, og 50 er gennemsnittet.
Opdateringsfrekvens: Dagligt
Se Ownership Explorer, som giver en liste over højest rangerende virksomheder.
AI+ Ask Fintel’s AI assistant about Denison Mines Corp..
Select a question to share a public post with an AI-crafted answer.
Thinking of good questions…
13F og NPORT arkivering
Detaljer om 13F-arkivering er gratis. Detaljer om NP-ansøgninger kræver et premium-medlemskab. Grønne rækker angiver nye positioner. Røde rækker angiver lukkede positioner. Klik på linket ikon for at se den fulde transaktionshistorik.
Opgrader
for at låse premium-data op og eksportere til Excel ![]() .
.
| Fil dato | Kilde | Investor | Type | Gennemsnitlig pris (Øst) |
Aktier | Δ Aktier (%) |
Rapporteret Værdi ($1000) |
Δ Værdi (%) |
Port Alloc (%) |
|
|---|---|---|---|---|---|---|---|---|---|---|
| 2026-01-21 | 13F | Sowell Financial Services LLC | 22.226 | 9,64 | 59 | 7,27 | ||||
| 2026-02-11 | 13F | Total Wealth Planning & Management, Inc. | Call | 5.000 | 0,00 | 18 | 50,00 | |||
| 2025-11-13 | 13F | Total Investment Management Inc | 0 | -100,00 | 0 | |||||
| 2026-01-12 | 13F | DAVENPORT & Co LLC | 5.904.750 | -17,10 | 15.707 | -19,82 | ||||
| 2026-02-06 | 13F | HighTower Advisors, LLC | 253.994 | 190,84 | 676 | 181,25 | ||||
| 2026-02-11 | 13F | Total Wealth Planning & Management, Inc. | 22.300 | -7,47 | 59 | 37,21 | ||||
| 2026-02-17 | 13F | Massar Capital Management, LP | 0 | -100,00 | 0 | -100,00 | ||||
| 2026-02-12 | 13F | Bank Of Montreal /can/ | Put | 11.400 | 0,00 | 30 | -3,23 | |||
| 2026-02-17 | 13F | Clear Street Markets Llc | Call | 50.000 | 133 | |||||
| 2025-11-12 | 13F | Group One Trading, L.p. | 0 | -100,00 | 0 | -100,00 | ||||
| 2026-02-12 | 13F | Bank Of Montreal /can/ | 3.064.615 | 3,15 | 8.128 | -0,57 | ||||
| 2026-02-17 | 13F | Ninepoint Partners LP | 190.000 | 0,00 | 505 | -3,26 | ||||
| 2026-01-23 | 13F | Farther Finance Advisors, LLC | Call | 20.000 | 0,00 | 53 | -3,64 | |||
| 2026-01-23 | 13F | Farther Finance Advisors, LLC | 10.384 | -21,12 | 28 | -25,00 | ||||
| 2025-11-14 | 13F | ExodusPoint Capital Management, LP | 0 | -100,00 | 0 | |||||
| 2026-02-18 | 13F | Vident Advisory, LLC | 7.116.369 | -22,28 | 18.930 | -24,82 | ||||
| 2026-01-13 | 13F | CoreCap Advisors, LLC | 12.438 | 0,00 | 33 | -2,94 | ||||
| 2026-01-23 | 13F | Stonehaven Wealth & Tax Solutions, Llc | 37.883 | 101 | ||||||
| 2026-02-12 | 13F | Northwest & Ethical Investments L.P. | 103.269 | 41,68 | 274 | 36,50 | ||||
| 2025-10-02 | 13F/A | Mirabella Financial Services Llp | 350.000 | 455 | ||||||
| 2026-03-03 | 13F/A | Caitong International Asset Management Co., Ltd | 16.278 | 79,35 | 43 | 79,17 | ||||
| 2026-01-12 | 13F | Rialto Wealth Management, LLC | 6.000 | 0,00 | 16 | -6,25 | ||||
| 2026-02-10 | 13F | JTC Employer Solutions Trusteee Ltd | 0 | -100,00 | 0 | |||||
| 2026-02-10 | 13F | Goldman Sachs Group Inc | 1.214.429 | -62,66 | 3.230 | -63,88 | ||||
| 2026-01-15 | 13F | Refined Wealth Management | 10.850 | 0,00 | 29 | -3,45 | ||||
| 2026-01-29 | 13F | Pictet Asset Management Holding SA | 168.304 | 8,76 | 447 | 4,94 | ||||
| 2026-02-17 | 13F | Millennium Management Llc | 2.250.953 | -54,87 | 5.987 | -56,35 | ||||
| 2026-02-17 | 13F | Scopus Asset Management, L.p. | 7.511.802 | 0,00 | 19.923 | -3,60 | ||||
| 2025-11-13 | 13F | Triton Wealth Management, PLLC | 0 | -100,00 | 0 | |||||
| 2026-02-09 | 13F | SLT Holdings LLC | Call | 35.000 | 93 | |||||
| 2026-01-29 | 13F | Atlas Legacy Advisors, LLC | Call | 15.000 | 40 | |||||
| 2025-09-26 | NP | PDAVX - PineBridge Dynamic Asset Allocation Fund Investor Servicing Shares | 24.312 | -36,18 | 50 | -27,54 | ||||
| 2026-02-05 | 13F | Allworth Financial LP | 2.447 | 0,95 | 7 | 0,00 | ||||
| 2026-02-13 | 13F | Mml Investors Services, Llc | 64.689 | 172 | ||||||
| 2026-02-10 | 13F/A | Northwestern Mutual Wealth Management Co | 8 | -20,00 | 0 | |||||
| 2026-02-13 | 13F | Aptus Capital Advisors, LLC | 37.000 | 0,00 | 98 | -2,97 | ||||
| 2026-02-17 | 13F | SummitTX Capital, L.P. | 937.858 | -49,97 | 2.495 | -51,62 | ||||
| 2026-02-17 | 13F | Investment Management Corp of Ontario | 102.264 | 232,36 | 272 | 223,81 | ||||
| 2026-02-17 | 13F | State Of Wisconsin Investment Board | 23.004 | 61 | ||||||
| 2026-02-13 | 13F | L1 Capital Pty Ltd | 0 | -100,00 | 0 | -100,00 | ||||
| 2026-02-12 | 13F | Sprott Inc. | 1.096.261 | 30,37 | 2.916 | 26,12 | ||||
| 2026-02-13 | 13F | Bay Colony Advisory Group, Inc d/b/a Bay Colony Advisors | 10.502 | 0,00 | 28 | -3,57 | ||||
| 2026-02-17 | 13F | Integrity Wealth Advisors, Inc. | 59.700 | 0,00 | 217 | 32,32 | ||||
| 2026-02-13 | 13F | Atlas Capital Advisors Llc | 50 | 0 | ||||||
| 2026-02-17 | 13F | Interval Partners, LP | 183.574 | -15,33 | 488 | -18,12 | ||||
| 2025-11-13 | 13F | Formula Growth Ltd | 0 | -100,00 | 0 | |||||
| 2025-09-25 | NP | VT - Vanguard Total World Stock Index Fund ETF Shares | 41.368 | 85 | ||||||
| 2026-02-13 | 13F | Kestra Advisory Services, LLC | 8.670 | 23 | ||||||
| 2026-02-06 | 13F | Larson Financial Group LLC | 12.849 | 0,00 | 34 | -2,86 | ||||
| 2026-02-17 | 13F | Brevan Howard Capital Management LP | 0 | -100,00 | 0 | -100,00 | ||||
| 2026-02-09 | 13F | Prospera Financial Services Inc | 12.650 | 34 | ||||||
| 2026-02-13 | 13F | Toroso Investments, LLC | 374.990 | 1.041,07 | 997 | 1.007,78 | ||||
| 2026-02-17 | 13F | Advisor Group Holdings, Inc. | 91.887 | 9,99 | 244 | 17,87 | ||||
| 2026-02-17 | 13F | Susquehanna International Group, Llp | Call | 4.506.500 | 489,32 | 11.987 | 470,27 | |||
| 2026-02-06 | 13F | Pnc Financial Services Group, Inc. | 29.000 | 0,00 | 77 | -2,53 | ||||
| 2026-02-13 | 13F | De Lisle Partners LLP | 3.137.909 | 3,29 | 8.347 | -0,10 | ||||
| 2026-01-29 | 13F | UMA Financial Services, Inc. | 327 | 133,57 | 1 | |||||
| 2026-02-12 | 13F | Cibc World Markets Corp | Call | 70.000 | 186 | |||||
| 2026-02-13 | 13F | Level Four Advisory Services, Llc | 21.735 | -0,21 | 58 | -3,39 | ||||
| 2026-01-20 | 13F | AdvisorNet Financial, Inc | 6.202 | -13,89 | 16 | -15,79 | ||||
| 2026-02-11 | 13F | LPL Financial LLC | 108.206 | -28,57 | 288 | -31,01 | ||||
| 2026-02-13 | 13F/A | Impala Asset Management LLC | 0 | -100,00 | 0 | |||||
| 2026-02-17 | 13F | Guggenheim Capital Llc | 56.083 | -92,95 | 149 | -84,89 | ||||
| 2026-02-17 | 13F | Russell Investments Group, Ltd. | 122.040 | -83,06 | 324 | -83,66 | ||||
| 2026-02-03 | 13F | International Assets Investment Management, Llc | 12.500 | 33 | ||||||
| 2026-02-12 | 13F | Dimensional Fund Advisors Lp | 0 | -100,00 | 0 | -100,00 | ||||
| 2026-02-09 | 13F | Jefferies Financial Group Inc. | 14.400 | 10,77 | 38 | 8,57 | ||||
| 2026-02-09 | 13F | Harbour Investments, Inc. | 3.380 | 0,00 | 9 | -11,11 | ||||
| 2026-02-17 | 13F | Susquehanna International Group, Llp | 1.945.351 | -60,48 | 5.175 | -61,78 | ||||
| 2026-02-17 | 13F | Susquehanna International Group, Llp | Put | 1.489.500 | 65,67 | 3.962 | 60,28 | |||
| 2026-02-03 | 13F | SBI Securities Co., Ltd. | 6.537 | -58,24 | 17 | -60,47 | ||||
| 2026-02-13 | 13F | Wexford Capital Lp | 30.101 | -79,82 | 80 | -80,73 | ||||
| 2026-02-02 | 13F | Triasima Portfolio Management inc. | 719.434 | 27,04 | 1.910 | 22,59 | ||||
| 2026-02-11 | 13F | Nemes Rush Group LLC | 500 | 0,00 | 1 | 0,00 | ||||
| 2026-02-12 | 13F | Renaissance Technologies Llc | 2.521.313 | -80,85 | 6.707 | -81,48 | ||||
| 2025-09-25 | NP | DFA INVESTMENT TRUST CO - The Canadian Small Company Series This fund is a listed as child fund of Dimensional Fund Advisors Lp and if that institution has disclosed ownership in this security, then these positions will not be double counted when calculating total shares and total value | 963.533 | -34,97 | 1.982 | -6,91 | ||||
| 2026-02-11 | 13F | J.w. Cole Advisors, Inc. | 197.990 | 148,33 | 524 | 138,81 | ||||
| 2026-02-18 | 13F | First Citizens Bank & Trust Co | 10.000 | 27 | ||||||
| 2026-02-17 | 13F | Prelude Capital Management, Llc | 10.865 | -86,27 | 29 | -87,10 | ||||
| 2026-02-17 | 13F | Merewether Investment Management, LP | 5.903.300 | -13,44 | 15.703 | -16,27 | ||||
| 2026-02-10 | 13F | KERR FINANCIAL PLANNING Corp | 10.000 | 0,00 | 35 | 41,67 | ||||
| 2026-02-06 | 13F | Kimelman & Baird, LLC | 517 | 0,00 | 1 | 0,00 | ||||
| 2026-02-10 | 13F | Quantbot Technologies LP | 75.464 | 201 | ||||||
| 2026-02-13 | 13F | Dynamic Technology Lab Private Ltd | 0 | -100,00 | 0 | -100,00 | ||||
| 2025-11-14 | 13F | Colony Group, LLC | 0 | -100,00 | 0 | -100,00 | ||||
| 2026-02-10 | 13F | Meramec Financial Planners, LLC | 27 | 0 | ||||||
| 2026-02-09 | 13F | GeoSphere Capital Management | 1.400.000 | -17,65 | 3.724 | -20,34 | ||||
| 2025-09-25 | NP | DFAI - Dimensional International Core Equity Market ETF | 60.776 | 0,00 | 125 | 43,68 | ||||
| 2026-01-05 | 13F | Park Avenue Securities Llc | 17.068 | 26,10 | 0 | |||||
| 2026-02-17 | 13F | Bank Of America Corp /de/ | 983.061 | 36,61 | 2.615 | 32,15 | ||||
| 2026-02-10 | 13F | Deuterium Capital Management, LLC | 120.243 | 0,00 | 320 | -3,33 | ||||
| 2026-02-13 | 13F | Falcon Edge Capital, LP | 837.316 | 1,98 | 2.227 | -1,33 | ||||
| 2026-02-23 | 13F | Virtu Financial LLC | 0 | -100,00 | 0 | -100,00 | ||||
| 2026-02-17 | 13F | Quadrature Capital Ltd | 667.286 | 1.775 | ||||||
| 2026-02-13 | 13F | Healthcare Of Ontario Pension Plan Trust Fund | 426.452 | 1.134 | ||||||
| 2026-02-12 | 13F | Nuveen, LLC | 674.581 | 0,00 | 1.791 | -3,50 | ||||
| 2026-02-03 | 13F | We Are One Seven, LLC | 102.205 | 5,93 | 272 | 2,26 | ||||
| 2026-02-17 | 13F | XTX Topco Ltd | 143.219 | -73,21 | 381 | -74,15 | ||||
| 2026-02-05 | 13F/A | Fulcrum Asset Management LLP | 66.311 | -16,98 | 176 | -20,09 | ||||
| 2026-02-17 | 13F | MIRAE ASSET GLOBAL ETFS HOLDINGS Ltd. | 58.863.439 | 12,48 | 156.311 | 8,51 | ||||
| 2026-02-06 | 13F | GPS Wealth Strategies Group, LLC | 0 | -100,00 | 0 | |||||
| 2025-11-14 | 13F | Point72 (DIFC) Ltd | 20.558 | 57 | ||||||
| 2026-02-13 | 13F | Stifel Financial Corp | 291.231 | -1,02 | 775 | -4,33 | ||||
| 2026-02-12 | 13F | Scotia Capital Inc. | 809.478 | 0,40 | 2.148 | -3,02 | ||||
| 2026-01-16 | 13F | Crewe Advisors LLC | 28 | 0 | ||||||
| 2026-02-10 | 13F | Bank of New York Mellon Corp | 18.467 | -0,52 | 49 | -3,92 | ||||
| 2026-02-04 | 13F | Pensionmark Financial Group, Llc | 21.110 | 111,10 | 40 | 44,44 | ||||
| 2025-09-25 | NP | AMTAX - AB All Market Real Return Portfolio Class A | 206.158 | -18,83 | 424 | 16,48 | ||||
| 2026-02-17 | 13F | Balyasny Asset Management Llc | 1.856.293 | 4.938 | ||||||
| 2025-11-14 | 13F | Cubist Systematic Strategies, LLC | 555.553 | 1.528 | ||||||
| 2026-01-29 | 13F | Sanctuary Advisors, LLC | 50.847 | 135 | ||||||
| 2026-01-14 | 13F | ORG Wealth Partners, LLC | 0 | -100,00 | 0 | |||||
| 2026-02-12 | 13F | Swiss National Bank | 1.775.700 | 1,31 | 4.719 | -2,22 | ||||
| 2026-01-29 | 13F | IMC-Chicago, LLC | 397.855 | 35,03 | 1.058 | 30,62 | ||||
| 2025-11-14 | 13F | Ubs Asset Management Americas Inc | 0 | -100,00 | 0 | |||||
| 2026-01-29 | 13F | IMC-Chicago, LLC | Put | 427.600 | 38,97 | 1.137 | 34,40 | |||
| 2026-01-29 | 13F | IMC-Chicago, LLC | Call | 220.500 | 43,09 | 587 | 38,53 | |||
| 2026-02-17 | 13F | Cinctive Capital Management LP | 994.608 | 2.646 | ||||||
| 2026-02-17 | 13F | Family Management Corp | 16.636 | 44 | ||||||
| 2026-02-06 | 13F | Advisory Alpha, LLC | 13.537 | -55,54 | 36 | -57,14 | ||||
| 2026-02-13 | 13F | BRITISH COLUMBIA INVESTMENT MANAGEMENT Corp | 442.960 | -8,81 | 1.175 | -12,13 | ||||
| 2026-02-11 | 13F | Jpmorgan Chase & Co | 1.107.266 | 0,42 | 2.945 | -2,87 | ||||
| 2025-10-23 | 13F | Canton Hathaway, LLC | 0 | -100,00 | 0 | |||||
| 2026-02-13 | 13F | Aigen Investment Management, Lp | 54.077 | 144 | ||||||
| 2026-02-13 | 13F | Blueshift Asset Management, LLC | 0 | -100,00 | 0 | |||||
| 2026-01-28 | 13F | Geneos Wealth Management Inc. | 2.500 | 400,00 | 7 | |||||
| 2026-02-13 | 13F | Wells Fargo & Company/mn | Call | 50.000 | 133 | |||||
| 2026-02-17 | 13F | Old West Investment Management, LLC | 715.979 | 1,31 | 1.905 | -2,01 | ||||
| 2026-02-13 | 13F | Morgan Stanley | 9.770.298 | 30,63 | 25.989 | 26,35 | ||||
| 2026-02-13 | 13F | Vontobel Holding Ltd. | 117.502 | -3,74 | 312 | -7,16 | ||||
| 2026-02-13 | 13F | Wells Fargo & Company/mn | 1.149.314 | -18,07 | 3.057 | -20,74 | ||||
| 2026-02-13 | 13F | Beutel, Goodman & Co Ltd. | 3.787.059 | -8,66 | 10 | -9,09 | ||||
| 2026-02-09 | 13F | Summitry Llc | 10.000 | 27 | ||||||
| 2026-02-17 | 13F | SPWM Advisors LLC | 20.010 | 53 | ||||||
| 2026-02-13 | 13F | Evelyn Partners Investment Management Services Ltd | 3.563 | 0,00 | 9 | 0,00 | ||||
| 2026-02-17 | 13F | Royal Bank Of Canada | 5.821.316 | -38,80 | 15.485 | -40,80 | ||||
| 2026-01-20 | 13F | Wall Street Access Asset Management, LLC | 7.502 | 38,31 | 20 | 35,71 | ||||
| 2026-02-10 | 13F | Continuum Advisory, LLC | 34.141 | 0,00 | 91 | -3,23 | ||||
| 2026-02-13 | 13F | Aire Advisors, Llc | 0 | -100,00 | 0 | |||||
| 2026-02-13 | 13F | Sei Investments Co | 72.277 | 106,22 | 192 | 100,00 | ||||
| 2026-02-12 | 13F | IFC & Insurance Marketing, Inc. | 3.310 | 0 | ||||||
| 2026-01-26 | 13F | Welch Group, LLC | 0 | -100,00 | 0 | -100,00 | ||||
| 2026-02-17 | 13F | Scientech Research LLC | 29.798 | -70,20 | 79 | -71,27 | ||||
| 2026-02-09 | 13F | Legal & General Group Plc | 938.045 | -1,70 | 2.491 | -5,18 | ||||
| 2026-02-12 | 13F | Commonwealth Equity Services, Llc | 19.677 | -17,20 | 52 | |||||
| 2026-02-17 | 13F | Moore Capital Management, Lp | 0 | -100,00 | 0 | |||||
| 2026-02-10 | 13F | PCJ Investment Counsel Ltd. | 2.918.810 | 42,71 | 7.741 | 37,55 | ||||
| 2026-02-17 | 13F | Signature Equity Partners, LLC | 762 | 2 | ||||||
| 2025-11-14 | 13F | Gotham Asset Management, LLC | 0 | -100,00 | 0 | -100,00 | ||||
| 2026-02-12 | 13F | StoneX Group Inc. | 12.073 | -14,06 | 32 | -15,79 | ||||
| 2026-01-14 | 13F | Hennion & Walsh Asset Management, Inc. | 646.370 | 55,38 | 1.719 | 50,26 | ||||
| 2026-02-13 | 13F | SRS Capital Advisors, Inc. | 3.126 | -21,85 | 8 | -27,27 | ||||
| 2026-02-19 | 13F/A | Axxcess Wealth Management, Llc | Call | 4 | ||||||
| 2025-11-14 | 13F | Financial Advisors Network, Inc. | 17.425 | 0,00 | 48 | 51,61 | ||||
| 2026-02-05 | 13F | Bessemer Group Inc | 2.526 | 0 | ||||||
| 2026-02-11 | 13F | Deutsche Bank Ag\ | 1.778.380 | -25,43 | 4.730 | -27,87 | ||||
| 2026-02-17 | 13F | Raymond James Financial Inc | 216.727 | 234,35 | 576 | 223,60 | ||||
| 2026-02-13 | 13F | Bridgewater Associates, LP | 1.469.470 | -50,43 | 3.909 | -52,06 | ||||
| 2026-02-13 | 13F | Silicon Valley Capital Partners | 50 | 0 | ||||||
| 2026-02-03 | 13F | Emerald Investment Partners, Llc | 16.000 | 28,00 | 43 | 23,53 | ||||
| 2026-01-21 | 13F | Sound Income Strategies, LLC | 5.400 | 0,00 | 20 | 26,67 | ||||
| 2025-09-25 | NP | DFA INVESTMENT DIMENSIONS GROUP INC - International Vector Equity Portfolio Shares | 174.739 | 0,00 | 359 | 43,60 | ||||
| 2025-11-24 | 13F/A | Fulcrum Asset Management LLP | Put | 0 | -100,00 | 0 | -100,00 | |||
| 2025-11-14 | 13F | Wolverine Trading, Llc | 269.057 | 487,69 | 751 | 825,93 | ||||
| 2025-11-14 | 13F | Wolverine Trading, Llc | Call | 321.500 | 14,49 | 897 | 78,49 | |||
| 2026-01-27 | 13F | Zurcher Kantonalbank (Zurich Cantonalbank) | 307.438 | 22,10 | 816 | 17,75 | ||||
| 2025-11-14 | 13F | Wolverine Trading, Llc | Put | 122.600 | 63,90 | 342 | 157,14 | |||
| 2026-02-13 | 13F | Rhumbline Advisers | 26 | 0,00 | 0 | |||||
| 2026-02-02 | 13F | Wolverine Asset Management Llc | Put | 1.187.900 | 0,00 | 3.160 | -3,28 | |||
| 2026-02-11 | 13F | Simplex Trading, Llc | Put | 284.000 | 39,49 | 755 | ||||
| 2026-01-30 | 13F | R Squared Ltd | 15.801 | -36,33 | 42 | -38,24 | ||||
| 2026-02-11 | 13F | Simplex Trading, Llc | Call | 2.080.700 | 81,80 | 5.535 | 184.366,67 | |||
| 2026-02-11 | 13F | Group One Trading, L.p. | Call | 3.046.600 | 9,44 | 8.104 | 5,85 | |||
| 2026-02-13 | 13F | Walleye Capital LLC | Put | 54.200 | 144 | |||||
| 2026-02-11 | 13F | Group One Trading, L.p. | Put | 411.400 | -19,21 | 1.094 | -21,86 | |||
| 2026-02-13 | 13F | Walleye Capital LLC | 198.442 | 528 | ||||||
| 2026-02-13 | 13F | Charles Schwab Investment Management Inc | 1.219.361 | 82,11 | 3.238 | 75,64 | ||||
| 2026-02-11 | 13F | Franklin Resources Inc | 32.487 | 87,61 | 86 | 82,98 | ||||
| 2026-02-13 | 13F | Walleye Capital LLC | Call | 49.600 | 132 | |||||
| 2026-02-13 | 13F | Flow Traders U.s. Llc | 97.995 | 49,18 | 0 | |||||
| 2026-02-17 | 13F | Jump Financial, LLC | 30.480 | 81 | ||||||
| 2026-02-10 | 13F | Lido Advisors, LLC | 19.000 | 0,00 | 52 | 0,00 | ||||
| 2026-02-17 | 13F | Elequin Capital Lp | 1.637 | 4 | ||||||
| 2026-02-17 | 13F | Advisory Services Network, LLC | 13.700 | -20,35 | 36 | -23,40 | ||||
| 2026-03-02 | 13F | Sankala Group LLC | 7.500 | 31 | ||||||
| 2026-02-13 | 13F | Centiva Capital, LP | 32.444 | 86 | ||||||
| 2026-02-17 | 13F | Two Sigma Securities, Llc | 27.282 | -90,45 | 73 | -90,83 | ||||
| 2026-02-17 | 13F | Cantor Fitzgerald, L. P. | 0 | -100,00 | 0 | -100,00 | ||||
| 2026-02-05 | 13F | Integrated Investment Consultants, LLC | 15.000 | 0,00 | 40 | -4,88 | ||||
| 2026-02-10 | 13F | Bnp Paribas Arbitrage, Sa | 4.852.968 | 218,38 | 12.909 | 207,99 | ||||
| 2026-01-16 | 13F | Heck Capital Advisors, LLC | 19.201 | 51 | ||||||
| 2025-09-24 | NP | IDEV - iShares Core MSCI International Developed Markets ETF | 1.079.234 | -0,14 | 2.220 | 42,98 | ||||
| 2025-10-31 | 13F | National Asset Management, Inc. | 0 | -100,00 | 0 | |||||
| 2026-02-13 | 13F | Goehring & Rozencwajg Associates, LLC | 3.952.752 | 5,32 | 10.514 | 1,87 | ||||
| 2026-02-17 | 13F | Cetera Investment Advisers | 942.610 | 12,51 | 2.507 | 8,81 | ||||
| 2026-02-13 | 13F | Fortitude Advisory Group L.L.C. | 75.000 | 200 | ||||||
| 2026-01-06 | 13F | Afg Fiduciary Services Limited Partnership | 15.000 | 0,00 | 45 | 9,76 | ||||
| 2026-02-10 | 13F | Td Asset Management Inc | 8.608.043 | 17,75 | 22.858 | 13,60 | ||||
| 2026-02-20 | 13F | Kovitz Investment Group Partners, LLC | 0 | -100,00 | 0 | |||||
| 2025-11-14 | 13F | Mangrove Partners | 0 | -100,00 | 0 | -100,00 | ||||
| 2026-02-06 | 13F | Banque Cantonale Vaudoise | 856.020 | 197,58 | 2.273 | |||||
| 2026-02-13 | 13F | First Trust Advisors Lp | 48.519 | 171,72 | 129 | 161,22 | ||||
| 2026-01-14 | 13F | Mb, Levis & Associates, Llc | 152 | 0,00 | 0 | |||||
| 2026-02-12 | 13F | Federation des caisses Desjardins du Quebec | 1.153.378 | -31,75 | 3.044 | -34,41 | ||||
| 2025-10-22 | 13F | Crown Wealth Group, LLC | 0 | -100,00 | 0 | |||||
| 2026-02-12 | 13F/A | Pinebridge Investments Llc | 1.204.145 | 4.383 | ||||||
| 2026-02-17 | 13F | Public Employees Retirement System Of Ohio | 201.255 | -2,61 | 534 | -5,99 | ||||
| 2026-01-27 | 13F | TD Waterhouse Canada Inc. | 317.490 | 12,17 | 837 | 7,17 | ||||
| 2026-02-12 | 13F | Providence Capital Advisors, LLC | 23.371 | 0,00 | 62 | -3,12 | ||||
| 2026-02-18 | 13F | VGI Partners Ltd | 834.798 | 2.221 | ||||||
| 2026-02-03 | 13F | Sequoia Financial Advisors, LLC | 19.362 | 44,90 | 52 | 41,67 | ||||
| 2026-02-17 | 13F | ArrowMark Colorado Holdings LLC | 3.327.000 | 15,04 | 8.850 | 11,27 | ||||
| 2026-02-13 | 13F | Marshall Wace, Llp | 173.536 | 462 | ||||||
| 2026-02-11 | 13F | Janney Montgomery Scott LLC | 12.000 | 0 | ||||||
| 2026-02-13 | 13F | Van Eck Associates Corp | 75.910.027 | 20,87 | 202 | 16,86 | ||||
| 2026-02-17 | 13F | Citadel Advisors Llc | Call | 489.300 | 7,97 | 1.302 | 4,41 | |||
| 2026-02-10 | 13F | Envestnet Asset Management Inc | 296.945 | 270,41 | 790 | 258,64 | ||||
| 2026-02-17 | 13F | Citadel Advisors Llc | 6.220.405 | -66,47 | 16.546 | -67,57 | ||||
| 2026-02-17 | 13F | Citadel Advisors Llc | Put | 967.900 | 19,92 | 2.575 | 16,00 | |||
| 2026-02-02 | 13F | Intact Investment Management Inc. | 1.305.600 | -42,26 | 3.462 | -44,37 | ||||
| 2026-02-09 | 13F | MMCAP International Inc. SPC | 7.219.531 | -24,05 | 19.204 | -26,54 | ||||
| 2026-01-16 | 13F | Beaumont Financial Advisors, LLC | 10.700 | 0,00 | 28 | -3,45 | ||||
| 2026-02-19 | 13F | CI Private Wealth, LLC | 20.000 | 0,00 | 53 | -3,64 | ||||
| 2026-02-13 | 13F | Financial Sense Advisors, Inc. | 18.786 | 36,27 | 50 | 32,43 | ||||
| 2026-01-09 | 13F | SG Americas Securities, LLC | 10.039 | 0 | ||||||
| 2026-02-06 | 13F | EverSource Wealth Advisors, LLC | 817 | 2 | ||||||
| 2026-02-17 | 13F | Persistent Asset Partners Ltd | 0 | -100,00 | 0 | |||||
| 2026-01-22 | 13F | Brookwood Investment Group LLC | 0 | -100,00 | 0 | -100,00 | ||||
| 2025-09-25 | NP | VGTSX - Vanguard Total International Stock Index Fund Investor Shares | 892.390 | 1.836 | ||||||
| 2026-02-17 | 13F | Nomura Holdings Inc | 1.972.429 | -1,22 | 5.247 | -4,46 | ||||
| 2026-02-18 | 13F | NFP Retirement, Inc. | 90.500 | 9,04 | 241 | 5,26 | ||||
| 2026-02-17 | 13F | Warren Averett Asset Management, LLC | 50.581 | 135 | ||||||
| 2026-02-12 | 13F | Summit Financial, LLC | 2.379.247 | 0,00 | 6.329 | -3,27 | ||||
| 2026-02-17 | 13F | Freshford Capital Management, LLC | 0 | -100,00 | 0 | |||||
| 2026-02-17 | 13F | Sig Brokerage, Lp | 0 | -100,00 | 0 | |||||
| 2026-01-28 | 13F | Legacy Capital Group California, Inc. | 125.623 | 0,11 | 334 | -3,19 | ||||
| 2026-01-28 | 13F | Chicago Partners Investment Group LLC | 282.596 | 1.102 | ||||||
| 2026-02-12 | 13F | Hrt Financial Lp | 414.974 | 7,03 | 1 | 0,00 | ||||
| 2026-02-06 | 13F | Axxcess Wealth Management, Llc | 15.000 | 4 | ||||||
| 2026-02-02 | 13F | Sachetta, LLC | 0 | -100,00 | 0 | |||||
| 2026-02-11 | 13F | Capital Research Global Investors | 0 | -100,00 | 0 | |||||
| 2026-02-09 | 13F | Themes Management Co LLC | 220.638 | 585 | ||||||
| 2026-02-17 | 13F | Kerrisdale Advisers, LLC | 86.800 | 0,00 | 231 | -3,36 | ||||
| 2026-02-12 | 13F | BlackRock, Inc. | 207.331 | -31,81 | 552 | -34,09 | ||||
| 2026-01-30 | 13F | New Harbor Financial Group, LLC | 28.500 | 9,62 | 76 | 5,63 | ||||
| 2026-01-26 | 13F | Keystone Wealth Services, LLC | 20.715 | 55 | ||||||
| 2026-02-17 | 13F | Two Sigma Advisers, Lp | 5.713.100 | -58,34 | 15.197 | -59,71 | ||||
| 2026-01-30 | 13F | Kohmann Bosshard Financial Services, LLC | 1 | 0 | ||||||
| 2026-01-22 | 13F | Accordant Advisory Group Inc | 394.420 | 11,29 | 1.049 | 7,70 | ||||
| 2026-02-05 | 13F | Center for Financial Planning, Inc. | 490 | 0,00 | 1 | 0,00 | ||||
| 2026-02-12 | 13F | Investor's Fiduciary Advisor Network, LLC | 10.869 | 0 | ||||||
| 2025-11-21 | 13F/A | CIBC Bancorp USA Inc. | Call | 95.000 | 261 | |||||
| 2026-02-12 | 13F | Alps Advisors Inc | 47.866.962 | -11,18 | 127.326 | -14,09 | ||||
| 2026-02-17 | 13F | Aquatic Capital Management LLC | 0 | -100,00 | 0 | |||||
| 2026-02-17 | 13F | Alliancebernstein L.p. | 1.809.464 | -1,28 | 4.813 | -4,50 | ||||
| 2026-02-11 | 13F | Havemeyer Place LP | 135.217 | 360 | ||||||
| 2025-09-25 | NP | DFIEX - International Core Equity Portfolio - Institutional Class This fund is a listed as child fund of Dimensional Fund Advisors Lp and if that institution has disclosed ownership in this security, then these positions will not be double counted when calculating total shares and total value | 1.668.715 | 0,00 | 3.432 | 43,24 | ||||
| 2026-02-19 | 13F | Atomi Financial Group, Inc. | 41.200 | 0,49 | 110 | -2,68 | ||||
| 2026-02-06 | 13F | IFP Advisors, Inc | 41 | 0,00 | 0 | |||||
| 2026-02-13 | 13F | Integrated Wealth Concepts LLC | 0 | -100,00 | 0 | |||||
| 2026-02-09 | 13F | Catalyst Funds Management Pty Ltd | 938.900 | -3,08 | 2.497 | -6,23 | ||||
| 2026-02-13 | 13F | Natixis | 6.985 | -9,75 | 19 | -14,29 | ||||
| 2026-02-18 | 13F | Mackenzie Financial Corp | 983.206 | 71,95 | 2.593 | 64,84 | ||||
| 2025-11-04 | 13F | Winnow Wealth Llc | 0 | -100,00 | 0 | |||||
| 2026-01-09 | 13F | Pacifica Partners Inc. | 45.446 | 0,32 | 137 | 9,68 | ||||
| 2026-02-13 | 13F | Citigroup Inc | 728.665 | 23,08 | 1.935 | 18,72 | ||||
| 2026-01-26 | 13F | Abbington Investment Group | 0 | -100,00 | 0 | -100,00 | ||||
| 2026-01-21 | 13F | Flagship Harbor Advisors, Llc | 140 | 0 | ||||||
| 2026-02-02 | 13F | Mutual Advisors, LLC | 26.531 | 60,49 | 71 | 55,56 | ||||
| 2025-11-04 | 13F | Tejara Capital Ltd | 0 | -100,00 | 0 | |||||
| 2026-02-13 | 13F | Barclays Plc | 188.021 | 15,97 | 500 | 12,36 | ||||
| 2026-02-05 | 13F | Stephens Inc /ar/ | 42.495 | -5,59 | 113 | -8,13 | ||||
| 2025-11-14 | 13F | Arosa Capital Management LP | 0 | -100,00 | 0 | |||||
| 2026-02-17 | 13F | Janus Henderson Group Plc | 1.435.980 | -5,68 | 3.813 | -9,08 | ||||
| 2026-01-29 | 13F | UBS Group AG | Call | 20.704.740 | 0,00 | 55.075 | -3,27 | |||
| 2026-01-29 | 13F | UBS Group AG | 7.751.985 | -27,93 | 20.620 | -30,29 | ||||
| 2026-02-13 | 13F | Pathstone Holdings, LLC | 19.300 | 0,00 | 51 | -3,77 | ||||
| 2026-02-17 | 13F | Schonfeld Strategic Advisors LLC | 54.076 | -79,13 | 144 | -79,92 | ||||
| 2026-02-13 | 13F | Centaurus Financial, Inc. | 0 | -100,00 | 0 | |||||
| 2026-02-17 | 13F | D. E. Shaw & Co., Inc. | 1.945.700 | 99,91 | 5.161 | 92,75 | ||||
| 2026-01-05 | 13F | Confluence Investment Management Llc | 321.204 | 11,13 | 854 | 7,56 | ||||
| 2026-02-17 | 13F | Tower Research Capital LLC (TRC) | 0 | -100,00 | 0 | |||||
| 2026-02-13 | 13F | Walleye Trading LLC | Call | 42.400 | 113 | |||||
| 2026-02-17 | 13F | Jain Global LLC | 162.400 | 114,53 | 431 | 106,73 | ||||
| 2026-01-23 | 13F | Shore Point Advisors, LLC | 10.000 | 0,00 | 27 | -3,70 | ||||
| 2026-02-13 | 13F | Walleye Trading LLC | 3.930 | 10 | ||||||
| 2026-02-17 | 13F | Jain Global LLC | Put | 350.000 | 0,00 | 931 | -3,22 | |||
| 2026-01-21 | 13F | Stone House Investment Management, LLC | 3.178 | 0,00 | 8 | 0,00 | ||||
| 2026-02-13 | 13F | Walleye Trading LLC | Put | 2.600 | 7 | |||||
| 2026-02-12 | 13F | Cibc World Markets Corp | 258.000 | 686 | ||||||
| 2026-02-05 | 13F | Heathbridge Capital Management Ltd. | 100.000 | 0,00 | 266 | -3,64 | ||||
| 2026-02-09 | 13F | Geode Capital Management, Llc | 612.311 | 11,33 | 1.657 | 9,02 | ||||
| 2026-02-10 | 13F | Foundations Investment Advisors, LLC | Call | 35.000 | 93 | |||||
| 2026-01-08 | 13F | Wealth Enhancement Advisory Services, Llc | 60.821 | -3,27 | 199 | 11,17 | ||||
| 2026-02-10 | 13F | BW Gestao de Investimentos Ltda. | 1.848.804 | 4.918 | ||||||
| 2026-02-11 | 13F | Simplex Trading, Llc | 0 | -100,00 | 0 | |||||
| 2026-01-14 | 13F | ORG Partners LLC | 3.900 | -32,17 | 10 | -33,33 | ||||
| 2026-02-13 | 13F | Alyeska Investment Group, L.P. | 1.000.400 | 0,00 | 2.661 | -3,27 | ||||
| 2025-11-14 | 13F | PineBridge Investments, L.P. | 1.475.227 | 5.650 | ||||||
| 2026-02-17 | 13F | Hood River Capital Management LLC | 27.013.269 | 2,93 | 71.855 | -0,43 | ||||
| 2026-02-17 | 13F | Old Mission Capital Llc | 431.678 | 1.148 | ||||||
| 2026-01-23 | 13F | Azarias Capital Management, L.P. | 2.922.967 | 0,00 | 7.775 | -3,27 | ||||
| 2025-10-03 | 13F | HFG Wealth Management, LLC | 0 | -100,00 | 0 | |||||
| 2026-02-17 | 13F | Farringdon Capital, Ltd. | 10.177 | -55,55 | 27 | -56,45 | ||||
| 2026-02-17 | 13F | Toronto Dominion Bank | Call | 10.000.000 | 26.600 | |||||
| 2026-02-12 | 13F | Steward Partners Investment Advisory, Llc | 2.500 | 0,00 | 7 | 0,00 | ||||
| 2026-02-10 | 13F | CIBC World Markets Inc. | 772.846 | 87,58 | 2.048 | 80,76 | ||||
| 2026-02-17 | 13F | Toronto Dominion Bank | 2.935.573 | 18,66 | 7.805 | 14,71 | ||||
| 2026-02-17 | 13F | Toronto Dominion Bank | Put | 1.000.000 | 2.660 | |||||
| 2026-02-17 | 13F | Amundi | 80.498 | 214 | ||||||
| 2026-02-17 | 13F | Caption Management, LLC | 50.300 | -85,71 | 134 | -86,25 | ||||
| 2026-02-13 | 13F | Gts Securities Llc | 106.471 | 283 | ||||||
| 2026-02-17 | 13F | Caption Management, LLC | Call | 231.100 | -51,99 | 615 | -53,59 | |||
| 2026-01-23 | 13F | Assetmark, Inc | 1.000 | 0,00 | 3 | 0,00 | ||||
| 2026-01-28 | 13F | Eagle Global Advisors Llc | 161.400 | 0,00 | 429 | -3,16 | ||||
| 2026-02-13 | 13F | Squarepoint Ops LLC | Call | 22.600 | 0,00 | 60 | -3,23 | |||
| 2026-02-13 | 13F | Squarepoint Ops LLC | Put | 28.200 | 0,00 | 75 | -2,60 | |||
| 2026-02-13 | 13F | Squarepoint Ops LLC | 62.793 | 17,03 | 167 | 13,61 | ||||
| 2025-09-25 | NP | DFIC - Dimensional International Core Equity 2 ETF | 167.002 | 0,00 | 346 | 46,81 | ||||
| 2025-09-26 | NP | FTIHX - Fidelity Total International Index Fund This fund is a listed as child fund of Fmr Llc and if that institution has disclosed ownership in this security, then these positions will not be double counted when calculating total shares and total value | 411.007 | 2,35 | 845 | 46,70 | ||||
| 2026-01-28 | 13F | Delta Wealth Advisors LLC | 0 | -100,00 | 0 | -100,00 | ||||
| 2026-02-10 | 13F | Ritter Daniher Financial Advisory LLC / DE | 10.000 | 0,00 | 27 | -3,70 | ||||
| 2025-09-25 | NP | Dfa Investment Dimensions Group Inc - Va International Small Portfolio This fund is a listed as child fund of Dimensional Fund Advisors Lp and if that institution has disclosed ownership in this security, then these positions will not be double counted when calculating total shares and total value | 14.027 | -71,90 | 29 | -71,57 | ||||
| 2026-02-12 | 13F | Jane Street Group, Llc | 7.827.217 | 37,97 | 20.820 | 33,46 | ||||
| 2026-02-12 | 13F | Jane Street Group, Llc | Call | 11.369.900 | 3.615,65 | 30.244 | 3.496,08 | |||
| 2026-02-12 | 13F | Jane Street Group, Llc | Put | 70.300 | 70,22 | 187 | 64,60 | |||
| 2026-02-03 | 13F | K.J. Harrison & Partners Inc | 0 | -100,00 | 0 | |||||
| 2026-02-17 | 13F | Susquehanna Advisors Group, Inc. | 515.900 | 1.372 | ||||||
| 2026-03-06 | 13F | Hsbc Holdings Plc | 131.760 | -7,77 | 349 | -10,97 | ||||
| 2026-02-10 | 13F | State of Wyoming | 10.576 | 28 | ||||||
| 2025-11-07 | 13F | Shell Asset Management Co | 13.800 | -69,92 | 0 | |||||
| 2026-02-17 | 13F | Lloyd Harbor Capital Management, LLC | Call | 0 | -100,00 | 0 | ||||
| 2026-02-13 | 13F | Quarry LP | Call | 300.000 | 27,66 | 798 | 23,53 | |||
| 2025-09-24 | NP | IXUS - iShares Core MSCI Total International Stock ETF | 1.688.875 | 4,76 | 3.474 | 50,02 | ||||
| 2026-02-10 | 13F | Titan Global Capital Management Usa Llc | 1.883.895 | 0,29 | 5.011 | -2,98 | ||||
| 2026-02-13 | 13F | Bank Of Nova Scotia | 1.798.791 | 6,61 | 4.785 | 3,13 | ||||
| 2026-02-13 | 13F | Bank Of Nova Scotia | Put | 12.500 | 33 | |||||
| 2026-02-13 | 13F | Cohen & Steers, Inc. | 1.217.039 | 106,77 | 3 | 200,00 | ||||
| 2026-02-10 | 13F | CIBC Asset Management Inc | 777.126 | -3,48 | 2.062 | -6,82 | ||||
| 2026-02-17 | 13F | Engineers Gate Manager LP | 11.787 | 31 | ||||||
| 2026-02-06 | 13F | Leonteq Securities AG | 567 | -97,86 | 2 | -98,61 | ||||
| 2026-01-16 | 13F | Compagnie Lombard Odier SCmA | 5.500 | 0,00 | 15 | -6,67 | ||||
| 2026-02-13 | 13F | Great West Life Assurance Co /can/ | 3.146.181 | 99,91 | 8 | 100,00 | ||||
| 2026-02-11 | 13F | Cedar Mountain Advisors, LLC | 749 | 0,00 | 2 | -50,00 | ||||
| 2026-02-17 | 13F | Lloyd Harbor Capital Management, LLC | 6.100.000 | 41,84 | 16.226 | 37,21 | ||||
| 2026-02-13 | 13F | Peak6 Llc | Put | 50.000 | 0,00 | 133 | -2,92 | |||
| 2026-02-13 | 13F | Peak6 Llc | 39.811 | 106 | ||||||
| 2025-11-14 | 13F | Point72 Asia (Singapore) Pte. Ltd. | 105.685 | 291 | ||||||
| 2026-02-17 | 13F | Point72 Asset Management, L.P. | 995.160 | 2.645 | ||||||
| 2026-02-13 | 13F | Peak6 Llc | Call | 213.900 | -89,36 | 569 | -89,73 | |||
| 2026-02-13 | 13F | Mariner, LLC | 27.739 | -20,45 | 74 | -23,16 | ||||
| 2026-01-22 | 13F | Vision Financial Markets Llc | 157 | 0,00 | 0 | |||||
| 2026-02-09 | 13F | Strategic Financial Concepts, LLC | 57.815 | 154 | ||||||
| 2026-01-26 | 13F | Cwm, Llc | 3.298 | 119,87 | 0 | |||||
| 2025-09-29 | NP | URA - Global X Uranium ETF This fund is a listed as child fund of Mirae Asset Global Investments Co., Ltd. and if that institution has disclosed ownership in this security, then these positions will not be double counted when calculating total shares and total value | 48.848.029 | -1,23 | 100.696 | 42,04 | ||||
| 2026-02-02 | 13F | SevenBridge Financial Group, LLC | 31.000 | -16,22 | 115 | 20,00 | ||||
| 2026-02-13 | 13F | JustInvest LLC | 34.260 | 18,96 | 91 | 15,19 | ||||
| 2026-02-03 | 13F | Indivisible Partners | 14.850 | 40 | ||||||
| 2025-09-25 | NP | DFA INVESTMENT DIMENSIONS GROUP INC - World ex U.S. Core Equity Portfolio Institutional Class Shares | 90.674 | 0,00 | 187 | 43,08 | ||||
| 2026-02-13 | 13F | Visionary Wealth Advisors | 12.500 | -28,57 | 33 | -31,25 | ||||
| 2026-02-13 | 13F | Manufacturers Life Insurance Company, The | 4.101.505 | -0,06 | 10.855 | -3,67 | ||||
| 2026-02-06 | 13F/A | Rathbone Brothers plc | 75.300 | 0,00 | 200 | -3,38 | ||||
| 2026-02-02 | 13F | Vantage Point Financial LLC | 18.620 | 0,00 | 50 | -3,92 | ||||
| 2026-02-10 | 13F | Exit Wealth Advisors, LLC. | 306.826 | 816 | ||||||
| 2025-09-29 | NP | CCSO - Carbon Collective Climate Solutions U.S. Equity ETF | 31.769 | 0,00 | 66 | 47,73 | ||||
| 2026-02-04 | 13F | Swiss Life Asset Management Ltd | 40.762 | 3,93 | 108 | 0,00 | ||||
| 2026-02-17 | 13F | Parallax Volatility Advisers, L.P. | Call | 722.900 | -12,00 | 1.923 | -14,92 | |||
| 2026-02-17 | 13F | Parallax Volatility Advisers, L.P. | Put | 100 | 0 | |||||
| 2026-02-11 | 13F | Vermillion Wealth Management, Inc. | 1.043 | 0,00 | 3 | 0,00 | ||||
| 2025-11-24 | 13F | CIBC Private Wealth Group, LLC | 0 | -100,00 | 0 | -100,00 | ||||
| 2026-02-13 | 13F | Wright Wealth Llc | 200.200 | 533 | ||||||
| 2026-02-09 | 13F | Integrity Alliance, Llc. | 16.592 | 44 | ||||||
| 2026-02-04 | 13F | Independent Advisor Alliance | 12.189 | -40,88 | 32 | -42,86 | ||||
| 2026-02-12 | 13F | Hohimer Wealth Management, Llc | 23.300 | 0,00 | 62 | -4,69 | ||||
| 2026-02-17 | 13F | Ardsley Advisory Partners Lp | 4.100.000 | 105,00 | 10.906 | 98,29 | ||||
| 2025-11-14 | 13F | Segra Capital Management, LLC | 0 | -100,00 | 0 | |||||
| 2025-09-25 | NP | VFSNX - Vanguard FTSE All-World ex-US Small-Cap Index Fund Institutional Shares | 204.169 | 420 | ||||||
| 2026-02-13 | 13F | Extract Advisors LLC | 1.725.182 | 4.589 | ||||||
| 2026-02-12 | 13F | Resurgent Financial Advisors LLC | 12.500 | 33 | ||||||
| 2026-02-13 | 13F | National Bank Of Canada /fi/ | 1.311.062 | 36,72 | 3.461 | 31,40 | ||||
| 2026-02-13 | 13F | Southport Management, L.l.c. | 151.000 | 0,00 | 402 | -3,37 | ||||
| 2025-09-25 | NP | TLTD - FlexShares Morningstar Developed Markets ex-US Factor Tilt Index Fund | 27.187 | 39,97 | 56 | 107,41 | ||||
| 2026-02-10 | 13F | Fielder Capital Group LLC | 1.005.148 | -14,67 | 2.674 | -17,47 | ||||
| 2026-02-10 | 13F | Connor, Clark & Lunn Investment Management Ltd. | 9.333.890 | 28,26 | 24.754 | 23,62 | ||||
| 2026-02-17 | 13F | Hilltop Holdings Inc. | 232.677 | 619 | ||||||
| 2026-01-29 | 13F | Calamos Advisors LLC | 56.800 | 151 | ||||||
| 2026-02-17 | 13F | Jones Financial Companies Lllp | 48.045 | 317,24 | 128 | 309,68 | ||||
| 2026-01-29 | 13F | Vanguard Group Inc | 23.960.755 | 80,65 | 63.544 | 74,08 | ||||
| 2026-02-03 | 13F | NewEdge Wealth, LLC | 15.000 | 0,00 | 40 | -2,50 | ||||
| 2026-02-05 | 13F | Cambridge Investment Research Advisors, Inc. | 334.121 | 3,94 | 1 | |||||
| 2026-02-19 | 13F | Invesco Ltd. | 10.206 | 27 | ||||||
| 2026-01-23 | 13F | Ritholtz Wealth Management | 12.150 | 4,29 | 32 | 0,00 | ||||
| 2025-09-25 | NP | DFAX - Dimensional World ex U.S. Core Equity 2 ETF | 146.292 | 0,00 | 302 | 44,02 | ||||
| 2026-02-17 | 13F | Mercer Global Advisors Inc /adv | 13.924 | 37 | ||||||
| 2026-02-17 | 13F | Two Sigma Investments, Lp | 14.888.207 | -12,56 | 39.603 | -15,42 | ||||
| 2026-02-18 | 13F | GWM Advisors LLC | 0 | -100,00 | 0 | |||||
| 2026-02-13 | 13F | Headlands Technologies LLC | 0 | -100,00 | 0 | -100,00 |