Grundlæggende statistik
| Institutionelle ejere | 307 total, 295 long only, 0 short only, 12 long/short - change of -27,25% MRQ |
| Gennemsnitlig porteføljeallokering | 0.1062 % - change of -45,57% MRQ |
| Institutionelle aktier (lange) | 251.601.536 (ex 13D/G) - change of -29,25MM shares -10,42% MRQ |
| Institutionel værdi (lang) | $ 3.877.074 USD ($1000) |
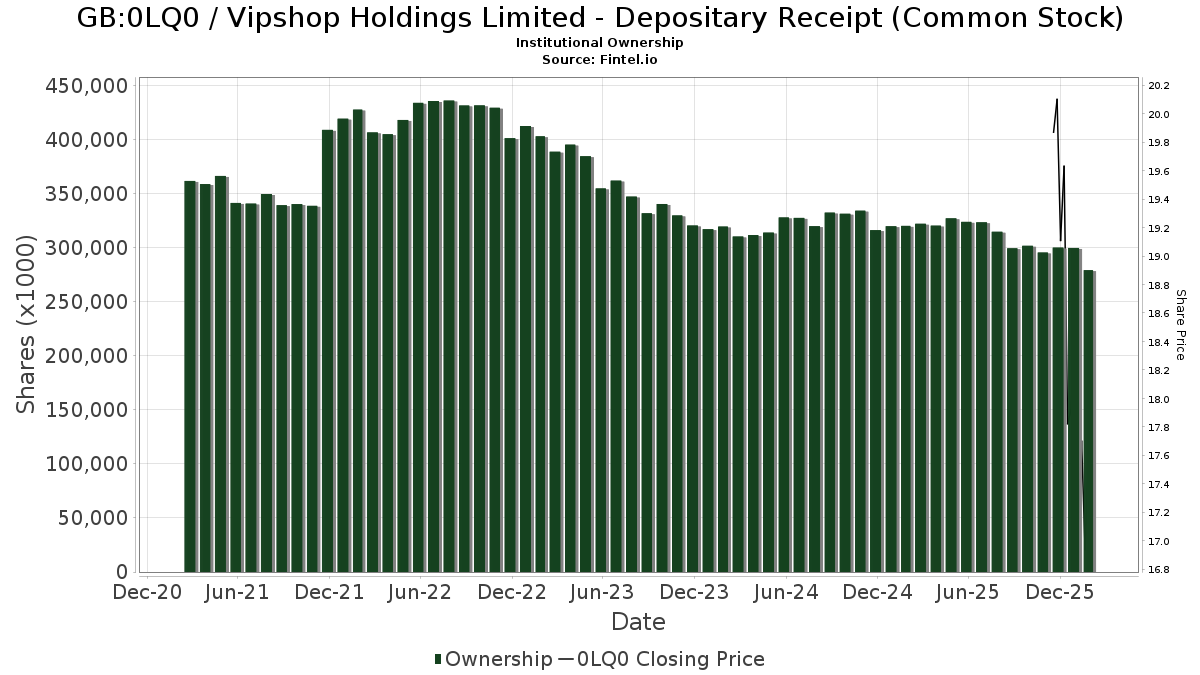
Institutionelt ejerskab og aktionærer
Vipshop Holdings Limited - Depositary Receipt (Common Stock) (GB:0LQ0) har 307 institutionelle ejere og aktionærer, der har indsendt 13D/G- eller 13F-formularer til Securities Exchange Commission (SEC). Disse institutioner har i alt 251,601,536 aktier. Største aktionærer omfatter BlackRock, Inc., FIL Ltd, Invesco Ltd., Acadian Asset Management Llc, Krane Funds Advisors LLC, Robeco Institutional Asset Management B.V., Orbis Allan Gray Ltd, Vanguard Group Inc, Dimensional Fund Advisors Lp, and State Street Corp .
Vipshop Holdings Limited - Depositary Receipt (Common Stock) (LSE:0LQ0) institutionel ejerskabsstruktur viser aktuelle positioner i virksomheden efter institutioner og fonde, samt seneste ændringer i positionsstørrelse. Større aktionærer kan omfatte individuelle investorer, investeringsforeninger, hedgefonde eller institutioner. Skema 13D angiver, at investoren besidder (eller besidder) mere end 5 % af virksomheden og har til hensigt (eller har til hensigt at) aktivt at forfølge en ændring i forretningsstrategi. Skema 13G indikerer en passiv investering på over 5%.
The share price as of April 10, 2026 is 15,13 / share. Previously, on May 6, 2025, the share price was 24,50 / share. This represents a decline of 38,25% over that period.
Fondens stemningsscore
Fund Sentiment Score (fka Ownership Accumulation Score) finder de aktier, der bliver mest købt af fonde. Det er resultatet af en sofistikeret, multi-faktor kvantitativ model, der identificerer virksomheder med de højeste niveauer af institutionel akkumulering. Scoringsmodellen bruger en kombination af den samlede stigning i oplyste ejere, ændringerne i porteføljeallokeringer i disse ejere og andre målinger. Tallet går fra 0 til 100, hvor højere tal indikerer et højere niveau af akkumulering for sine jævnaldrende, og 50 er gennemsnittet.
Opdateringsfrekvens: Dagligt
Se Ownership Explorer, som giver en liste over højest rangerende virksomheder.
AI+ Ask Fintel’s AI assistant about Vipshop Holdings Limited - Depositary Receipt (Common Stock).
Select a question to share a public post with an AI-crafted answer.
Thinking of good questions…
13F og NPORT arkivering
Detaljer om 13F-arkivering er gratis. Detaljer om NP-ansøgninger kræver et premium-medlemskab. Grønne rækker angiver nye positioner. Røde rækker angiver lukkede positioner. Klik på linket ikon for at se den fulde transaktionshistorik.
Opgrader
for at låse premium-data op og eksportere til Excel ![]() .
.
| Fil dato | Kilde | Investor | Type | Gennemsnitlig pris (Øst) |
Aktier | Δ Aktier (%) |
Rapporteret Værdi ($1000) |
Δ Værdi (%) |
Port Alloc (%) |
|
|---|---|---|---|---|---|---|---|---|---|---|
| 2026-02-13 | 13F | Van Eck Associates Corp | 92.997 | 19,90 | 2 | 0,00 | ||||
| 2026-02-17 | 13F | FIL Ltd | 18.891.105 | 2,63 | 334.184 | -7,56 | ||||
| 2026-02-13 | 13F | JustInvest LLC | 42.354 | 8,13 | 749 | -2,60 | ||||
| 2026-02-11 | 13F | Krane Funds Advisors LLC | 12.793.590 | -25,56 | 226.319 | -29,37 | ||||
| 2026-02-14 | 13F | Rockefeller Capital Management L.P. | 10 | 0,00 | 0 | |||||
| 2026-02-05 | 13F | Park Square Financial Group, LLC | 0 | -100,00 | 0 | |||||
| 2026-02-17 | 13F | Trexquant Investment LP | 116.158 | 2.055 | ||||||
| 2026-02-17 | 13F | Engineers Gate Manager LP | 66.535 | 1.177 | ||||||
| 2026-02-13 | 13F | Public Sector Pension Investment Board | 0 | -100,00 | 0 | |||||
| 2026-02-12 | 13F | SWAN Capital LLC | 30 | 0,00 | 1 | |||||
| 2026-02-02 | 13F | Principal Financial Group Inc | 1.381.160 | 6,12 | 24.433 | -4,42 | ||||
| 2026-02-17 | 13F | Guggenheim Capital Llc | 67.553 | 7,40 | 1.195 | -3,24 | ||||
| 2026-01-23 | 13F | Inlight Wealth Management, LLC | 200 | 0,00 | 4 | 0,00 | ||||
| 2026-04-13 | 13F | True Wealth Design, LLC | 40 | -47,37 | 1 | -100,00 | ||||
| 2026-04-02 | 13F | Byrne Asset Management LLC | 800 | 0,00 | 13 | -14,29 | ||||
| 2026-02-13 | 13F | Korea Investment CORP | 407.772 | 12,87 | 7.213 | 1,66 | ||||
| 2026-02-13 | 13F | Dymon Asia Capital (singapore) Pte. Ltd. | 67.112 | 1.187 | ||||||
| 2026-02-06 | 13F | Global Retirement Partners, LLC | 5.975 | 104,27 | 106 | 84,21 | ||||
| 2026-02-13 | 13F | Rhumbline Advisers | 49.893 | -0,62 | 883 | -10,55 | ||||
| 2025-11-14 | 13F | Caption Management, LLC | Call | 0 | -100,00 | 0 | ||||
| 2026-02-12 | 13F | Rossby Financial, LCC | 117 | -6,40 | 2 | 0,00 | ||||
| 2026-01-30 | 13F | Verity Asset Management, Inc. | 0 | -100,00 | 0 | |||||
| 2026-02-17 | 13F | Two Sigma Advisers, Lp | 111.200 | -83,03 | 1.967 | -84,72 | ||||
| 2026-02-17 | 13F | Orbis Allan Gray Ltd | 10.814.948 | 12,80 | 191.316 | 1,60 | ||||
| 2026-02-13 | 13F | Dodge & Cox | 124.197 | 0,00 | 2.197 | -9,92 | ||||
| 2026-02-02 | 13F | Danske Bank A/s | 142.248 | -22,20 | 2.516 | -29,94 | ||||
| 2026-02-17 | 13F | Cetera Investment Advisers | 69.570 | 93,71 | 1.231 | 74,47 | ||||
| 2026-02-17 | 13F | Lazard Asset Management Llc | 961.901 | 1,57 | 17.016 | -8,51 | ||||
| 2026-02-17 | 13F | Bayesian Capital Management, LP | 0 | -100,00 | 0 | |||||
| 2026-02-03 | 13F | Mitsubishi UFJ Kokusai Asset Management Co., Ltd. | 359.586 | 0,00 | 6.368 | -9,83 | ||||
| 2026-03-03 | 13F/A | Caitong International Asset Management Co., Ltd | 2.143 | 8.472,00 | 38 | |||||
| 2026-02-11 | 13F | Group One Trading, L.p. | Call | 201.500 | -5,93 | 3.565 | -15,26 | |||
| 2026-01-30 | 13F | Kiker Wealth Management, LLC | 0 | -100,00 | 0 | |||||
| 2026-02-11 | 13F | Group One Trading, L.p. | Put | 233.000 | -52,31 | 4.122 | -57,06 | |||
| 2026-04-29 | 13F | Standard Life Aberdeen plc | 268.778 | -17,87 | 4.225 | -27,02 | ||||
| 2026-02-13 | 13F | Great West Life Assurance Co /can/ | 486.037 | -35,11 | 9 | -42,86 | ||||
| 2026-01-28 | 13F | CAPROCK Group, Inc. | 14.965 | 0,48 | 265 | 6,02 | ||||
| 2026-04-20 | 13F | Jfs Wealth Advisors, Llc | 327 | 0,00 | 5 | 0,00 | ||||
| 2026-04-20 | 13F | North of South Capital LLP | 0 | -100,00 | 0 | |||||
| 2026-04-24 | 13F | Profund Advisors Llc | 13.392 | 10,37 | 211 | -1,87 | ||||
| 2026-02-12 | 13F | Ensign Peak Advisors, Inc | 19.050 | 0,00 | 337 | -10,16 | ||||
| 2026-02-17 | 13F | Royal Bank Of Canada | 40.728 | -43,03 | 720 | -48,72 | ||||
| 2026-02-13 | 13F | Pathstone Holdings, LLC | 15.510 | 2,63 | 274 | -7,43 | ||||
| 2026-04-22 | 13F | Stone House Investment Management, LLC | 1 | 0 | ||||||
| 2026-04-30 | 13F | Sumitomo Mitsui Trust Holdings, Inc. | 696.182 | -0,85 | 10.944 | -11,90 | ||||
| 2026-02-13 | 13F | Pinnacle Wealth Planning Services, Inc. | 795 | 14 | ||||||
| 2026-05-01 | 13F | Royal London Asset Management Ltd | 340.546 | 0,00 | 5.353 | -11,14 | ||||
| 2026-04-20 | 13F | Ritholtz Wealth Management | 188.446 | 1,65 | 2.962 | -9,67 | ||||
| 2025-11-14 | 13F | DRW Securities, LLC | 0 | -100,00 | 0 | -100,00 | ||||
| 2026-02-13 | 13F | Schroder Investment Management Group | 312.343 | 93,51 | 5.628 | 82,67 | ||||
| 2026-02-17 | 13F/A | RBF Capital, LLC | 722.165 | 0,00 | 12.775 | -9,93 | ||||
| 2026-04-24 | 13F | Marathon Asset Mgmt Ltd | 2.925.605 | -0,58 | 45.991 | -11,65 | ||||
| 2026-02-17 | 13F | Millennium Management Llc | 292.203 | 137,21 | 5.169 | 113,68 | ||||
| 2026-04-17 | 13F | Murphy & Mullick Capital Management Corp | 500 | 0,00 | 8 | -12,50 | ||||
| 2026-01-29 | 13F | IMC-Chicago, LLC | 0 | -100,00 | 0 | -100,00 | ||||
| 2026-02-12 | 13F | Hrt Financial Lp | 20.163 | 0 | ||||||
| 2026-02-17 | 13F | Price T Rowe Associates Inc /md/ | 15.700 | 33,05 | 0 | |||||
| 2026-02-10 | 13F | Norges Bank | 1.561.966 | 27.631 | ||||||
| 2026-03-02 | 13F | Tobam | 694 | -26,48 | 0 | |||||
| 2026-02-17 | 13F | Grantham, Mayo, Van Otterloo & Co. LLC | 1.890.621 | 40,68 | 33.445 | 26,71 | ||||
| 2026-02-19 | 13F | Invesco Ltd. | 16.864.626 | 0,89 | 298.335 | -9,13 | ||||
| 2026-02-13 | 13F | Barclays Plc | 760.593 | 59,50 | 13.455 | 43,66 | ||||
| 2026-02-17 | 13F | Fmr Llc | 2.257.849 | -6,18 | 39.941 | -15,50 | ||||
| 2025-11-14 | 13F | Aqr Capital Management Llc | 0 | -100,00 | 0 | |||||
| 2026-02-13 | 13F | Macquarie Group Ltd | 160.215 | -57,61 | 2.834 | -61,82 | ||||
| 2026-04-30 | 13F | Resona Asset Management Co.,Ltd. | 82.137 | 11,10 | 1.295 | -2,41 | ||||
| 2026-04-28 | 13F | Kathmere Capital Management, LLC | 13.055 | 2,30 | 205 | -8,89 | ||||
| 2026-02-12 | 13F | Voya Investment Management Llc | 29.022 | -3,58 | 513 | -13,20 | ||||
| 2026-02-17 | 13F | California State Teachers Retirement System | 158.849 | 2,20 | 2.810 | -7,93 | ||||
| 2026-02-17 | 13F | Mercer Global Advisors Inc /adv | 10.194 | -5,99 | 180 | -15,09 | ||||
| 2026-03-25 | 13F/A | Barclays Plc | Call | 0 | -100,00 | 0 | -100,00 | |||
| 2026-02-17 | 13F | Raymond James Financial Inc | 71.999 | 31,17 | 1.283 | 18,92 | ||||
| 2026-04-30 | 13F | Nisa Investment Advisors, Llc | 651 | 0,31 | 10 | -9,09 | ||||
| 2026-02-12 | 13F | New York State Common Retirement Fund | 1.151.485 | -9,86 | 20.370 | -18,81 | ||||
| 2026-02-13 | 13F | BRITISH COLUMBIA INVESTMENT MANAGEMENT Corp | 120.500 | -5,64 | 2.132 | -15,03 | ||||
| 2026-02-17 | 13F | Caisse De Depot Et Placement Du Quebec | 410.957 | 7,19 | 7.270 | -3,45 | ||||
| 2026-02-17 | 13F | Advisor Group Holdings, Inc. | 4.549 | -93,75 | 80 | -94,37 | ||||
| 2026-02-17 | 13F | Point72 Asset Management, L.P. | 1.120.976 | 19.830 | ||||||
| 2026-04-21 | 13F | Hosking Partners LLP | 0 | -100,00 | 0 | |||||
| 2026-02-17 | 13F | Qube Research & Technologies Ltd | 1.393.595 | 187,65 | 24.653 | 159,09 | ||||
| 2026-02-06 | 13F | Pnc Financial Services Group, Inc. | 10.094 | 2,04 | 179 | -8,25 | ||||
| 2026-04-17 | 13F | Bell Investment Advisors, Inc | 344 | 5 | ||||||
| 2026-02-13 | 13F | Healthcare Of Ontario Pension Plan Trust Fund | 664.300 | -8,40 | 11.751 | -17,49 | ||||
| 2026-02-17 | 13F | Vinva Investment Management Ltd | 206.006 | 384,17 | 3.712 | 357,14 | ||||
| 2026-02-10 | 13F | State of Wyoming | 65 | 32,65 | 1 | |||||
| 2026-02-13 | 13F | Sei Investments Co | 1.183.948 | -11,75 | 20.944 | -20,51 | ||||
| 2026-04-22 | 13F | Pinnacle Bancorp, Inc. | 739 | 0,00 | 12 | -15,38 | ||||
| 2026-02-05 | 13F | Baader Bank INC | 15.000 | -1,45 | 265 | -10,77 | ||||
| 2026-02-13 | 13F | Pinpoint Asset Management (Singapore) Pte. Ltd. | 0 | -100,00 | 0 | |||||
| 2026-04-29 | 13F | Swedbank AB | 185.872 | 13,81 | 2.922 | 1,11 | ||||
| 2026-02-17 | 13F | Creative Planning | 256.847 | 25,91 | 4.544 | 13,40 | ||||
| 2026-02-13 | 13F | Panagora Asset Management Inc | 19.286 | -2,45 | 341 | -12,11 | ||||
| 2026-02-17 | 13F | Citadel Advisors Llc | Call | 42.600 | -15,98 | 754 | -24,32 | |||
| 2026-02-17 | 13F | Citadel Advisors Llc | 161.710 | -52,59 | 2.861 | -57,30 | ||||
| 2026-02-17 | 13F | Tower Research Capital LLC (TRC) | 1.131 | -77,30 | 20 | -79,38 | ||||
| 2026-01-27 | 13F | Asset Management One Co., Ltd. | 49.750 | -12,93 | 963 | -14,17 | ||||
| 2026-02-13 | 13F | Gts Securities Llc | 0 | -100,00 | 0 | |||||
| 2026-02-17 | 13F | Citadel Advisors Llc | Put | 132.900 | -23,88 | 2.351 | -31,44 | |||
| 2026-02-12 | 13F | Principal Securities, Inc. | 35.716 | 149,74 | 632 | 125,36 | ||||
| 2025-11-07 | 13F | Comgest Global Investors S.a.s. | 0 | -100,00 | 0 | -100,00 | ||||
| 2026-02-12 | 13F | Skandinaviska Enskilda Banken AB (publ) | 303.282 | 68,66 | 5.365 | 51,94 | ||||
| 2026-02-09 | 13F | Geode Capital Management, Llc | 3.048.551 | -15,16 | 53.603 | -23,62 | ||||
| 2026-02-13 | 13F | Mml Investors Services, Llc | 57.859 | 270,46 | 1.024 | 234,31 | ||||
| 2026-02-17 | 13F | Hilltop Holdings Inc. | 38.696 | 685 | ||||||
| 2026-02-19 | 13F | Atomi Financial Group, Inc. | 15.351 | 13,81 | 272 | 2,65 | ||||
| 2026-02-12 | 13F | Loomis Sayles & Co L P | 63.826 | 1,51 | 1.129 | -8,51 | ||||
| 2026-02-17 | 13F | Liontrust Investment Partners LLP | 9.000 | 159 | ||||||
| 2026-02-17 | 13F | Cape Investment Advisory, Inc. | 123 | 2 | ||||||
| 2026-01-26 | 13F | Mirae Asset Global Investments Co., Ltd. | 28.370 | -27,63 | 502 | -34,85 | ||||
| 2026-02-13 | 13F | Citigroup Inc | 1.053.448 | -2,16 | 18.635 | -11,87 | ||||
| 2026-02-20 | 13F | Kovitz Investment Group Partners, LLC | 79.065 | 4,95 | 1.399 | -5,48 | ||||
| 2026-02-13 | 13F | Polymer Capital Management (HK) LTD | 932.407 | 59,36 | 16.494 | 43,54 | ||||
| 2026-02-12 | 13F | BlackRock, Inc. | 22.729.506 | 4,89 | 402.085 | -5,53 | ||||
| 2026-02-13 | 13F | Wells Fargo & Company/mn | 39.761 | 498,54 | 703 | 440,77 | ||||
| 2026-02-10 | 13F | Bnp Paribas Arbitrage, Sa | 1.637.639 | -10,93 | 28.970 | -19,77 | ||||
| 2026-01-22 | 13F | Massachusetts Financial Services Co /ma/ | 1.095.532 | -70,32 | 19.380 | -73,26 | ||||
| 2026-02-17 | 13F | Jain Global LLC | 0 | -100,00 | 0 | |||||
| 2026-02-17 | 13F | Voloridge Investment Management, Llc | 686.858 | 40,15 | 12.151 | 26,23 | ||||
| 2026-04-23 | 13F | North Star Investment Management Corp. | 0 | -100,00 | 0 | |||||
| 2026-02-17 | 13F | XTX Topco Ltd | 209.572 | 620,18 | 3.707 | 549,21 | ||||
| 2026-02-13 | 13F | Morgan Stanley | 2.491.632 | -31,33 | 44.077 | -38,15 | ||||
| 2026-04-30 | 13F | Csenge Advisory Group | 0 | -100,00 | 0 | |||||
| 2026-04-27 | 13F | Ping Capital Management, Inc. | 33.000 | 519 | ||||||
| 2026-01-21 | 13F | Newbridge Financial Services Group, Inc. | 0 | 0 | ||||||
| 2025-11-13 | 13F | Quadrature Capital Ltd | 0 | -100,00 | 0 | |||||
| 2026-02-10 | 13F | Bank of New York Mellon Corp | 494.743 | -1,26 | 8.752 | -11,06 | ||||
| 2026-01-23 | 13F | Assetmark, Inc | 763 | 38,73 | 13 | 30,00 | ||||
| 2026-02-02 | 13F | Van Berkom & Associates Inc. | 24.071 | -38,40 | 0 | |||||
| 2026-02-12 | 13F | Campbell & CO Investment Adviser LLC | 0 | -100,00 | 0 | |||||
| 2026-02-12 | 13F | BRYN MAWR TRUST Co | 0 | -100,00 | 0 | -100,00 | ||||
| 2026-02-17 | 13F | Public Employees Retirement System Of Ohio | 856.303 | -16,75 | 15.148 | -25,02 | ||||
| 2026-02-11 | 13F | Franklin Resources Inc | 402.347 | 5,37 | 7.118 | -5,09 | ||||
| 2026-02-12 | 13F | Penserra Capital Management LLC | 55.503 | -24,74 | 1 | -100,00 | ||||
| 2026-04-29 | 13F | Harbour Capital Advisors, LLC | 0 | -100,00 | 0 | |||||
| 2026-02-10 | 13F | Daiwa Securities Group Inc. | 44.200 | 5,24 | 1 | |||||
| 2026-02-13 | 13F | First Trust Advisors Lp | 18.857 | 27,39 | 334 | 14,83 | ||||
| 2026-02-11 | 13F | O'shaughnessy Asset Management, Llc | 425.165 | 13,03 | 7.521 | 1,81 | ||||
| 2026-04-16 | 13F | BI Asset Management Fondsmaeglerselskab A/S | 0 | -100,00 | 0 | |||||
| 2026-02-13 | 13F | Carmignac Gestion | 4.161.154 | -36,16 | 73.678 | -42,37 | ||||
| 2026-02-11 | 13F | LPL Financial LLC | 134.379 | 183,15 | 2.377 | 155,04 | ||||
| 2025-11-14 | 13F | AXA Investment Managers S.A. | 591.994 | 11.627 | ||||||
| 2026-04-13 | 13F | E Fund Management Co., Ltd. | 1.344.173 | -7,07 | 21.130 | -2,94 | ||||
| 2026-02-10 | 13F | Basepoint Wealth LLC | 395 | 7 | ||||||
| 2026-02-17 | 13F | Laird Norton Trust Company, Llc | 34.966 | 619 | ||||||
| 2026-02-17 | 13F | Tudor Investment Corp Et Al | Put | 15.400 | 272 | |||||
| 2026-02-17 | 13F | Tudor Investment Corp Et Al | 27.783 | 34,36 | 491 | 20,94 | ||||
| 2026-02-17 | 13F | Tudor Investment Corp Et Al | Call | 62.100 | 0,32 | 1.099 | -9,63 | |||
| 2026-04-07 | 13F | Park Avenue Securities Llc | 0 | -100,00 | 0 | |||||
| 2026-02-13 | 13F | Vontobel Holding Ltd. | 12.490 | -8,30 | 221 | -17,60 | ||||
| 2026-02-13 | 13F | Arrowstreet Capital, Limited Partnership | 3.803.891 | -19,01 | 67.291 | -27,05 | ||||
| 2026-04-23 | 13F | iA Global Asset Management Inc. | 0 | -100,00 | 0 | |||||
| 2026-04-10 | 13F | Abound Wealth Management | 9 | 0,00 | 0 | |||||
| 2026-04-24 | 13F | Sumitomo Mitsui DS Asset Management Company, Ltd | 15.698 | 0,00 | 247 | -11,19 | ||||
| 2026-04-29 | 13F | Police & Firemen's Retirement System of New Jersey | 38.846 | 0,00 | 611 | -11,21 | ||||
| 2026-04-07 | 13F | Farther Finance Advisors, LLC | 6.212 | -28,17 | 93 | -38,82 | ||||
| 2026-02-11 | 13F | Parallel Advisors, LLC | 6.097 | 2,49 | 108 | -7,76 | ||||
| 2026-02-13 | 13F | BNP Paribas Asset Management Holding S.A. | 461.310 | 317,57 | 8 | 300,00 | ||||
| 2026-02-17 | 13F | Brevan Howard Capital Management LP | 0 | -100,00 | 0 | |||||
| 2026-02-18 | 13F | Vident Advisory, LLC | 40.775 | 9,18 | 721 | -1,64 | ||||
| 2026-04-16 | 13F | E. Ohman J:or Asset Management AB | 21.300 | 0,00 | 335 | -11,17 | ||||
| 2026-02-04 | 13F | D'Orazio & Associates, Inc. | 16.987 | 12,36 | 301 | 1,35 | ||||
| 2026-02-12 | 13F | Brown Brothers Harriman & Co | 0 | -100,00 | 0 | |||||
| 2025-11-10 | 13F | Optiver Holding B.V. | 0 | -100,00 | 0 | -100,00 | ||||
| 2026-02-09 | 13F | Huntington National Bank | 4.541 | 0,24 | 80 | -9,09 | ||||
| 2026-02-06 | 13F | EverSource Wealth Advisors, LLC | 1.857 | 14,98 | 33 | 3,23 | ||||
| 2026-02-13 | 13F | Walleye Trading LLC | Call | 40.800 | 34,21 | 722 | 20,77 | |||
| 2026-02-13 | 13F | Walleye Trading LLC | 3.599 | -52,09 | 64 | -57,14 | ||||
| 2026-02-10 | 13F/A | Northwestern Mutual Wealth Management Co | 4.025 | 2,50 | 71 | -7,79 | ||||
| 2026-02-13 | 13F | Walleye Trading LLC | Put | 31.500 | -81,63 | 557 | -83,46 | |||
| 2026-02-13 | 13F | Verition Fund Management LLC | 35.893 | 105,20 | 635 | 84,84 | ||||
| 2026-02-11 | 13F | Jessup Wealth Management, Inc | 165 | 3 | ||||||
| 2026-02-12 | 13F | Federation des caisses Desjardins du Quebec | 70.231 | 2,71 | 1.242 | -7,45 | ||||
| 2026-02-13 | 13F | Walleye Capital LLC | 1 | 0 | ||||||
| 2026-02-13 | 13F | Cornerstone Financial Management LLC | 39 | 1 | ||||||
| 2026-02-13 | 13F | Walleye Capital LLC | Call | 8.700 | 154 | |||||
| 2026-04-28 | 13F | Alberta Investment Management Corp | 136.400 | 13,95 | 2.144 | 1,28 | ||||
| 2026-02-13 | 13F | Public Employees Retirement Association Of Colorado | 21.600 | 0,00 | 0 | |||||
| 2026-02-13 | 13F | Aurora Investment Counsel | 98.009 | -27,30 | 1.734 | -34,53 | ||||
| 2026-02-13 | 13F | Causeway Capital Management Llc | 1.089.598 | 1,19 | 19.275 | -8,86 | ||||
| 2026-02-06 | 13F | Gsa Capital Partners Llp | 71.740 | -5,59 | 1 | 0,00 | ||||
| 2026-02-10 | 13F | United Super Pty Ltd in its capacity as Trustee for the Construction & Building Unions Superannuation Fund | 199.705 | 3.533 | ||||||
| 2026-02-13 | 13F | Walleye Capital LLC | Put | 9.300 | 165 | |||||
| 2026-02-17 | 13F | Ameriprise Financial Inc | 1.705.859 | 7,87 | 30.177 | -2,84 | ||||
| 2026-02-17 | 13F | Credit Agricole S A | 59.518 | -6,30 | 1.053 | -15,64 | ||||
| 2026-02-10 | 13F | National Pension Service | 85.226 | -2,39 | 1.508 | -12,08 | ||||
| 2026-01-15 | 13F | Three Seasons Wealth, LLC | 11.212 | 198 | ||||||
| 2026-01-15 | 13F | J. Safra Sarasin Holding AG | 20.666 | 27,84 | 366 | 15,14 | ||||
| 2026-02-17 | 13F | Signature Equity Partners, LLC | 1.979 | 35 | ||||||
| 2026-04-23 | 13F | Lansforsakringar Fondforvaltning AB (publ) | 59.943 | 0,00 | 942 | -11,13 | ||||
| 2026-02-17 | 13F | Millennium Management Llc | Call | 0 | -100,00 | 0 | ||||
| 2026-02-05 | 13F | Allworth Financial LP | 588 | 8,09 | 10 | 0,00 | ||||
| 2026-02-13 | 13F | Charles Schwab Investment Management Inc | 2.137.395 | -5,18 | 37.811 | -14,60 | ||||
| 2026-02-13 | 13F | Ieq Capital, Llc | 15.915 | 1,71 | 282 | -8,47 | ||||
| 2026-02-13 | 13F | Mariner, LLC | 18.938 | 3,44 | 336 | -6,69 | ||||
| 2026-02-17 | 13F | Northern Trust Corp | 2.288.647 | -5,42 | 40.486 | -14,81 | ||||
| 2026-04-28 | 13F | DGS Capital Management, LLC | 66.542 | 13,71 | 1.046 | 1,06 | ||||
| 2026-01-28 | 13F | B. Metzler seel. Sohn & Co. AG | 66.703 | 31,79 | 1.180 | 18,61 | ||||
| 2025-11-14 | 13F | Cubist Systematic Strategies, LLC | 66.402 | 1.304 | ||||||
| 2026-04-17 | 13F | Brown, Lisle/cummings, Inc. | 31 | 0 | ||||||
| 2026-05-01 | 13F | Fifth Third Bancorp | 35.669 | 1,02 | 561 | -10,26 | ||||
| 2025-11-12 | 13F | Headlands Technologies LLC | 0 | -100,00 | 0 | |||||
| 2026-04-21 | 13F | Venturi Wealth Management, LLC | 0 | -100,00 | 0 | |||||
| 2026-02-17 | 13F | DZ BANK AG Deutsche Zentral Genossenschafts Bank, Frankfurt am Main | 3.500 | 62 | ||||||
| 2026-02-10 | 13F | Connor, Clark & Lunn Investment Management Ltd. | 12.809 | 227 | ||||||
| 2025-11-14 | 13F | Point72 (DIFC) Ltd | 0 | -100,00 | 0 | |||||
| 2026-02-10 | 13F | Gulf International Bank (UK) Ltd | 17.714 | 0,00 | 0 | |||||
| 2026-02-11 | 13F | Cerity Partners LLC | 65.673 | 2,49 | 1.162 | -7,71 | ||||
| 2026-02-17 | 13F | Bank Of America Corp /de/ | 1.006.150 | -19,57 | 17.799 | -27,56 | ||||
| 2026-01-29 | 13F | Teachers Retirement System Of The State Of Kentucky | 1.836.920 | 6,00 | 32 | -5,88 | ||||
| 2025-11-14 | 13F | Point72 Asia (Singapore) Pte. Ltd. | 10.930 | 48,91 | 215 | 94,55 | ||||
| 2026-03-12 | 13F/A | Peak6 Llc | Call | 350.000 | 16,24 | 6.192 | 4,70 | |||
| 2026-03-12 | 13F/A | Peak6 Llc | 40.568 | 718 | ||||||
| 2026-03-12 | 13F/A | Peak6 Llc | Put | 266.400 | 4.713 | |||||
| 2026-02-12 | 13F | BRIGHT VALLEY CAPITAL Ltd | 295.789 | 5.233 | ||||||
| 2026-02-13 | 13F | Smartleaf Asset Management LLC | 6.350 | 4,75 | 114 | -0,87 | ||||
| 2026-02-17 | 13F | D. E. Shaw & Co., Inc. | 392.942 | 45,73 | 6.951 | 31,27 | ||||
| 2026-02-13 | 13F | Parkside Financial Bank & Trust | 127 | 0,00 | 2 | 0,00 | ||||
| 2026-02-10 | 13F | Quantbot Technologies LP | 50.780 | 898 | ||||||
| 2026-04-28 | 13F | SBI Securities Co., Ltd. | 279 | 0,00 | 4 | 0,00 | ||||
| 2026-01-21 | 13F | Step Capital Management Pte. Ltd. | 132.141 | 2.338 | ||||||
| 2026-02-11 | 13F | Simplex Trading, Llc | Call | 83.000 | 147,76 | 1.468 | ||||
| 2026-04-30 | 13F | Nuveen, LLC | 541.377 | -4,62 | 8.510 | -15,24 | ||||
| 2026-02-11 | 13F | Simplex Trading, Llc | Put | 129.600 | -51,26 | 2.293 | 45.740,00 | |||
| 2026-02-11 | 13F | Simplex Trading, Llc | 5.761 | -92,32 | 102 | 10.000,00 | ||||
| 2026-02-06 | 13F | Abn Amro Investment Solutions | 15.629 | 48,44 | 276 | 33,98 | ||||
| 2026-02-17 | 13F | Quantinno Capital Management LP | 102.692 | 41,90 | 1.817 | 27,80 | ||||
| 2026-04-28 | 13F | Handelsbanken Fonder AB | 276.845 | 12,79 | 4 | 0,00 | ||||
| 2026-02-17 | 13F | SageView Advisory Group, LLC | 66 | 1 | ||||||
| 2026-02-17 | 13F | Edmond De Rothschild Holding S.a. | 12.000 | 0,00 | 212 | -9,79 | ||||
| 2026-04-15 | 13F | Gf Fund Management Co. Ltd. | 246.891 | 5,71 | 3.881 | -6,05 | ||||
| 2026-02-10 | 13F | Goldman Sachs Group Inc | 2.168.350 | 22,30 | 38.358 | 10,16 | ||||
| 2026-04-27 | 13F | Qrg Capital Management, Inc. | 24.033 | 5,98 | 378 | -5,99 | ||||
| 2026-02-10 | 13F | Acadian Asset Management Llc | 16.556.678 | -0,29 | 293 | -10,43 | ||||
| 2026-04-17 | 13F | AdvisorNet Financial, Inc | 0 | -100,00 | 0 | |||||
| 2026-04-22 | 13F | Pictet Asset Management Holding SA | 359.000 | -11,92 | 5.643 | -21,73 | ||||
| 2026-02-13 | 13F | Transamerica Financial Advisors, Inc. | 6.579 | 116 | ||||||
| 2026-02-11 | 13F | Prudential Plc | 1.240.584 | 15,97 | 21.946 | 4,46 | ||||
| 2026-02-13 | 13F | Ubs Asset Management Americas Inc | 2.792.794 | 23.837,55 | 49.405 | 21.473,80 | ||||
| 2026-02-12 | 13F | Dimensional Fund Advisors Lp | 8.616.834 | 1,76 | 152.493 | -8,24 | ||||
| 2026-04-30 | 13F | Private Trust Co Na | 0 | -100,00 | 0 | |||||
| 2026-02-17 | 13F | Susquehanna International Group, Llp | Call | 323.700 | -12,94 | 5.726 | -21,58 | |||
| 2026-02-17 | 13F | Susquehanna International Group, Llp | 117.620 | 53,71 | 2.081 | 38,48 | ||||
| 2026-02-17 | 13F | Clark Capital Management Group, Inc. | 2.016.405 | 116,38 | 35.670 | 94,90 | ||||
| 2026-02-17 | 13F | Susquehanna International Group, Llp | Put | 276.800 | -68,85 | 4.897 | -71,95 | |||
| 2026-04-24 | 13F | Strs Ohio | 5.660 | -9,63 | 89 | -20,00 | ||||
| 2026-02-09 | 13F | Catalyst Funds Management Pty Ltd | 88.467 | 1.565 | ||||||
| 2026-02-17 | 13F | Weiss Asset Management LP | 0 | -100,00 | 0 | -100,00 | ||||
| 2026-01-29 | 13F | Polaris Capital Management, LLC | 0 | -100,00 | 0 | |||||
| 2026-01-29 | 13F | IMC-Chicago, LLC | Put | 60.400 | -67,51 | 1.068 | -70,75 | |||
| 2026-01-29 | 13F | IMC-Chicago, LLC | Call | 117.200 | 66,71 | 2.073 | 50,22 | |||
| 2026-01-30 | 13F | Us Bancorp \de\ | 129.997 | 0,54 | 2.300 | -9,45 | ||||
| 2026-02-17 | 13F | Advisory Services Network, LLC | 13.019 | 230 | ||||||
| 2026-02-12 | 13F | Quadrant Capital Group Llc | 127.013 | 0,10 | 2.247 | -9,84 | ||||
| 2026-02-17 | 13F | Alliancebernstein L.p. | 29.441 | -7,92 | 521 | -17,07 | ||||
| 2025-11-14 | 13F | CI Private Wealth, LLC | 0 | -100,00 | 0 | -100,00 | ||||
| 2026-02-13 | 13F | American Century Companies Inc | 2.462.848 | 12,06 | 43.568 | 0,93 | ||||
| 2026-02-09 | 13F | Legal & General Group Plc | 2.435.859 | -2,01 | 43.090 | -11,74 | ||||
| 2025-11-14 | 13F | Axa S.a. | 0 | -100,00 | 0 | -100,00 | ||||
| 2026-01-08 | 13F | Nordea Investment Management Ab | 0 | -100,00 | 0 | |||||
| 2026-04-15 | 13F | Exchange Traded Concepts, Llc | 89.000 | -7,79 | 1.399 | -18,04 | ||||
| 2026-02-13 | 13F | Marshall Wace, Llp | 18.650 | 330 | ||||||
| 2026-04-30 | 13F | Cambridge Investment Research Advisors, Inc. | 0 | -100,00 | 0 | |||||
| 2025-11-06 | 13F | Ameritas Advisory Services, LLC | 0 | -100,00 | 0 | |||||
| 2026-04-16 | 13F | Diversified Trust Co | 83.413 | 0,00 | 1.311 | -11,12 | ||||
| 2026-05-01 | 13F | Commonwealth Of Pennsylvania Public School Empls Retrmt Sys | 378.830 | 0,00 | 5.955 | -11,13 | ||||
| 2026-02-17 | 13F | Delaware Management Holdings, Inc. | 336.754 | 5.957 | ||||||
| 2026-02-17 | 13F | DV Trading LLC | 3.537 | 63 | ||||||
| 2025-11-14 | 13F | Wetherby Asset Management Inc | 26.891 | -0,23 | 528 | 30,37 | ||||
| 2026-02-13 | 13F | Barclays Plc | Put | 0 | -100,00 | 0 | -100,00 | |||
| 2026-01-28 | 13F | Geneos Wealth Management Inc. | 161 | 3 | ||||||
| 2026-02-13 | 13F | Bridgefront Capital, LLC | 12.176 | 215 | ||||||
| 2026-01-26 | 13F | Cwm, Llc | 646 | -24,80 | 0 | |||||
| 2026-04-02 | 13F | Marex Group plc | 0 | 0 | ||||||
| 2026-02-12 | 13F | Aviva Plc | 235.067 | -3,63 | 4.158 | -13,19 | ||||
| 2026-02-09 | 13F | Todd Asset Management Llc | 2.766.841 | 5,80 | 48.946 | -4,70 | ||||
| 2026-04-27 | 13F | Ethic Inc. | 30.434 | -13,74 | 478 | -23,40 | ||||
| 2026-02-11 | 13F | Allianz Asset Management GmbH | 3.436.541 | 21,61 | 60.792 | 9,54 | ||||
| 2026-02-12 | 13F | Jane Street Group, Llc | 1.270.886 | 94,16 | 22.482 | 74,88 | ||||
| 2026-02-12 | 13F | Jane Street Group, Llc | Put | 45.400 | -81,83 | 803 | -83,64 | |||
| 2026-02-12 | 13F | Jane Street Group, Llc | Call | 69.100 | 53,22 | 1.222 | 38,08 | |||
| 2026-04-27 | 13F | Leonteq Securities AG | 91.610 | -24,64 | 1.440 | -33,02 | ||||
| 2026-02-13 | 13F | Toroso Investments, LLC | 44.415 | 1,49 | 786 | -8,61 | ||||
| 2026-02-17 | 13F | Man Group plc | 1.004.374 | -27,54 | 17.767 | -34,74 | ||||
| 2025-11-14 | 13F | Parallax Volatility Advisers, L.P. | Call | 0 | -100,00 | 0 | -100,00 | |||
| 2026-04-24 | 13F | Raiffeisen Bank International AG | Call | 2.835 | 0,00 | 45 | -2,22 | |||
| 2026-02-13 | 13F | Manufacturers Life Insurance Company, The | 0 | -100,00 | 0 | |||||
| 2026-02-12 | 13F | California Public Employees Retirement System | 539.058 | -8,06 | 9.536 | -17,19 | ||||
| 2026-02-06 | 13F | Lsv Asset Management | 5.939.813 | 7,51 | 105 | -2,78 | ||||
| 2026-03-31 | 13F | Sankala Group LLC | 48.459 | 0,65 | 783 | -6,68 | ||||
| 2026-02-17 | 13F | Rakuten Investment Management, Inc. | 11.689 | -59,93 | 226 | -92,14 | ||||
| 2026-01-28 | 13F | DekaBank Deutsche Girozentrale | 386.332 | 0,00 | 12 | 57,14 | ||||
| 2026-04-29 | 13F | Skopos Labs, Inc. | 26.932 | 14,92 | 423 | -6,62 | ||||
| 2026-02-12 | 13F | Commonwealth Equity Services, Llc | 37.143 | 657 | ||||||
| 2026-02-12 | 13F | Advisors Asset Management, Inc. | 27.074 | 12,13 | 479 | 0,84 | ||||
| 2025-11-21 | 13F/A | Royal Bank Of Canada | Call | 0 | -100,00 | 0 | -100,00 | |||
| 2026-02-11 | 13F | Jpmorgan Chase & Co | 1.909.922 | 0,53 | 33.787 | -9,45 | ||||
| 2026-04-16 | 13F | SG Americas Securities, LLC | 1.344.090 | 44,07 | 21 | 31,25 | ||||
| 2026-02-13 | 13F | Arkadios Wealth Advisors | 20.708 | 366 | ||||||
| 2026-02-17 | 13F | MIRAE ASSET GLOBAL ETFS HOLDINGS Ltd. | 334.856 | -9,61 | 5.924 | -18,60 | ||||
| 2026-05-01 | 13F | Thrivent Financial For Lutherans | 163.849 | -5,39 | 3 | -33,33 | ||||
| 2026-01-27 | 13F | WealthCollab, LLC | 1.581 | 0,00 | 28 | -12,90 | ||||
| 2026-04-24 | 13F | Yousif Capital Management, Llc | 14.307 | 0,00 | 225 | -8,57 | ||||
| 2026-02-17 | 13F | Jump Financial, LLC | 209.163 | 195,43 | 3.700 | 166,19 | ||||
| 2026-02-13 | 13F | Victory Capital Management Inc | 29.224 | -16,67 | 517 | -25,00 | ||||
| 2026-02-13 | 13F | Centiva Capital, LP | 19.407 | 43,51 | 343 | 29,43 | ||||
| 2026-02-12 | 13F | Steward Partners Investment Advisory, Llc | 1.000 | 0,00 | 18 | -10,53 | ||||
| 2026-02-13 | 13F | OMERS ADMINISTRATION Corp | 75.776 | 15,78 | 1.340 | 4,28 | ||||
| 2025-11-14 | 13F | Maxi Investments CY Ltd | 0 | -100,00 | 0 | |||||
| 2026-02-17 | 13F | Russell Investments Group, Ltd. | 1.546.082 | 4,84 | 27.709 | -2,33 | ||||
| 2025-11-12 | 13F | NewSquare Capital LLC | 0 | -100,00 | 0 | -100,00 | ||||
| 2026-01-27 | 13F | Zurcher Kantonalbank (Zurich Cantonalbank) | 1.079.145 | 1,63 | 19.090 | -8,45 | ||||
| 2025-11-13 | 13F | First Pacific Advisors, LP | 0 | -100,00 | 0 | |||||
| 2025-11-13 | 13F | Banco BTG Pactual S.A. | 0 | -100,00 | 0 | |||||
| 2025-11-14 | 13F | Hillhouse Capital Advisors, Ltd. | 0 | -100,00 | 0 | |||||
| 2026-02-23 | 13F | Virtu Financial LLC | 27.270 | 0 | ||||||
| 2026-01-29 | 13F | Vanguard Group Inc | 10.148.017 | 1,50 | 179.518 | -8,58 | ||||
| 2025-11-14 | 13F | Point72 Hong Kong Ltd | 64.749 | -83,40 | 1.272 | -78,35 | ||||
| 2026-02-13 | 13F | Virtus ETF Advisers LLC | 22.323 | -1,15 | 395 | -11,06 | ||||
| 2026-02-17 | 13F | Limestone Investment Advisors LP | 0 | -100,00 | 0 | |||||
| 2026-02-10 | 13F | CIBC World Markets Inc. | 22.602 | 0,00 | 400 | -9,93 | ||||
| 2026-04-30 | 13F | Sequoia Financial Advisors, LLC | 29.277 | 15,49 | 460 | 2,68 | ||||
| 2025-11-13 | 13F | Canada Pension Plan Investment Board | 0 | -100,00 | 0 | -100,00 | ||||
| 2026-02-06 | 13F | HighTower Advisors, LLC | 40.170 | 711 | ||||||
| 2026-02-12 | 13F | APG Asset Management N.V. | 187.187 | 5,64 | 2.819 | -4,80 | ||||
| 2026-01-20 | 13F | Packer & Co Ltd | 1.549.263 | 27 | ||||||
| 2026-01-26 | 13F | KBC Group NV | 140.581 | 31,60 | 2 | 0,00 | ||||
| 2026-02-10 | 13F | Exit Wealth Advisors, LLC. | 25.527 | 452 | ||||||
| 2026-05-01 | 13F | Lester Murray Antman dba SimplyRich | 143.879 | -2,60 | 2 | 0,00 | ||||
| 2026-02-11 | 13F | Fox Run Management, L.l.c. | 25.219 | 446 | ||||||
| 2026-04-20 | 13F | Assenagon Asset Management S.A. | 20.490 | 0,00 | 322 | -11,05 | ||||
| 2025-11-06 | 13F | Midwest Trust Co | 0 | -100,00 | 0 | |||||
| 2026-02-02 | 13F | Cornerstone Planning Group LLC | 175 | 464,52 | 3 | |||||
| 2026-04-30 | 13F | Hsbc Holdings Plc | 2.327.725 | 0,41 | 36.592 | -10,79 | ||||
| 2026-02-13 | 13F | Segall Bryant & Hamill, Llc | 80.500 | -5,07 | 1.424 | -14,47 | ||||
| 2026-02-10 | 13F | Envestnet Asset Management Inc | 442.004 | 131,50 | 7.819 | 108,56 | ||||
| 2026-02-12 | 13F | Swiss National Bank | 681.236 | -7,83 | 12.051 | -16,98 | ||||
| 2026-01-29 | 13F | UBS Group AG | Put | 1.100 | 0,00 | 19 | -9,52 | |||
| 2026-04-07 | 13F | Estate Planners Group, LLC | 13.483 | 239 | ||||||
| 2026-01-29 | 13F | UBS Group AG | Call | 124.100 | 0,00 | 2.195 | -9,93 | |||
| 2026-01-29 | 13F | UBS Group AG | 3.209.560 | 41,81 | 56.777 | 27,73 | ||||
| 2026-01-15 | 13F | Allspring Global Investments Holdings, LLC | 11.210 | -99,38 | 199 | -99,47 | ||||
| 2026-02-13 | 13F | Prudential Financial Inc | 272.300 | 71,91 | 4.817 | 54,86 | ||||
| 2025-11-17 | 13F | Central Asset Investments & Management Holdings (HK) Ltd | 0 | -100,00 | 0 | |||||
| 2026-04-21 | 13F | Vise Technologies, Inc. | 57.861 | 0,00 | 1.024 | 0,00 | ||||
| 2026-02-17 | 13F | Two Sigma Investments, Lp | 105.898 | -34,39 | 1.873 | -40,90 | ||||
| 2026-01-22 | 13F | Richardson Financial Services Inc. | 2.063 | 153,75 | 36 | 140,00 | ||||
| 2026-02-13 | 13F | Strategic Global Advisors, LLC | 39.985 | 13,13 | 707 | 1,87 | ||||
| 2026-01-30 | 13F | Mitsubishi UFJ Trust & Banking Corp | 1.034.607 | -12,23 | 18.302 | -20,95 | ||||
| 2026-02-10 | 13F | CIBC Asset Management Inc | 28.372 | -30,74 | 502 | -37,69 | ||||
| 2026-02-09 | 13F | Genus Capital Management Inc. | 0 | -100,00 | 0 | |||||
| 2026-02-12 | 13F | CIBC Private Wealth Group, LLC | 1.181 | 18,10 | 21 | 5,26 | ||||
| 2026-02-11 | 13F | IMA Wealth, Inc. | 95 | 2 | ||||||
| 2026-04-29 | 13F | Klp Kapitalforvaltning As | 168.200 | 0,00 | 2.644 | -11,13 | ||||
| 2026-04-24 | 13F | Raiffeisen Bank International AG | 69.700 | -0,71 | 1.115 | -11,86 | ||||
| 2025-11-10 | 13F | MAI Capital Management | 0 | -100,00 | 0 | |||||
| 2026-02-10 | 13F | Nomura Asset Management Co Ltd | 45.800 | 0,00 | 810 | -9,90 | ||||
| 2026-02-13 | 13F | Atlas Capital Advisors Llc | 7.486 | 109,87 | 132 | 149,06 | ||||
| 2026-02-11 | 13F | Deutsche Bank Ag\ | 1.058.021 | 2,06 | 18.716 | -8,07 | ||||
| 2026-04-24 | 13F | Root Financial Partners, LLC | 20 | 0 | ||||||
| 2026-05-01 | 13F | Hantz Financial Services, Inc. | 13.805 | -25,53 | 0 | |||||
| 2026-02-11 | 13F | Harvest Fund Management Co., Ltd | 182.859 | -3,26 | 3 | 0,00 | ||||
| 2026-04-13 | 13F | Hm Payson & Co | 1.309 | 0,00 | 21 | -13,04 | ||||
| 2025-11-14 | 13F | Temasek Holdings (Private) Ltd | 0 | -100,00 | 0 | |||||
| 2026-02-09 | 13F | Harbour Investments, Inc. | 36 | 0,00 | 1 | |||||
| 2026-02-13 | 13F | State Street Corp | 7.209.767 | 2,68 | 127.541 | -7,52 | ||||
| 2026-04-28 | 13F | Collaborative Fund Advisors, LLC | 13.127 | 206 | ||||||
| 2026-02-09 | 13F | Keating Financial Advisory Services, Inc. | 102 | 2 | ||||||
| 2026-04-24 | 13F | UMA Financial Services, Inc. | 120 | -1,64 | 2 | -50,00 | ||||
| 2025-11-14 | 13F | Mount Yale Investment Advisors, LLC | 0 | -100,00 | 0 | |||||
| 2026-04-20 | 13F | Ronald Blue Trust, Inc. | 172 | 6,83 | 3 | 0,00 | ||||
| 2026-04-07 | 13F | Signaturefd, Llc | 16.277 | 0,17 | 256 | -11,15 | ||||
| 2026-02-17 | 13F | Wellington Management Group Llp | 578.613 | -12,92 | 10.236 | -21,57 | ||||
| 2026-04-30 | 13F | Clear Street Markets Llc | 9.536 | 150 | ||||||
| 2026-02-17 | 13F | Susquehanna Portfolio Strategies, LLC | 560.555 | 504,07 | 9.916 | 444,24 | ||||
| 2026-04-21 | 13F | Robeco Institutional Asset Management B.V. | 12.505.064 | 14,84 | 196.580 | 2,05 | ||||
| 2025-11-14 | 13F | Wolverine Trading, Llc | Call | 30.600 | 64,52 | 584 | 107,83 | |||
| 2026-02-04 | 13F | Swiss Life Asset Management Ltd | 117.715 | 167,50 | 2.082 | 140,97 | ||||
| 2025-11-14 | 13F | Wolverine Trading, Llc | Put | 49.900 | 89,02 | 953 | 138,60 | |||
| 2026-02-13 | 13F | SRS Capital Advisors, Inc. | 1.407 | 96,78 | 25 | 71,43 | ||||
| 2026-04-27 | 13F | Cooper Investors Pty Ltd | 0 | -100,00 | 0 | |||||
| 2026-02-13 | 13F | Squarepoint Ops LLC | 214.559 | 3.796 | ||||||
| 2026-02-13 | 13F | National Bank Of Canada /fi/ | 151.500 | -93,48 | 2.680 | -94,13 | ||||
| 2026-04-24 | 13F | IFM Investors Pty Ltd | 28.452 | 0,00 | 447 | |||||
| 2025-11-07 | 13F | Shell Asset Management Co | 19.279 | -40,69 | 0 | |||||
| 2026-04-13 | 13F | Trust Co | 19 | 0,00 | 0 | |||||
| 2026-04-08 | 13F | E Fund Management (Hong Kong) Co., Ltd. | 121.667 | -2,44 | 1.913 | -11,07 | ||||
| 2026-02-05 | 13F | DnB Asset Management AS | 53.337 | -26,57 | 944 | -33,87 | ||||
| 2026-02-17 | 13F | Jones Financial Companies Lllp | 6.653 | 8.770,67 | 118 | 11.600,00 | ||||
| 2026-04-24 | 13F | Abacus Wealth Partners, LLC | 32.033 | -7,80 | 504 | -18,08 | ||||
| 2026-01-28 | 13F | Legacy Capital Group California, Inc. | 28.091 | 8,76 | 497 | -2,17 |