Grundlæggende statistik
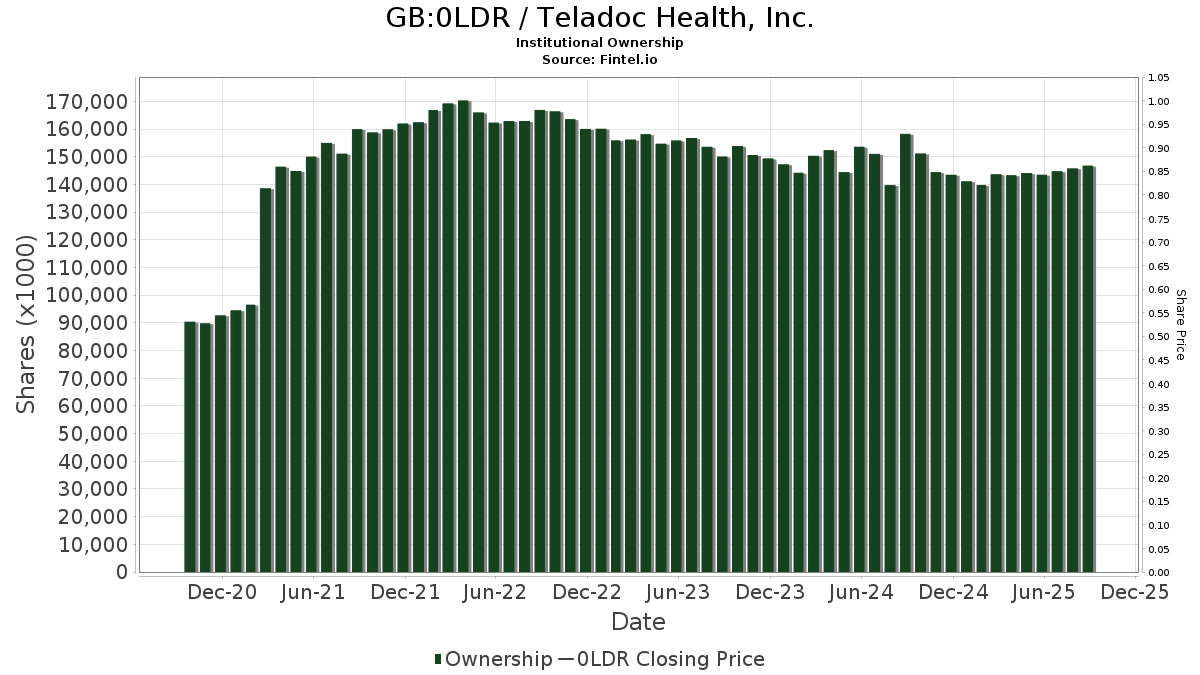
| Institutionelle aktier (lange) | 132.827.588 - 73,62% (ex 13D/G) - change of -10,77MM shares -7,50% MRQ |
| Institutionel værdi (lang) | $ 910.756 USD ($1000) |
Institutionelt ejerskab og aktionærer
Teladoc Health, Inc. (GB:0LDR) har 357 institutionelle ejere og aktionærer, der har indsendt 13D/G- eller 13F-formularer til Securities Exchange Commission (SEC). Disse institutioner har i alt 132,827,588 aktier. Største aktionærer omfatter Vanguard Group Inc, BlackRock, Inc., Renaissance Technologies Llc, Dimensional Fund Advisors Lp, Point72 Asset Management, L.P., State Street Corp, Geode Capital Management, Llc, Jupiter Asset Management Ltd, Susquehanna International Group, Llp, and Allianz Asset Management GmbH .
Teladoc Health, Inc. (LSE:0LDR) institutionel ejerskabsstruktur viser aktuelle positioner i virksomheden efter institutioner og fonde, samt seneste ændringer i positionsstørrelse. Større aktionærer kan omfatte individuelle investorer, investeringsforeninger, hedgefonde eller institutioner. Skema 13D angiver, at investoren besidder (eller besidder) mere end 5 % af virksomheden og har til hensigt (eller har til hensigt at) aktivt at forfølge en ændring i forretningsstrategi. Skema 13G indikerer en passiv investering på over 5%.
The share price as of April 23, 2026 is 5,83 / share. Previously, on April 28, 2025, the share price was 7,08 / share. This represents a decline of 17,71% over that period.
Fondens stemningsscore
Fund Sentiment Score (fka Ownership Accumulation Score) finder de aktier, der bliver mest købt af fonde. Det er resultatet af en sofistikeret, multi-faktor kvantitativ model, der identificerer virksomheder med de højeste niveauer af institutionel akkumulering. Scoringsmodellen bruger en kombination af den samlede stigning i oplyste ejere, ændringerne i porteføljeallokeringer i disse ejere og andre målinger. Tallet går fra 0 til 100, hvor højere tal indikerer et højere niveau af akkumulering for sine jævnaldrende, og 50 er gennemsnittet.
Opdateringsfrekvens: Dagligt
Se Ownership Explorer, som giver en liste over højest rangerende virksomheder.
AI+ Ask Fintel’s AI assistant about Teladoc Health, Inc..
Select a question to share a public post with an AI-crafted answer.
Thinking of good questions…
13F og NPORT arkivering
Detaljer om 13F-arkivering er gratis. Detaljer om NP-ansøgninger kræver et premium-medlemskab. Grønne rækker angiver nye positioner. Røde rækker angiver lukkede positioner. Klik på linket ikon for at se den fulde transaktionshistorik.
Opgrader
for at låse premium-data op og eksportere til Excel ![]() .
.
| Fil dato | Kilde | Investor | Type | Gennemsnitlig pris (Øst) |
Aktier | Δ Aktier (%) |
Rapporteret Værdi ($1000) |
Δ Værdi (%) |
Port Alloc (%) |
|
|---|---|---|---|---|---|---|---|---|---|---|
| 2026-01-29 | 13F | Vanguard Group Inc | 21.483.707 | -1,95 | 150.386 | -11,21 | ||||
| 2026-04-08 | 13F | DiNuzzo Private Wealth, Inc. | 0 | -100,00 | 0 | |||||
| 2026-02-17 | 13F | Summit Trail Advisors, Llc | 82.486 | 57,49 | 577 | 42,82 | ||||
| 2026-01-14 | 13F | ORG Wealth Partners, LLC | 23 | 0,00 | 0 | |||||
| 2026-02-13 | 13F | Vontobel Holding Ltd. | 30.954 | 135,86 | 217 | 113,86 | ||||
| 2026-01-15 | 13F | Capital Advisors Inc/ok | 0 | -100,00 | 0 | |||||
| 2026-02-13 | 13F | Natixis | 94.400 | 661 | ||||||
| 2025-11-13 | 13F | Capital Fund Management S.a. | Put | 0 | -100,00 | 0 | -100,00 | |||
| 2026-02-11 | 13F | Jessup Wealth Management, Inc | 61 | 0 | ||||||
| 2025-11-10 | 13F | Optiver Holding B.V. | 0 | -100,00 | 0 | |||||
| 2026-03-27 | 13F | Prosperity Wealth Management, Inc. | 0 | -100,00 | 0 | -100,00 | ||||
| 2026-02-13 | 13F | Sei Investments Co | 74.130 | -23,80 | 519 | -31,12 | ||||
| 2026-04-20 | 13F | State of Alaska, Department of Revenue | 9.777 | 0,00 | 0 | |||||
| 2026-02-11 | 13F | Krane Funds Advisors LLC | 16.220 | 30,48 | 114 | 6,60 | ||||
| 2026-02-17 | 13F | Aquatic Capital Management LLC | 493.250 | 3.453 | ||||||
| 2026-02-17 | 13F | Oxford Asset Management Llp | 28.559 | 200 | ||||||
| 2026-02-18 | 13F | Vident Advisory, LLC | 10.412 | 2,91 | 73 | -7,69 | ||||
| 2026-02-13 | 13F | Kestra Advisory Services, LLC | 0 | -100,00 | 0 | |||||
| 2026-04-16 | 13F | SG Americas Securities, LLC | 1.261.856 | -2,72 | 7 | -33,33 | ||||
| 2026-02-17 | 13F | Ancora Advisors, LLC | 2.242 | 16 | ||||||
| 2026-02-13 | 13F | Arkadios Wealth Advisors | 11.727 | -3,37 | 82 | -11,83 | ||||
| 2026-01-16 | 13F | Hopwood Financial Services, Inc. | 0 | -100,00 | 0 | |||||
| 2026-02-13 | 13F | First Trust Advisors Lp | 214.497 | 1.501 | ||||||
| 2026-02-17 | 13F | Balyasny Asset Management Llc | 58.370 | 15,94 | 409 | 4,88 | ||||
| 2026-02-17 | 13F | Balyasny Asset Management Llc | Put | 144.600 | 0,00 | 1.012 | -9,40 | |||
| 2026-01-30 | 13F | Mitsubishi UFJ Trust & Banking Corp | 159.788 | 15,39 | 1.119 | 4,49 | ||||
| 2026-02-02 | 13F | Montag A & Associates Inc | 5.740 | 0,00 | 40 | -9,09 | ||||
| 2026-02-17 | 13F | Algert Global Llc | 221.140 | 2 | ||||||
| 2026-02-17 | 13F | Balyasny Asset Management Llc | Call | 50.000 | -50,00 | 350 | -54,72 | |||
| 2026-01-21 | 13F | Modera Wealth Management, LLC | 11.207 | -49,76 | 78 | -54,65 | ||||
| 2026-02-13 | 13F | Arete Wealth Advisors, LLC | 13.798 | 0,00 | 0 | |||||
| 2026-02-09 | 13F | Geode Capital Management, Llc | 4.188.313 | 0,44 | 29.324 | -9,04 | ||||
| 2026-01-28 | 13F | Universal- Beteiligungs- und Servicegesellschaft mbH | 373.363 | 1,71 | 2.614 | -7,90 | ||||
| 2026-02-11 | 13F | Franklin Resources Inc | 466.494 | 9,55 | 3.265 | -0,79 | ||||
| 2026-02-06 | 13F | Global Retirement Partners, LLC | Call | 0 | -100,00 | 0 | ||||
| 2026-02-12 | 13F | Wealthspire Advisors, LLC | 0 | -100,00 | 0 | |||||
| 2026-02-12 | 13F | Cibc World Markets Corp | 11.777 | -45,66 | 82 | -56,38 | ||||
| 2026-03-16 | 13F/A | Rockefeller Capital Management L.P. | 3.810 | -24,33 | 27 | -31,58 | ||||
| 2026-02-03 | 13F | Winch Advisory Services, LLC | 62 | 0,00 | 0 | |||||
| 2026-04-14 | 13F | Thurston, Springer, Miller, Herd & Titak, Inc. | 278 | 0,00 | 2 | 0,00 | ||||
| 2026-02-23 | 13F | Mv Capital Management, Inc. | 59 | -15,71 | 0 | |||||
| 2025-10-27 | 13F | Belvedere Trading LLC | 0 | -100,00 | 0 | |||||
| 2026-01-30 | 13F | Urban Wealth Management, LLC | 0 | -100,00 | 0 | -100,00 | ||||
| 2026-02-09 | 13F | Murphy Pohlad Asset Management LLC | 0 | -100,00 | 0 | |||||
| 2026-02-17 | 13F | XTX Topco Ltd | 0 | -100,00 | 0 | |||||
| 2026-02-17 | 13F | Atom Investors LP | 20.310 | -76,90 | 142 | -79,09 | ||||
| 2026-02-05 | 13F | Cambridge Investment Research Advisors, Inc. | 34.374 | -18,91 | 0 | |||||
| 2026-02-12 | 13F | Principal Securities, Inc. | 0 | -100,00 | 0 | |||||
| 2026-02-11 | 13F | Strategic Advocates LLC | 2 | -75,00 | 0 | |||||
| 2026-02-05 | 13F | HFM Investment Advisors, LLC | 2 | -83,33 | 0 | |||||
| 2026-02-17 | 13F | Quadrature Capital Ltd | 27.065 | -9,24 | 189 | -17,83 | ||||
| 2025-11-14 | 13F | Petrus Trust Company, LTA | 0 | -100,00 | 0 | |||||
| 2026-02-05 | 13F | Qsemble Capital Management, LP | 0 | -100,00 | 0 | -100,00 | ||||
| 2026-02-13 | 13F | Van Eck Associates Corp | 9.150 | 101,41 | 0 | |||||
| 2025-11-06 | 13F | Baader Bank INC | 0 | -100,00 | 0 | |||||
| 2026-04-13 | 13F | IFP Advisors, Inc | 811 | 30,39 | 4 | 0,00 | ||||
| 2026-02-12 | 13F | Commonwealth Equity Services, Llc | 110.532 | -3,57 | 774 | |||||
| 2026-04-14 | 13F | Bay Harbor Wealth Management, LLC | 0 | -100,00 | 0 | |||||
| 2026-02-17 | 13F | Aqr Capital Management Llc | 222.362 | 7,39 | 1.552 | -3,00 | ||||
| 2026-04-13 | 13F | Massmutual Trust Co Fsb/adv | 0 | -100,00 | 0 | |||||
| 2026-01-15 | 13F | Nisa Investment Advisors, Llc | 1.812 | -2,74 | 13 | -14,29 | ||||
| 2026-02-13 | 13F/A | Virtus ETF Advisers LLC | 0 | -100,00 | 0 | -100,00 | ||||
| 2026-02-17 | 13F | Tower Research Capital LLC (TRC) | 2.058 | -78,76 | 14 | -81,08 | ||||
| 2025-10-27 | 13F | First Horizon Corp | 0 | -100,00 | 0 | |||||
| 2026-01-30 | 13F | Torren Management, LLC | 1.938 | 14 | ||||||
| 2026-02-11 | 13F | 111 Capital | 0 | -100,00 | 0 | -100,00 | ||||
| 2026-02-17 | 13F | Trexquant Investment LP | 1.307.952 | 9.156 | ||||||
| 2026-04-13 | 13F | St Germain D J Co Inc | 39 | 0,00 | 0 | |||||
| 2026-02-17 | 13F | Mercer Global Advisors Inc /adv | 15.150 | -72,31 | 106 | -74,88 | ||||
| 2026-01-07 | 13F | Aventura Private Wealth, LLC | 400 | -14,89 | 3 | -33,33 | ||||
| 2026-02-10 | 13F | Goldman Sachs Group Inc | 1.924.533 | -23,72 | 13.472 | -30,93 | ||||
| 2026-02-03 | 13F | McIlrath & Eck, LLC | 101 | 0,00 | 1 | |||||
| 2026-02-17 | 13F | Moore Capital Management, Lp | 248.521 | 1.740 | ||||||
| 2026-02-02 | 13F | Manhattan West Asset Management, LLC | 0 | -100,00 | 0 | -100,00 | ||||
| 2026-02-13 | 13F | Y-Intercept (Hong Kong) Ltd | 0 | -100,00 | 0 | |||||
| 2026-02-13 | 13F | Public Employees Retirement Association Of Colorado | 19.346 | 0,00 | 0 | |||||
| 2026-01-28 | 13F | Barrett & Company, Inc. | 30 | -86,96 | 0 | -100,00 | ||||
| 2026-02-13 | 13F | Pin Oak Investment Advisors Inc | 21.928 | 0,00 | 0 | -100,00 | ||||
| 2026-02-17 | 13F | Bank Of America Corp /de/ | 409.177 | -38,15 | 2.864 | -44,00 | ||||
| 2026-02-17 | 13F | Caption Management, LLC | Put | 0 | -100,00 | 0 | -100,00 | |||
| 2026-02-17 | 13F | Woodline Partners LP | 0 | -100,00 | 0 | |||||
| 2026-04-22 | 13F | Sterling Capital Management LLC | 11.067 | -38,85 | 60 | -52,38 | ||||
| 2026-02-17 | 13F | Radcliffe Capital Management, L.P. | 201.300 | -23,29 | 1.409 | -30,52 | ||||
| 2026-02-10 | 13F | Rothschild Investment Llc | 41 | -59,00 | 0 | |||||
| 2026-03-12 | 13F | Nalls Sherbakoff Group, Llc | 0 | 0 | ||||||
| 2026-02-04 | 13F | Fourth Dimension Wealth, LLC | 46 | 0,00 | 0 | |||||
| 2026-02-11 | 13F | DCF Advisers, LLC | 137.500 | 292,86 | 962 | 256,30 | ||||
| 2026-02-05 | 13F | Mission Wealth Management, Lp | 15.879 | 0,94 | 111 | -8,26 | ||||
| 2026-02-05 | 13F | 1620 Investment Advisors, Inc. | 6.422 | -4,45 | 45 | -13,73 | ||||
| 2025-11-14 | 13F | Wood Tarver Financial Group, LLC | 0 | -100,00 | 0 | |||||
| 2026-01-21 | 13F | Impact Investors, Inc | 12.571 | -16,58 | 88 | -25,00 | ||||
| 2026-02-05 | 13F | LGT Group Foundation | 0 | -100,00 | 0 | |||||
| 2026-04-21 | 13F | PharVision Advisers, LLC | 0 | -100,00 | 0 | |||||
| 2026-02-10 | 13F | Monaco Asset Management SAM | 1.956.947 | 159,20 | 13.699 | 134,72 | ||||
| 2026-02-10 | 13F | Intech Investment Management Llc | 61.481 | 0,00 | 430 | -9,47 | ||||
| 2026-01-26 | 13F | Cwm, Llc | 5.887 | 9,83 | 0 | |||||
| 2026-02-17 | 13F | Engineers Gate Manager LP | 327.336 | 51,57 | 2.291 | 37,27 | ||||
| 2026-02-04 | 13F | Twin Lakes Capital Management, LLC | 3.142 | 0,00 | 22 | -12,50 | ||||
| 2025-11-12 | 13F | Transce3nd, LLC | 0 | -100,00 | 0 | |||||
| 2025-10-28 | 13F | CarsonAllaria Wealth Management, Ltd. | 0 | -100,00 | 0 | |||||
| 2026-02-13 | 13F | Verition Fund Management LLC | 343.916 | 57,35 | 2.407 | 42,51 | ||||
| 2026-02-17 | 13F | D. E. Shaw & Co., Inc. | Call | 0 | -100,00 | 0 | -100,00 | |||
| 2026-02-05 | 13F | Td Private Client Wealth Llc | 0 | -100,00 | 0 | |||||
| 2026-01-30 | 13F | Bogart Wealth, LLC | 72 | 0,00 | 1 | |||||
| 2026-02-17 | 13F | Parallax Volatility Advisers, L.P. | 0 | -100,00 | 0 | |||||
| 2025-11-03 | 13F | Pilgrim Partners Asia Pte Ltd | 0 | -100,00 | 0 | |||||
| 2026-02-17 | 13F | Tudor Investment Corp Et Al | Call | 127.700 | 894 | |||||
| 2026-04-15 | 13F | Fortitude Family Office, LLC | 0 | -100,00 | 0 | |||||
| 2026-04-17 | 13F | Brave Asset Management Inc | 0 | -100,00 | 0 | |||||
| 2026-01-20 | 13F | Cigna Investments Inc /new | 107.851 | 0,00 | 1 | |||||
| 2026-02-11 | 13F | Simplex Trading, Llc | Put | 591.600 | 22,87 | 4.141 | 137.933,33 | |||
| 2026-02-13 | 13F | National Bank Of Canada /fi/ | 3.748 | 11,55 | 26 | 4,00 | ||||
| 2026-02-12 | 13F | Brown Brothers Harriman & Co | 506 | 119,05 | 4 | 200,00 | ||||
| 2026-02-13 | 13F | Bridgewater Associates, LP | 634.479 | 31,16 | 4.441 | 18,78 | ||||
| 2026-02-11 | 13F | Simplex Trading, Llc | 231.680 | -49,79 | 1.622 | 53.933,33 | ||||
| 2026-02-26 | 13F/A | Banque Transatlantique SA | 160 | 0,00 | 1 | 0,00 | ||||
| 2026-02-11 | 13F | Simplex Trading, Llc | Call | 551.800 | -7,03 | 3.863 | 96.450,00 | |||
| 2026-02-17 | 13F | Align Financial, LLC | 700 | 1 | ||||||
| 2026-02-12 | 13F | Johnson Financial Group, Inc. | 0 | -100,00 | 0 | |||||
| 2026-02-13 | 13F | Walleye Capital LLC | Call | 0 | -100,00 | 0 | -100,00 | |||
| 2026-02-18 | 13F | Vermillion & White Wealth Management Group, LLC | 5 | 0 | ||||||
| 2026-02-17 | 13F | Lazard Asset Management Llc | 6.939 | 0,00 | 49 | -9,43 | ||||
| 2026-02-17 | 13F | Price T Rowe Associates Inc /md/ | 204.905 | 14,55 | 1 | 0,00 | ||||
| 2026-04-23 | 13F | North Star Investment Management Corp. | 10 | 0,00 | 0 | |||||
| 2025-11-14 | 13F | Capstone Investment Advisors, Llc | 25.040 | 194 | ||||||
| 2026-02-06 | 13F | EverSource Wealth Advisors, LLC | 712 | 18,47 | 5 | 0,00 | ||||
| 2026-02-13 | 13F | Walleye Capital LLC | 0 | -100,00 | 0 | -100,00 | ||||
| 2026-02-02 | 13F | Danske Bank A/s | 1.400 | 0,00 | 10 | -10,00 | ||||
| 2026-02-17 | 13F | Crawford Fund Management, LLC | Put | 214.000 | -38,68 | 1.498 | -44,46 | |||
| 2026-02-12 | 13F | Cloud Capital Management, LLC | 0 | -100,00 | 0 | |||||
| 2026-02-12 | 13F | Voya Investment Management Llc | 390.381 | 47,07 | 2.733 | 33,20 | ||||
| 2026-02-10 | 13F | Bank of New York Mellon Corp | 621.353 | -1,31 | 4.349 | -10,62 | ||||
| 2026-02-02 | 13F | Principal Financial Group Inc | 588.075 | 52,78 | 4.117 | 38,35 | ||||
| 2025-11-14 | 13F | Qube Research & Technologies Ltd | 0 | -100,00 | 0 | |||||
| 2026-02-13 | 13F | Walleye Capital LLC | Put | 0 | -100,00 | 0 | -100,00 | |||
| 2025-11-07 | 13F | Sierra Ocean, Llc | 0 | -100,00 | 0 | |||||
| 2025-11-04 | 13F | Guerra Advisors Inc | 5 | 0 | ||||||
| 2025-11-14 | 13F | Credit Agricole S A | 0 | -100,00 | 0 | -100,00 | ||||
| 2026-02-12 | 13F | Ensign Peak Advisors, Inc | 13.088 | -72,09 | 92 | -74,86 | ||||
| 2026-01-28 | 13F | CAPROCK Group, Inc. | 19.793 | -23,70 | 139 | -31,00 | ||||
| 2026-02-10 | 13F | Bnp Paribas | 120 | 0,00 | 1 | |||||
| 2026-02-14 | 13F | Whipplewood Advisors, LLC | 200 | 0,00 | 1 | 0,00 | ||||
| 2026-02-17 | 13F | Boreal Capital Management LLC | 60 | 0,00 | 0 | |||||
| 2025-11-04 | 13F | Raleigh Capital Management Inc. | 0 | -100,00 | 0 | |||||
| 2026-02-17 | 13F | Twinbeech Capital Lp | 149.300 | -24,12 | 1.045 | -31,25 | ||||
| 2026-03-12 | 13F/A | Peak6 Llc | 68.750 | 481 | ||||||
| 2026-03-12 | 13F/A | Peak6 Llc | Call | 111.300 | -64,07 | 779 | -67,46 | |||
| 2026-02-13 | 13F | Colony Group, LLC | 19.124 | 134 | ||||||
| 2026-02-17 | 13F | Tcw Group Inc | 446.797 | 0,00 | 3.128 | -9,44 | ||||
| 2026-02-11 | 13F | SOUTH STATE Corp | 0 | -100,00 | 0 | |||||
| 2026-02-17 | 13F | Royal Bank Of Canada | 103.208 | -18,72 | 722 | -26,48 | ||||
| 2026-02-12 | 13F | Colonial Trust Advisors | 1.100 | 0,00 | 8 | -12,50 | ||||
| 2026-01-29 | 13F | Sanctuary Advisors, LLC | 0 | -100,00 | 0 | -100,00 | ||||
| 2025-11-07 | 13F | Shell Asset Management Co | 1.499 | -65,88 | 0 | |||||
| 2026-04-17 | 13F | AdvisorNet Financial, Inc | 50 | 0,00 | 0 | |||||
| 2026-04-22 | 13F | Pictet Asset Management Holding SA | 33.439 | 26,92 | 182 | -1,09 | ||||
| 2026-02-11 | 13F | Ameritas Investment Partners, Inc. | 14.694 | 103 | ||||||
| 2026-02-13 | 13F | Golden State Wealth Management, LLC | 41 | -59,80 | 0 | |||||
| 2025-11-14 | 13F | Cubist Systematic Strategies, LLC | 7.760 | -98,95 | 60 | -99,08 | ||||
| 2026-02-12 | 13F | Hrt Financial Lp | 0 | -100,00 | 0 | |||||
| 2026-02-17 | 13F | EFG International AG | 2.784 | 19 | ||||||
| 2026-04-07 | 13F | Eastern Bank | 2 | 0,00 | 0 | |||||
| 2026-02-10 | 13F | Jupiter Asset Management Ltd | 3.860.076 | 293,86 | 27.021 | 256,70 | ||||
| 2026-01-30 | 13F | Catalytic Wealth RIA, LLC | 26.484 | -5,66 | 185 | -14,75 | ||||
| 2026-02-02 | 13F | Equitable Trust Co | 60.772 | 0,00 | 425 | -9,38 | ||||
| 2026-02-10 | 13F | Axq Capital, Lp | 0 | -100,00 | 0 | |||||
| 2025-11-05 | 13F | Envestnet Asset Management Inc | 0 | -100,00 | 0 | -100,00 | ||||
| 2026-04-09 | 13F | Pacifica Partners Inc. | 60 | 0,00 | 0 | |||||
| 2026-02-13 | 13F | Gen-Wealth Partners Inc | 34 | 0,00 | 0 | |||||
| 2026-02-10 | 13F | Sittner & Nelson, Llc | 400 | 0,00 | 2 | -33,33 | ||||
| 2026-02-10 | 13F | Acadian Asset Management Llc | 41.224 | -92,82 | 0 | -100,00 | ||||
| 2026-02-11 | 13F | Group One Trading, L.p. | Put | 370.900 | 139,14 | 2.596 | 116,69 | |||
| 2026-02-11 | 13F | Group One Trading, L.p. | 152.199 | 11,34 | 1.065 | 0,85 | ||||
| 2025-11-13 | 13F | Connor, Clark & Lunn Investment Management Ltd. | 0 | -100,00 | 0 | -100,00 | ||||
| 2026-02-11 | 13F | Group One Trading, L.p. | Call | 655.000 | -17,95 | 4.585 | -25,69 | |||
| 2026-02-17 | 13F | Sig Brokerage, Lp | Call | 10.000 | 70 | |||||
| 2026-04-20 | 13F | Banque Cantonale Vaudoise | 0 | -100,00 | 0 | |||||
| 2026-01-29 | 13F | IMC-Chicago, LLC | 235.521 | -61,06 | 1.649 | -64,75 | ||||
| 2026-01-29 | 13F | IMC-Chicago, LLC | Put | 728.000 | -31,34 | 5.096 | -37,82 | |||
| 2026-01-29 | 13F | IMC-Chicago, LLC | Call | 986.800 | -6,21 | 6.908 | -15,06 | |||
| 2026-03-20 | 13F | Purpose Unlimited Inc. | 51 | 0 | ||||||
| 2026-02-03 | 13F | SBI Securities Co., Ltd. | 25.231 | -3,32 | 177 | -12,44 | ||||
| 2025-11-19 | 13F | Caitong International Asset Management Co., Ltd | 0 | -100,00 | 0 | |||||
| 2026-02-13 | 13F | Centiva Capital, LP | 20.000 | 140 | ||||||
| 2026-02-13 | 13F | Victory Capital Management Inc | 20.210 | -89,03 | 141 | -90,09 | ||||
| 2026-02-18 | 13F | Strategic Planning, Inc. | 0 | -100,00 | 0 | -100,00 | ||||
| 2026-02-17 | 13F | Vinva Investment Management Ltd | 34.985 | 365 | ||||||
| 2026-02-13 | 13F | Smartleaf Asset Management LLC | 1.151 | 1.756,45 | 8 | |||||
| 2026-02-12 | 13F | Campbell & CO Investment Adviser LLC | 0 | -100,00 | 0 | |||||
| 2025-11-10 | 13F | Raiffeisen Bank International AG | 0 | -100,00 | 0 | -100,00 | ||||
| 2026-02-04 | 13F | Dogwood Wealth Management LLC | 141 | 0,00 | 1 | -100,00 | ||||
| 2026-02-17 | 13F | SageView Advisory Group, LLC | 336 | 2 | ||||||
| 2026-02-17 | 13F | Advisory Services Network, LLC | 0 | -100,00 | 0 | |||||
| 2026-04-23 | 13F | Oppenheimer & Co Inc | 182.743 | 30,01 | 996 | 1,22 | ||||
| 2026-01-23 | 13F | Westside Investment Management, Inc. | 11.750 | 4,44 | 82 | -4,65 | ||||
| 2026-02-11 | 13F | Allianz Asset Management GmbH | 3.115.191 | 92,37 | 21.806 | 74,21 | ||||
| 2026-02-17 | 13F | Jones Financial Companies Lllp | 9.266 | 32,47 | 65 | 12,28 | ||||
| 2025-11-03 | 13F | Archer Investment Corp | 0 | -100,00 | 0 | |||||
| 2026-02-09 | 13F | Hartland & Co., LLC | 2.090 | -5,64 | 15 | -17,65 | ||||
| 2026-01-29 | 13F | UBS Group AG | Put | 0 | -100,00 | 0 | -100,00 | |||
| 2026-01-20 | 13F | Wealth Management Associates, Inc. | 30.575 | -54,72 | 214 | -58,93 | ||||
| 2026-02-12 | 13F | Nuveen, LLC | 2.659.662 | 38,71 | 18.618 | 25,61 | ||||
| 2026-04-13 | 13F | Mather Group, Llc. | 5 | 0 | ||||||
| 2026-02-13 | 13F | American Century Companies Inc | 3.089.316 | 509,23 | 21.625 | 451,80 | ||||
| 2026-02-17 | 13F | Northern Trust Corp | 1.727.509 | -4,97 | 12.093 | -13,95 | ||||
| 2026-04-07 | 13F | CoreCap Advisors, LLC | 411 | 0,00 | 2 | 0,00 | ||||
| 2026-04-08 | 13F | Wealth Enhancement Advisory Services, Llc | 55.835 | 207,24 | 294 | 102,76 | ||||
| 2025-11-13 | 13F | MYDA Advisors LLC | 0 | -100,00 | 0 | |||||
| 2026-02-17 | 13F | Guggenheim Capital Llc | 0 | -100,00 | 0 | |||||
| 2025-11-12 | 13F | Brucke Financial, Inc. | 0 | -100,00 | 0 | |||||
| 2026-02-13 | 13F | Marshall Wace, Llp | Put | 500 | 4 | |||||
| 2026-02-13 | 13F | Marshall Wace, Llp | Call | 3.000 | 21 | |||||
| 2026-02-13 | 13F | Marshall Wace, Llp | 61.924 | 433 | ||||||
| 2026-02-17 | 13F | Quantinno Capital Management LP | 1.149.747 | 3,40 | 8.048 | -6,36 | ||||
| 2026-04-23 | 13F | Harbor Investment Advisory, Llc | 600 | 0,00 | 3 | -25,00 | ||||
| 2026-02-17 | 13F | Two Sigma Investments, Lp | 677.555 | -40,13 | 4.743 | -45,79 | ||||
| 2026-01-28 | 13F | DekaBank Deutsche Girozentrale | 69.450 | 0,00 | 1 | |||||
| 2026-02-13 | 13F | Parkside Financial Bank & Trust | 85 | 1 | ||||||
| 2026-02-11 | 13F | Havemeyer Place LP | 117.679 | 824 | ||||||
| 2026-02-12 | 13F | Dimensional Fund Advisors Lp | 7.494.255 | 8,78 | 52.459 | -1,50 | ||||
| 2025-10-27 | 13F | PKO Investment Management Joint-Stock Co | 0 | -100,00 | 0 | |||||
| 2026-04-20 | 13F | Hilton Head Capital Partners, LLC | 230 | 0,00 | 1 | 0,00 | ||||
| 2026-02-09 | 13F | Optimize Financial Inc | 55.115 | 1,46 | 386 | -8,11 | ||||
| 2026-02-13 | 13F | Squarepoint Ops LLC | Call | 12.300 | 5,13 | 86 | -4,44 | |||
| 2026-01-05 | 13F | Chesapeake Asset Management Llc | 0 | -100,00 | 0 | -100,00 | ||||
| 2026-02-17 | 13F | Alliancebernstein L.p. | 511.555 | 0,00 | 3.581 | -9,46 | ||||
| 2026-02-12 | 13F | Xponance, Inc. | 14.188 | 1,99 | 99 | -7,48 | ||||
| 2026-01-26 | 13F | Private Trust Co Na | 416 | 0,00 | 3 | -33,33 | ||||
| 2026-02-09 | 13F | Hantz Financial Services, Inc. | 18 | 0,00 | 0 | |||||
| 2025-11-14 | 13F | Squarepoint Ops LLC | 0 | -100,00 | 0 | -100,00 | ||||
| 2026-01-22 | 13F | Massachusetts Financial Services Co /ma/ | 289.049 | -3,20 | 2.023 | -12,35 | ||||
| 2026-02-17 | 13F | D. E. Shaw & Co., Inc. | 541.280 | 83,84 | 3.789 | 66,51 | ||||
| 2026-02-17 | 13F | Point72 Asset Management, L.P. | Call | 38.300 | 268 | |||||
| 2026-02-09 | 13F | Avalon Trust Co | 0 | -100,00 | 0 | |||||
| 2026-04-21 | 13F | GHP Investment Advisors, Inc. | 24 | 0,00 | 0 | |||||
| 2026-02-09 | 13F | Legal & General Group Plc | 207.124 | -6,90 | 1.450 | -15,71 | ||||
| 2026-02-17 | 13F | CastleKnight Management LP | 66.300 | -74,94 | 464 | -77,31 | ||||
| 2026-02-17 | 13F | Point72 Asset Management, L.P. | 5.661.322 | -1,77 | 39.629 | -11,05 | ||||
| 2026-01-28 | 13F | Teacher Retirement System Of Texas | 0 | -100,00 | 0 | -100,00 | ||||
| 2025-11-14 | 13F | WealthTrak Capital Management LLC | 0 | -100,00 | 0 | |||||
| 2025-12-09 | 13F | Swiss Life Asset Management Ltd | 0 | -100,00 | 0 | -100,00 | ||||
| 2026-01-30 | 13F | Us Bancorp \de\ | 1.069 | -37,81 | 7 | -46,15 | ||||
| 2026-01-23 | 13F | Optima Capital Llc | 109 | 1 | ||||||
| 2026-02-17 | 13F | Public Employees Retirement System Of Ohio | 3.617 | 3,46 | 25 | -7,41 | ||||
| 2026-02-13 | 13F | Neuberger Berman Group LLC | 12.057 | 84 | ||||||
| 2026-02-17 | 13F | D. E. Shaw & Co., Inc. | Put | 99.900 | -52,41 | 699 | -56,91 | |||
| 2026-02-13 | 13F | Ubs Asset Management Americas Inc | 412.900 | 8,82 | 2.890 | -1,47 | ||||
| 2026-02-17 | 13F | Man Group plc | 1.620.633 | 113,75 | 11.344 | 93,58 | ||||
| 2025-11-04 | 13F | Pineridge Advisors LLC | 4 | 0,00 | 0 | |||||
| 2026-02-17 | 13F | Voloridge Investment Management, Llc | 997.427 | 42,83 | 6.982 | 29,33 | ||||
| 2025-12-16 | 13F | Garde Capital, Inc. | 0 | -100,00 | 0 | |||||
| 2026-04-17 | 13F | Bell Investment Advisors, Inc | 108 | 671,43 | 1 | |||||
| 2026-02-26 | 13F | TD Capital Management LLC | 1.000 | 0,00 | 7 | 0,00 | ||||
| 2026-03-04 | 13F | SHP Wealth Management | 4 | 0 | ||||||
| 2026-04-24 | 13F | Root Financial Partners, LLC | 164 | -29,31 | 1 | -100,00 | ||||
| 2026-02-17 | 13F | Citadel Advisors Llc | Call | 769.400 | -9,96 | 5.386 | -18,47 | |||
| 2026-01-22 | 13F/A | Cresset Asset Management, LLC | 0 | -100,00 | 0 | |||||
| 2026-04-13 | 13F | Salem Investment Counselors Inc | 750 | 4 | ||||||
| 2026-02-17 | 13F | Citadel Advisors Llc | Put | 1.073.700 | -11,19 | 7.516 | -19,58 | |||
| 2026-02-17 | 13F | Citadel Advisors Llc | 1.114.532 | -8,51 | 7.802 | -17,15 | ||||
| 2026-02-17 | 13F | Creative Planning | 20.246 | -1,56 | 142 | -10,76 | ||||
| 2026-02-13 | 13F | BNP Paribas Asset Management Holding S.A. | 2.378 | 40,46 | 0 | |||||
| 2026-02-17 | 13F | Sender Co & Partners, Inc. | 0 | -100,00 | 0 | |||||
| 2026-02-10 | 13F | Murphy & Mullick Capital Management Corp | 0 | -100,00 | 0 | |||||
| 2026-02-17 | 13F | MIRAE ASSET GLOBAL ETFS HOLDINGS Ltd. | 172.170 | -6,64 | 1.205 | -15,44 | ||||
| 2025-11-13 | 13F | Private Advisor Group, LLC | 0 | -100,00 | 0 | -100,00 | ||||
| 2026-02-17 | 13F | Sender Co & Partners, Inc. | Call | 0 | -100,00 | 0 | ||||
| 2026-02-12 | 13F | Groupe la Francaise | 0 | -100,00 | 0 | |||||
| 2026-02-20 | 13F | Sunbelt Securities, Inc. | 183 | -37,33 | 1 | -50,00 | ||||
| 2026-01-06 | 13F | Tucker Asset Management Llc | 0 | -100,00 | 0 | |||||
| 2026-02-17 | 13F | Tang Capital Management Llc | 1.400.000 | 0,00 | 9.800 | -9,44 | ||||
| 2026-01-29 | 13F | Concurrent Investment Advisors, LLC | 10.929 | -10,30 | 77 | -19,15 | ||||
| 2026-02-19 | 13F | CI Private Wealth, LLC | 37.692 | 236,60 | 264 | 205,81 | ||||
| 2026-02-04 | 13F | Atlantic Union Bankshares Corp | 33 | -78,00 | 0 | -100,00 | ||||
| 2026-02-17 | 13F | Cape Investment Advisory, Inc. | 253 | -28,33 | 2 | -50,00 | ||||
| 2025-11-14 | 13F | Wolverine Trading, Llc | Put | 251.100 | 17,78 | 2.059 | 14,84 | |||
| 2025-11-13 | 13F | K2 Principal Fund, L.p. | Call | 0 | -100,00 | 0 | ||||
| 2026-02-05 | 13F | Bessemer Group Inc | 0 | -100,00 | 0 | |||||
| 2025-11-05 | 13F | Evermay Wealth Management Llc | 0 | -100,00 | 0 | |||||
| 2026-04-15 | 13F | Bayforest Capital Ltd | 19.763 | 8,83 | 108 | -15,75 | ||||
| 2026-02-17 | 13F | Canada Pension Plan Investment Board | 342.100 | 6,31 | 2.395 | -3,74 | ||||
| 2025-11-14 | 13F | Wolverine Trading, Llc | 24.209 | 104,49 | 199 | 100,00 | ||||
| 2025-11-14 | 13F | Wolverine Trading, Llc | Call | 439.900 | 71,70 | 3.607 | 67,46 | |||
| 2026-02-13 | 13F | Squarepoint Ops LLC | Put | 0 | -100,00 | 0 | -100,00 | |||
| 2025-11-06 | 13F | CloudAlpha Capital Management Limited/Hong Kong | 0 | -100,00 | 0 | -100,00 | ||||
| 2026-02-05 | 13F | Allworth Financial LP | 938 | -0,95 | 7 | -14,29 | ||||
| 2026-02-17 | 13F | Himension Fund | 169.064 | -8,03 | 1.183 | -16,69 | ||||
| 2026-01-12 | 13F | Rialto Wealth Management, LLC | 13 | 0,00 | 0 | |||||
| 2026-03-20 | 13F/A | Hsbc Holdings Plc | 23.000 | -46,72 | 160 | -52,40 | ||||
| 2026-02-13 | 13F | Quinn Opportunity Partners LLC | 0 | -100,00 | 0 | |||||
| 2026-02-03 | 13F | International Assets Investment Management, Llc | 6.438 | 45 | ||||||
| 2025-11-17 | 13F | FSA Wealth Management LLC | 40 | 0,00 | 0 | |||||
| 2026-01-30 | 13F | Jennison Associates Llc | 100.360 | 19,05 | 703 | 7,83 | ||||
| 2026-02-13 | 13F | Prudential Financial Inc | 10.817 | -52,22 | 76 | -56,90 | ||||
| 2026-04-21 | 13F | Financial Consulate, Inc | 372 | -14,29 | 2 | -33,33 | ||||
| 2026-02-02 | 13F | Cornerstone Planning Group LLC | 50 | -74,87 | 0 | -100,00 | ||||
| 2026-02-17 | 13F | Qube Research & Technologies Ltd | Put | 2.100 | 15 | |||||
| 2026-02-17 | 13F | Soviero Asset Management, LP | Call | 168.000 | -34,88 | 1.176 | -41,02 | |||
| 2026-02-17 | 13F | Qube Research & Technologies Ltd | Call | 11.400 | 80 | |||||
| 2026-02-11 | 13F | Capital Analysts, Inc. | 152 | 0,00 | 0 | |||||
| 2026-02-06 | 13F | Pnc Financial Services Group, Inc. | 4.391 | 177,74 | 31 | 150,00 | ||||
| 2026-02-17 | 13F | Graham Capital Management, L.P. | 51.313 | 359 | ||||||
| 2026-02-17 | 13F | Prelude Capital Management, Llc | 60.600 | -64,25 | 424 | -67,63 | ||||
| 2026-02-13 | 13F | C M Bidwell & Associates Ltd | 15 | 0,00 | 0 | |||||
| 2026-02-17 | 13F | Parallax Volatility Advisers, L.P. | Put | 50.000 | -60,00 | 350 | -63,77 | |||
| 2026-02-17 | 13F | Parallax Volatility Advisers, L.P. | Call | 250.000 | 0,00 | 1.750 | -9,42 | |||
| 2026-04-21 | 13F | Robeco Institutional Asset Management B.V. | 163.891 | -12,08 | 893 | -31,52 | ||||
| 2026-02-03 | 13F/A | Bank Of America Corp /de/ | Call | 0 | -100,00 | 0 | -100,00 | |||
| 2026-02-12 | 13F | Marex Group plc | 49.121 | -6,45 | 344 | -15,31 | ||||
| 2026-02-17 | 13F | Nomura Holdings Inc | 35.107 | -11,53 | 246 | -19,93 | ||||
| 2026-04-07 | 13F/A | Round Rock Advisors, LLC | 232.365 | 36,43 | 1.627 | 14,91 | ||||
| 2026-02-17 | 13F | ExodusPoint Capital Management, LP | 0 | -100,00 | 0 | -100,00 | ||||
| 2026-02-26 | 13F | Anchor Investment Management, LLC | 80 | 0,00 | 1 | |||||
| 2026-02-17 | 13F | Aster Capital Management (DIFC) Ltd | 617 | -87,21 | 4 | -89,19 | ||||
| 2025-11-13 | 13F | Riggs Asset Managment Co. Inc. | 0 | -100,00 | 0 | |||||
| 2026-02-17 | 13F | Wealth Watch Advisors, INC | 50 | 0,00 | 0 | |||||
| 2026-02-17 | 13F | TCG Advisory Services, LLC | Call | 0 | -100,00 | 0 | ||||
| 2025-11-14 | 13F | Schonfeld Strategic Advisors LLC | 0 | -100,00 | 0 | -100,00 | ||||
| 2026-02-17 | 13F | Nomura Holdings Inc | Call | 25.000 | 0,00 | 175 | -9,33 | |||
| 2026-02-17 | 13F | Nomura Holdings Inc | Put | 200.000 | 0,00 | 1.400 | -9,44 | |||
| 2026-04-22 | 13F | Smallwood Wealth Investment Management, LLC | 10 | 0,00 | 0 | |||||
| 2026-02-04 | 13F | Virginia Retirement Systems Et Al | 243.525 | 62,27 | 1.705 | 46,90 | ||||
| 2026-02-04 | 13F | Raelipskie Partnership | 448 | 0,00 | 3 | 0,00 | ||||
| 2026-02-06 | 13F | Global Retirement Partners, LLC | 159 | 5,30 | 1 | 0,00 | ||||
| 2026-02-12 | 13F | Counterpoint Mutual Funds LLC | 115.452 | 87,90 | 808 | 70,46 | ||||
| 2026-02-13 | 13F | Barclays Plc | Call | 25.700 | 0,00 | 180 | -9,60 | |||
| 2025-11-10 | 13F | Jfs Wealth Advisors, Llc | 0 | -100,00 | 0 | |||||
| 2026-02-13 | 13F | Barclays Plc | 489.982 | -0,01 | 3.430 | -9,45 | ||||
| 2026-04-06 | 13F | Versant Capital Management, Inc | 6.155 | 54,61 | 34 | 22,22 | ||||
| 2026-02-17 | 13F | Capital Fund Management S.a. | Call | 0 | -100,00 | 0 | -100,00 | |||
| 2025-11-13 | 13F | Jump Financial, LLC | 0 | -100,00 | 0 | |||||
| 2025-11-13 | 13F | Marathon Trading Investment Management LLC | 0 | -100,00 | 0 | |||||
| 2026-02-06 | 13F | ProShare Advisors LLC | 32.532 | 8,17 | 228 | -2,16 | ||||
| 2025-11-13 | 13F | EntryPoint Capital, LLC | 0 | -100,00 | 0 | |||||
| 2026-02-17 | 13F | Raymond James Financial Inc | 38.162 | 33,96 | 267 | 21,36 | ||||
| 2026-02-17 | 13F | Scientech Research LLC | 22.913 | 160 | ||||||
| 2026-02-12 | 13F | Federation des caisses Desjardins du Quebec | 22.525 | -7,98 | 158 | -16,93 | ||||
| 2025-11-14 | 13F | Owl Creek Asset Management, L.P. | Call | 0 | -100,00 | 0 | -100,00 | |||
| 2026-02-02 | 13F | New England Capital Financial Advisors LLC | 10 | 0,00 | 0 | |||||
| 2026-02-17 | 13F | Millennium Management Llc | 1.510.686 | 406,73 | 10.575 | 358,94 | ||||
| 2026-01-30 | 13F | Citizens National Bank Trust Department | 20 | 0,00 | 0 | |||||
| 2026-02-04 | 13F | Plato Investment Management Ltd | 349 | 0,00 | 2 | 0,00 | ||||
| 2026-02-11 | 13F | Empowered Funds, LLC | 742.305 | 1,93 | 5.196 | -7,69 | ||||
| 2026-02-17 | 13F | Millennium Management Llc | Call | 42.800 | -35,93 | 300 | -42,05 | |||
| 2026-02-17 | 13F | Millennium Management Llc | Put | 59.200 | -80,77 | 414 | -82,61 | |||
| 2026-04-24 | 13F | UMA Financial Services, Inc. | 495 | 256,12 | 3 | |||||
| 2026-02-06 | 13F | HighTower Advisors, LLC | 18.647 | 19,15 | 131 | 8,33 | ||||
| 2026-02-13 | 13F | Diametric Capital, LP | 0 | -100,00 | 0 | |||||
| 2025-11-13 | 13F | GeoWealth Management, LLC | 0 | -100,00 | 0 | |||||
| 2026-02-17 | 13F | Ameriflex Group, Inc. | 23 | -50,00 | 0 | |||||
| 2026-02-13 | 13F | Manufacturers Life Insurance Company, The | 79.995 | -5,58 | 560 | -14,53 | ||||
| 2025-11-13 | 13F | Newbridge Financial Services Group, Inc. | 0 | -100,00 | 0 | |||||
| 2026-02-06 | 13F | Larson Financial Group LLC | 208 | -64,98 | 1 | -75,00 | ||||
| 2026-02-13 | 13F | Arrowstreet Capital, Limited Partnership | 0 | -100,00 | 0 | |||||
| 2026-02-18 | 13F | Oracle Investment Management Inc | 354.338 | -49,77 | 2.480 | -54,51 | ||||
| 2026-02-18 | 13F | Oracle Investment Management Inc | Call | 650.000 | 38,15 | 4.550 | 25,14 | |||
| 2026-02-03 | 13F | Strengthening Families & Communities, LLC | 308 | 0,00 | 2 | 0,00 | ||||
| 2026-02-17 | 13F | Russell Investments Group, Ltd. | 19.038 | -0,72 | 133 | -10,74 | ||||
| 2026-02-09 | 13F | Quest Partners LLC | 76.682 | 7,92 | 537 | -2,37 | ||||
| 2026-02-17 | 13F | Dark Forest Capital Management Lp | 0 | -100,00 | 0 | -100,00 | ||||
| 2026-02-17 | 13F | Edmond De Rothschild Holding S.a. | 2.595 | 0,00 | 18 | -10,00 | ||||
| 2025-11-13 | 13F | Norges Bank | 0 | -100,00 | 0 | -100,00 | ||||
| 2026-02-11 | 13F | Winton Capital Group Ltd | 33.300 | 233 | ||||||
| 2026-02-17 | 13F | Cinctive Capital Management LP | 97.096 | 66,71 | 680 | 50,89 | ||||
| 2026-02-13 | 13F | Charles Schwab Investment Management Inc | 2.546.622 | 0,18 | 17.826 | -9,28 | ||||
| 2026-02-17 | 13F | Fmr Llc | 736.726 | 26,82 | 5.157 | 14,86 | ||||
| 2026-02-11 | 13F | Deutsche Bank Ag\ | 153.325 | 3,24 | 1.073 | -6,53 | ||||
| 2026-04-21 | 13F | Chiron Capital Management, Llc | 109.970 | 40,60 | 599 | -0,83 | ||||
| 2026-02-17 | 13F | Shay Capital LLC | 26.000 | 182 | ||||||
| 2025-11-14 | 13F | Truvestments Capital Llc | 0 | -100,00 | 0 | -100,00 | ||||
| 2025-10-28 | 13F | Qrg Capital Management, Inc. | 0 | -100,00 | 0 | |||||
| 2026-02-12 | 13F | Steward Partners Investment Advisory, Llc | 320 | -11,11 | 2 | 0,00 | ||||
| 2026-01-29 | 13F | Dunhill Financial, LLC | 4 | 0 | ||||||
| 2026-02-06 | 13F | Nano Cap New Millennium Growth Fund L P | 175.000 | 1.225 | ||||||
| 2026-02-12 | 13F | Quadrant Capital Group Llc | 0 | -100,00 | 0 | |||||
| 2026-02-12 | 13F | DRW Securities, LLC | 0 | -100,00 | 0 | -100,00 | ||||
| 2026-04-16 | 13F | Capital Advisors, Ltd. LLC | 327 | 163,71 | 0 | |||||
| 2026-04-03 | 13F | Adirondack Trust Co | 327 | 0,00 | 2 | -50,00 | ||||
| 2026-04-10 | 13F | Waldron Private Wealth LLC | 10.552 | 58 | ||||||
| 2026-02-17 | 13F | NCP Inc. | 1.514 | 11 | ||||||
| 2026-04-10 | 13F/A | OP Asset Management Ltd | 639.900 | 5.180,57 | 3.487 | 4.051,19 | ||||
| 2025-11-14 | 13F | Point72 Asia (Singapore) Pte. Ltd. | 24.076 | 44,21 | 186 | 28,28 | ||||
| 2026-02-13 | 13F | Altrafin AG | 0 | -100,00 | 0 | |||||
| 2026-02-17 | 13F | DV Trading LLC | 229 | 2 | ||||||
| 2026-02-05 | 13F | Navalign, LLC | 8 | 0 | ||||||
| 2026-02-17 | 13F | TCG Advisory Services, LLC | 14.840 | 40,36 | 104 | 27,16 | ||||
| 2026-02-13 | 13F | Ieq Capital, Llc | 105.284 | -51,84 | 737 | -56,42 | ||||
| 2025-11-14 | 13F/A | Massar Capital Management, LP | 0 | -100,00 | 0 | |||||
| 2025-11-14 | 13F | Wellington Management Group Llp | 0 | -100,00 | 0 | -100,00 | ||||
| 2026-04-24 | 13F | Strs Ohio | 47.200 | 0,00 | 257 | -22,12 | ||||
| 2026-02-11 | 13F | Vise Technologies, Inc. | 0 | -100,00 | 0 | |||||
| 2025-11-03 | 13F | AE Wealth Management LLC | 0 | -100,00 | 0 | |||||
| 2026-01-29 | 13F | Comerica Bank | 369 | 22,19 | 3 | 0,00 | ||||
| 2026-04-24 | 13F | Raiffeisen Bank International AG | Call | 1.060 | 0,00 | 6 | -16,67 | |||
| 2026-02-05 | 13F | Tejara Capital Ltd | 159.200 | 1.114 | ||||||
| 2026-02-12 | 13F | SWAN Capital LLC | 8 | 0,00 | 0 | |||||
| 2025-11-14 | 13F | Peak6 Llc | Put | 0 | -100,00 | 0 | -100,00 | |||
| 2026-02-12 | 13F | Jane Street Group, Llc | 879.814 | -18,64 | 6.159 | -26,32 | ||||
| 2026-02-17 | 13F | California State Teachers Retirement System | 170.281 | 7,40 | 1.192 | -2,78 | ||||
| 2026-02-12 | 13F | Jane Street Group, Llc | Put | 220.400 | -72,53 | 1.543 | -75,14 | |||
| 2026-02-12 | 13F | Jane Street Group, Llc | Call | 67.000 | -26,54 | 469 | -33,38 | |||
| 2026-04-22 | 13F | Coston, McIsaac & Partners | 10 | 0,00 | 0 | |||||
| 2026-02-13 | 13F | State Street Corp | 4.250.144 | -8,79 | 29.751 | -17,40 | ||||
| 2026-01-23 | 13F | Brown, Lisle/cummings, Inc. | 0 | -100,00 | 0 | |||||
| 2026-04-14 | 13F | Zrc Wealth Management, Llc | 164 | 1 | ||||||
| 2026-02-06 | 13F | Tortoise Investment Management, LLC | 0 | -100,00 | 0 | |||||
| 2026-02-13 | 13F | Entropy Technologies, LP | 0 | -100,00 | 0 | |||||
| 2026-02-17 | 13F | Susquehanna International Group, Llp | 1.061.468 | -29,76 | 7.430 | -36,39 | ||||
| 2026-04-07 | 13F | Signaturefd, Llc | 7.507 | 593,17 | 41 | 471,43 | ||||
| 2026-02-09 | 13F | Harbour Investments, Inc. | 1.184 | -10,37 | 8 | -20,00 | ||||
| 2025-11-14 | 13F | Mangrove Partners | 0 | -100,00 | 0 | -100,00 | ||||
| 2026-02-17 | 13F | Susquehanna International Group, Llp | Put | 3.362.400 | 30,55 | 23.537 | 18,22 | |||
| 2026-02-12 | 13F | CIBC Private Wealth Group, LLC | 1.412 | -4,08 | 10 | -18,18 | ||||
| 2026-02-17 | 13F | Susquehanna International Group, Llp | Call | 2.778.000 | 124,25 | 19.446 | 103,09 | |||
| 2026-02-13 | 13F | Barclays Plc | Put | 0 | -100,00 | 0 | -100,00 | |||
| 2026-02-13 | 13F | Bridgefront Capital, LLC | 17.876 | 1,50 | 125 | -8,09 | ||||
| 2026-02-13 | 13F | MAI Capital Management | 6.452 | -0,32 | 45 | -10,00 | ||||
| 2026-02-17 | 13F | Bridgeway Capital Management Inc | 1.250.805 | -0,08 | 8.756 | -9,52 | ||||
| 2026-01-30 | 13F/A | M&t Bank Corp | 15.272 | 107 | ||||||
| 2026-02-10 | 13F | Bnp Paribas Arbitrage, Sa | 1.557.832 | 1.741,89 | 10.905 | 1.569,83 | ||||
| 2026-01-30 | 13F | Activest Wealth Management | 0 | -100,00 | 0 | |||||
| 2026-02-13 | 13F | Quarry LP | 2.480 | 26,14 | 17 | 13,33 | ||||
| 2026-02-10 | 13F | Bnp Paribas Arbitrage, Sa | Call | 650 | 0,00 | 455 | -9,36 | |||
| 2026-01-28 | 13F | Arizona State Retirement System | 48.927 | -5,75 | 342 | -14,71 | ||||
| 2026-02-13 | 13F | Great West Life Assurance Co /can/ | 20.585 | -65,82 | 0 | |||||
| 2026-03-26 | 13F | Leonteq Securities AG | Call | 0 | -100,00 | 0 | -100,00 | |||
| 2026-04-13 | 13F | True Wealth Design, LLC | 1.491 | 8 | ||||||
| 2026-02-17 | 13F | Janus Henderson Group Plc | 243.536 | 240,25 | 1.704 | 208,70 | ||||
| 2026-02-12 | 13F | BlackRock, Inc. | 14.260.269 | 2,75 | 99.822 | -6,95 | ||||
| 2026-04-23 | 13F | SJS Investment Consulting Inc. | 0 | -100,00 | 0 | |||||
| 2026-01-21 | 13F | Flagship Harbor Advisors, Llc | 189 | 1 | ||||||
| 2026-02-17 | 13F | Quantitative Investment Management, LLC | 0 | -100,00 | 0 | |||||
| 2025-11-14 | 13F | Symmetry Investments LP | Call | 0 | -100,00 | 0 | ||||
| 2026-02-12 | 13F | State Board Of Administration Of Florida Retirement System | 46.914 | 0,00 | 328 | -9,39 | ||||
| 2026-02-11 | 13F | Syon Capital Llc | 14.140 | 99 | ||||||
| 2026-02-13 | 13F | Parker Investment Management, LLC | 78.251 | -27,18 | 548 | -34,10 | ||||
| 2026-02-17 | 13F | Bank Hapoalim Bm | 157.841 | 18,91 | 1 | 0,00 | ||||
| 2026-02-13 | 13F | Parker Investment Management, LLC | Call | 280 | -79,87 | |||||
| 2026-02-13 | 13F | Parker Investment Management, LLC | Put | 280 | -66,14 | |||||
| 2026-04-14 | 13F | Tradewinds Capital Management, LLC | 15 | 0,00 | 0 | |||||
| 2026-02-04 | 13F | Ameritas Advisory Services, LLC | 0 | -100,00 | 0 | |||||
| 2026-02-11 | 13F | Jpmorgan Chase & Co | 617.785 | -29,93 | 4.324 | -36,55 | ||||
| 2026-02-11 | 13F | Jpmorgan Chase & Co | Put | 320.000 | 0,00 | 2.240 | -9,42 | |||
| 2026-02-11 | 13F | Curio Wealth, Llc | 39 | 0 | ||||||
| 2026-01-29 | 13F | UBS Group AG | Call | 203.900 | -0,63 | 1.427 | -10,03 | |||
| 2026-01-29 | 13F | UBS Group AG | 1.498.551 | 24,69 | 10.490 | 12,92 | ||||
| 2026-02-17 | 13F | Ameriprise Financial Inc | 1.517.171 | -33,59 | 10.620 | -39,86 | ||||
| 2026-04-21 | 13F | Pallas Capital Advisors LLC | 13.739 | 75 | ||||||
| 2026-02-26 | 13F/A | Alpine Global Management, LLC | 26.673 | 187 | ||||||
| 2026-02-12 | 13F | Renaissance Technologies Llc | 7.978.142 | -2,43 | 55.847 | -11,64 | ||||
| 2026-02-12 | 13F | MetLife Investment Management, LLC | 93.800 | -1,95 | 657 | -11,23 | ||||
| 2026-02-13 | 13F | Glen Eagle Advisors, LLC | 50 | -61,54 | 0 | -100,00 | ||||
| 2026-01-21 | 13F | Pacific Point Advisors, LLC | 70.000 | 0,00 | 490 | -9,43 | ||||
| 2026-02-17 | 13F | Two Sigma Advisers, Lp | 601.617 | -58,21 | 4.211 | -62,16 | ||||
| 2026-02-18 | 13F | Mackenzie Financial Corp | 165.550 | 38,58 | 1.157 | 25,24 | ||||
| 2026-02-13 | 13F | Citigroup Inc | 15.282 | -95,47 | 107 | -95,93 | ||||
| 2026-02-18 | 13F | GWM Advisors LLC | 1.270 | -89,12 | 9 | -91,11 | ||||
| 2026-02-11 | 13F | Parallel Advisors, LLC | 73 | -61,78 | 1 | -100,00 | ||||
| 2026-01-28 | 13F | N.E.W. Advisory Services LLC | 76 | -21,65 | 1 | |||||
| 2026-02-17 | 13F | Union Square Park Capital Management, LLC | 1.000.000 | 233,33 | 7.000 | 201,85 | ||||
| 2026-01-28 | 13F | Financial Perspectives, Inc | 97 | 0,00 | 1 | |||||
| 2026-01-27 | 13F | TD Waterhouse Canada Inc. | 233 | -6,05 | 2 | 0,00 | ||||
| 2026-02-05 | 13F | Amalgamated Bank | 5.593 | -6,17 | 0 | |||||
| 2025-11-14 | 13F | Union Square Park Capital Management, LLC | Call | 0 | -100,00 | 0 | -100,00 | |||
| 2026-02-13 | 13F | Martingale Asset Management L P | 16.532 | 116 | ||||||
| 2026-04-06 | 13F | GAMMA Investing LLC | 7.663 | 130,60 | 42 | 78,26 | ||||
| 2026-02-06 | 13F | Handelsbanken Fonder AB | 36.600 | 0,00 | 0 | |||||
| 2026-02-10 | 13F/A | Northwestern Mutual Wealth Management Co | 869 | 10,00 | 6 | 0,00 | ||||
| 2026-02-13 | 13F | Walleye Trading LLC | Call | 44.800 | -69,44 | 314 | -72,37 | |||
| 2026-02-13 | 13F | Walleye Trading LLC | 198.233 | -38,65 | 1.388 | -44,45 | ||||
| 2025-11-14 | 13F | DRW Securities, LLC | Call | 0 | -100,00 | 0 | -100,00 | |||
| 2026-01-16 | 13F | FNY Investment Advisers, LLC | 0 | -100,00 | 0 | |||||
| 2026-02-13 | 13F | Walleye Trading LLC | Put | 233.600 | 80,80 | 1.635 | 63,83 | |||
| 2026-01-16 | 13F | FNY Investment Advisers, LLC | Call | 0 | -100,00 | 0 | ||||
| 2025-11-03 | 13F | GPS Wealth Strategies Group, LLC | 0 | -100,00 | 0 | |||||
| 2026-02-17 | 13F | Brevan Howard Capital Management LP | 82.562 | -27,74 | 578 | -34,65 | ||||
| 2026-02-13 | 13F | Rhumbline Advisers | 232.612 | -13,79 | 1.628 | -21,92 | ||||
| 2026-02-10 | 13F | State of Wyoming | 101.746 | 28,67 | 712 | 16,53 | ||||
| 2026-02-11 | 13F | Los Angeles Capital Management Llc | 839 | 7 | ||||||
| 2025-11-14 | 13F | Skopos Labs, Inc. | 0 | -100,00 | 0 | |||||
| 2026-04-20 | 13F | Ronald Blue Trust, Inc. | 138 | -49,64 | 1 | -100,00 | ||||
| 2026-02-13 | 13F | Morgan Stanley | 1.675.282 | -53,47 | 11.727 | -57,87 | ||||
| 2026-02-03 | 13F | Mitsubishi UFJ Kokusai Asset Management Co., Ltd. | 1.370 | 0,00 | 10 | -10,00 | ||||
| 2025-11-14 | 13F | Equitable Holdings, Inc. | 0 | -100,00 | 0 | |||||
| 2026-02-09 | 13F | Jackson Creek Investment Advisors LLC | 52.454 | 0 | ||||||
| 2026-02-13 | 13F | Pale Fire Capital SE | 1.944.203 | 13.609 | ||||||
| 2026-02-13 | 13F | Police & Firemen's Retirement System of New Jersey | 48.714 | 0,00 | 341 | -9,57 | ||||
| 2026-02-17 | 13F | DZ BANK AG Deutsche Zentral Genossenschafts Bank, Frankfurt am Main | 0 | -100,00 | 0 | |||||
| 2026-02-17 | 13F | Mirabella Financial Services Llp | 30.801 | 216 | ||||||
| 2026-02-11 | 13F | Rise Advisors, LLC | 0 | -100,00 | 0 | |||||
| 2025-10-30 | 13F | Twin Peaks Wealth Advisors, LLC | 0 | -100,00 | 0 | |||||
| 2026-04-08 | 13F | Afg Fiduciary Services Limited Partnership | 10.250 | -21,15 | 55 | -40,66 | ||||
| 2025-11-17 | 13F | Kestra Private Wealth Services, Llc | 0 | -100,00 | 0 | -100,00 | ||||
| 2026-02-23 | 13F | Virtu Financial LLC | 121.984 | 1 | ||||||
| 2026-04-07 | 13F | Farther Finance Advisors, LLC | 3.623 | 82,61 | 19 | 46,15 | ||||
| 2026-02-12 | 13F | Federated Hermes, Inc. | 361.921 | 17,62 | 2.533 | 6,52 | ||||
| 2026-02-17 | 13F | Invenomic Capital Management LP | 0 | -100,00 | 0 | |||||
| 2026-04-23 | 13F | Private Wealth Management Group, LLC | 17 | -91,87 | 0 | -100,00 | ||||
| 2026-02-12 | 13F | New York State Common Retirement Fund | 51.503 | 0,00 | 361 | -9,55 | ||||
| 2026-02-17 | 13F | State Of Wisconsin Investment Board | 34.010 | -56,92 | 238 | -60,98 | ||||
| 2026-02-13 | 13F | SRS Capital Advisors, Inc. | 25.585 | -4,58 | 179 | -13,53 | ||||
| 2026-02-13 | 13F | Missouri Trust & Investment Co | 25 | 0,00 | 0 | |||||
| 2025-11-14 | 13F | J. Goldman & Co LP | 0 | -100,00 | 0 | |||||
| 2026-02-17 | 13F | Caption Management, LLC | 7.599 | -74,67 | 53 | -77,06 | ||||
| 2025-11-18 | 13F | Kozak & Associates, Inc. | 0 | -100,00 | 0 | |||||
| 2026-02-17 | 13F | Caption Management, LLC | Call | 100.000 | 700 | |||||
| 2026-02-19 | 13F | Invesco Ltd. | 263.797 | -0,01 | 1.847 | -9,47 | ||||
| 2026-02-13 | 13F | Wells Fargo & Company/mn | 266.710 | 17,19 | 1.867 | 6,08 | ||||
| 2026-02-11 | 13F | LPL Financial LLC | 85.346 | -56,62 | 597 | -60,72 | ||||
| 2026-04-21 | 13F | Nemes Rush Group LLC | 359 | 0,00 | 2 | -50,00 | ||||
| 2026-02-17 | 13F | Advisor Group Holdings, Inc. | 21.284 | -85,94 | 149 | -87,97 | ||||
| 2026-02-13 | 13F | Hurley Capital, LLC | Call | 52 | 0,00 | 0 | -100,00 | |||
| 2026-02-17 | 13F | Blair William & Co/il | 2.434 | -13,04 | 17 | -19,05 | ||||
| 2026-02-06 | 13F | Covestor Ltd | 1.666 | -8,86 | 0 | |||||
| 2026-02-17 | 13F | Polymer Capital Management (US) LLC | 22.443 | 32,02 | 157 | 19,85 | ||||
| 2026-01-28 | 13F | Klp Kapitalforvaltning As | 37.700 | -6,45 | 264 | -15,43 | ||||
| 2025-10-29 | 13F | Game Plan Financial Advisors, LLC | 0 | -100,00 | 0 | |||||
| 2026-02-17 | 13F | One68 Global Capital, LLC | 26.000 | 182 | ||||||
| 2026-01-21 | 13F | Sound Income Strategies, LLC | 0 | -100,00 | 0 | |||||
| 2026-01-26 | 13F | KBC Group NV | 9.632 | 88,27 | 0 | |||||
| 2026-01-29 | 13F | Quent Capital, LLC | 1.116 | 0,00 | 8 | -12,50 | ||||
| 2026-02-11 | 13F | LPL Financial LLC | Call | 0 | -100,00 | 0 | -100,00 | |||
| 2026-02-17 | 13F | Cetera Investment Advisers | 39.133 | -4,81 | 274 | -13,88 | ||||
| 2026-04-22 | 13F | Formidable Asset Management, LLC | 21.930 | 154 | ||||||
| 2026-02-06 | 13F | Leonteq Securities AG | 132.512 | 11,75 | 928 | 1,20 | ||||
| 2026-02-02 | 13F | Hussman Strategic Advisors, Inc. | 210.000 | 42,86 | 1.470 | 29,40 | ||||
| 2025-11-14 | 13F | Point72 (DIFC) Ltd | 0 | -100,00 | 0 | |||||
| 2026-01-27 | 13F | Zurcher Kantonalbank (Zurich Cantonalbank) | 36.064 | -43,75 | 252 | -49,09 | ||||
| 2026-02-17 | 13F | Soviero Asset Management, LP | 0 | -100,00 | 0 | -100,00 | ||||
| 2026-02-12 | 13F | Swiss National Bank | 348.302 | 2,38 | 2.438 | -7,27 | ||||
| 2026-04-13 | 13F | Gill Capital Partners, Llc | 56 | 0 | ||||||
| 2026-01-30 | 13F | Rachor Investment Advisory Services, LLC | 50 | 0 | ||||||
| 2026-02-17 | 13F | Banco Bilbao Vizcaya Argentaria, S.a. | 0 | -100,00 | 0 | |||||
| 2025-11-14 | 13F | Maple Rock Capital Partners Inc. | 0 | -100,00 | 0 | -100,00 | ||||
| 2026-04-15 | 13F | Compagnie Lombard Odier SCmA | 618 | 0,00 | 3 | -25,00 | ||||
| 2025-11-21 | 13F/A | CIBC Bancorp USA Inc. | 18.748 | 145 | ||||||
| 2026-01-16 | 13F | West Branch Capital LLC | 0 | -100,00 | 0 | |||||
| 2026-01-26 | 13F | Asset Dedication, LLC | 68 | 0,00 | 0 | |||||
| 2026-02-13 | 13F | Kilter Group LLC | 0 | -100,00 | 0 | |||||
| 2026-02-12 | 13F | BRYN MAWR TRUST Co | 400 | 0,00 | 3 | -33,33 |