Grundlæggende statistik
| Institutionelle ejere | 127 total, 123 long only, 2 short only, 2 long/short - change of 3,23% MRQ |
| Del pris | 15,94 |
| Gennemsnitlig porteføljeallokering | 0.1472 % - change of -14,72% MRQ |
| Institutionelle aktier (lange) | 18.022.183 (ex 13D/G) - change of -4,92MM shares -21,46% MRQ |
| Institutionel værdi (lang) | $ 254.631 USD ($1000) |
Institutionelt ejerskab og aktionærer
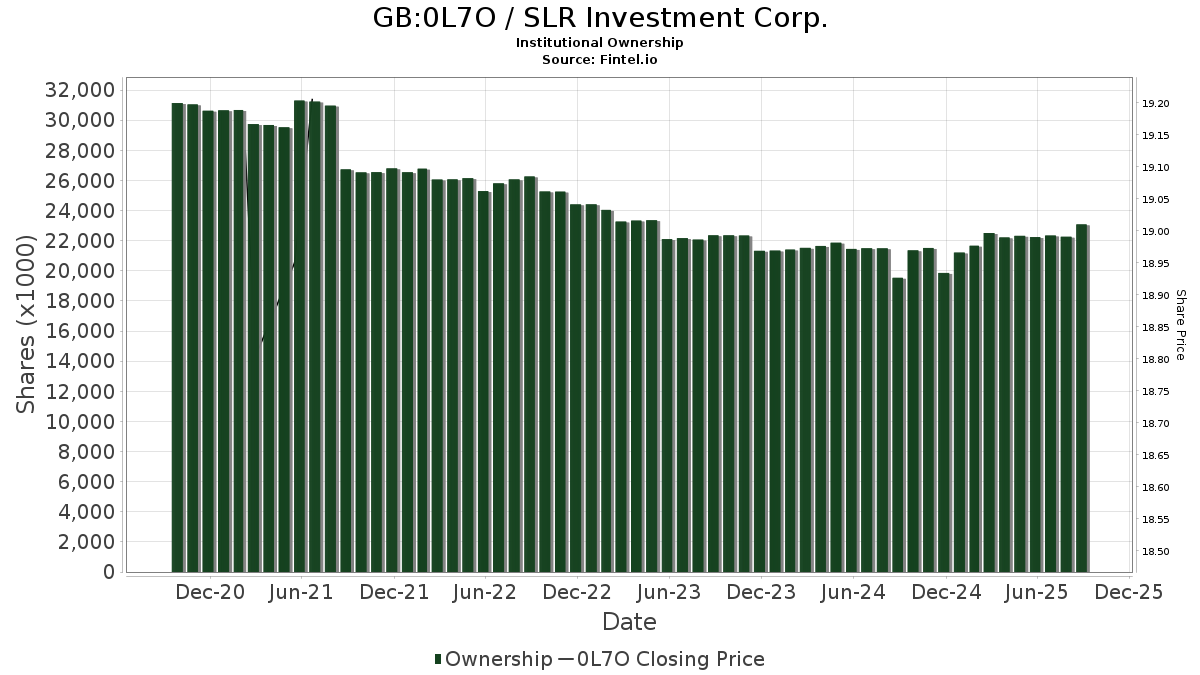
SLR Investment Corp. (GB:0L7O) har 127 institutionelle ejere og aktionærer, der har indsendt 13D/G- eller 13F-formularer til Securities Exchange Commission (SEC). Disse institutioner har i alt 18,022,183 aktier. Største aktionærer omfatter Thornburg Investment Management Inc, Jpmorgan Chase & Co, Van Eck Associates Corp, Aristotle Capital Boston, LLC, UBS Group AG, Muzinich & Co., Inc., Franklin Resources Inc, Epiq Partners, Llc, Two Sigma Investments, Lp, and Diameter Capital Partners LP .
SLR Investment Corp. (LSE:0L7O) institutionel ejerskabsstruktur viser aktuelle positioner i virksomheden efter institutioner og fonde, samt seneste ændringer i positionsstørrelse. Større aktionærer kan omfatte individuelle investorer, investeringsforeninger, hedgefonde eller institutioner. Skema 13D angiver, at investoren besidder (eller besidder) mere end 5 % af virksomheden og har til hensigt (eller har til hensigt at) aktivt at forfølge en ændring i forretningsstrategi. Skema 13G indikerer en passiv investering på over 5%.
The share price as of May 1, 2026 is 15,94 / share. Previously, on May 2, 2025, the share price was 15,55 / share. This represents an increase of 2,52% over that period.
Fondens stemningsscore
Fund Sentiment Score (fka Ownership Accumulation Score) finder de aktier, der bliver mest købt af fonde. Det er resultatet af en sofistikeret, multi-faktor kvantitativ model, der identificerer virksomheder med de højeste niveauer af institutionel akkumulering. Scoringsmodellen bruger en kombination af den samlede stigning i oplyste ejere, ændringerne i porteføljeallokeringer i disse ejere og andre målinger. Tallet går fra 0 til 100, hvor højere tal indikerer et højere niveau af akkumulering for sine jævnaldrende, og 50 er gennemsnittet.
Opdateringsfrekvens: Dagligt
Se Ownership Explorer, som giver en liste over højest rangerende virksomheder.
AI+ Ask Fintel’s AI assistant about SLR Investment Corp..
Select a question to share a public post with an AI-crafted answer.
Thinking of good questions…
13F og NPORT arkivering
Detaljer om 13F-arkivering er gratis. Detaljer om NP-ansøgninger kræver et premium-medlemskab. Grønne rækker angiver nye positioner. Røde rækker angiver lukkede positioner. Klik på linket ikon for at se den fulde transaktionshistorik.
Opgrader
for at låse premium-data op og eksportere til Excel ![]() .
.
| Fil dato | Kilde | Investor | Type | Gennemsnitlig pris (Øst) |
Aktier | Δ Aktier (%) |
Rapporteret Værdi ($1000) |
Δ Værdi (%) |
Port Alloc (%) |
|
|---|---|---|---|---|---|---|---|---|---|---|
| 2026-02-17 | 13F | Diameter Capital Partners LP | 395.389 | 6.113 | ||||||
| 2025-11-13 | 13F | Fmr Llc | 0 | -100,00 | 0 | |||||
| 2026-02-17 | 13F | Royal Bank Of Canada | 205.499 | -11,46 | 3.177 | -10,48 | ||||
| 2026-02-13 | 13F | Citigroup Inc | 0 | -100,00 | 0 | |||||
| 2026-01-28 | 13F | N.E.W. Advisory Services LLC | 4.318 | 114,29 | 67 | 120,00 | ||||
| 2026-04-22 | 13F | Janney Montgomery Scott LLC | 38.815 | 8,77 | 1 | |||||
| 2026-02-13 | 13F | Neuberger Berman Group LLC | 144.397 | -10,32 | 2.232 | -9,31 | ||||
| 2026-02-13 | 13F | Ares Management Llc | 0 | -100,00 | 0 | -100,00 | ||||
| 2026-02-12 | 13F | Triumph Capital Management | 42.476 | 0,19 | 657 | 1,23 | ||||
| 2025-11-14 | 13F | Ubs Asset Management Americas Inc | 0 | -100,00 | 0 | |||||
| 2026-02-13 | 13F | State Street Corp | 66.535 | 23,92 | 1.029 | 25,37 | ||||
| 2026-02-13 | 13F | Stifel Financial Corp | 20.564 | -18,40 | 318 | -17,66 | ||||
| 2026-02-17 | 13F | Advisor Group Holdings, Inc. | 80.234 | -5,08 | 1.240 | -11,05 | ||||
| 2026-02-17 | 13F | Tower Research Capital LLC (TRC) | 3.009 | 196,75 | 47 | 206,67 | ||||
| 2026-02-12 | 13F | Campbell & CO Investment Adviser LLC | 32.087 | 45,94 | 496 | 47,62 | ||||
| 2026-02-06 | 13F | Condor Capital Management | 374.063 | 6,43 | 5.783 | 7,63 | ||||
| 2026-02-09 | 13F | Harbour Investments, Inc. | 475 | 955,56 | 7 | |||||
| 2025-11-13 | 13F | Dynamic Technology Lab Private Ltd | 0 | -100,00 | 0 | |||||
| 2026-02-12 | 13F | Ensign Peak Advisors, Inc | 350.000 | 5.411 | ||||||
| 2026-02-17 | 13F | Two Sigma Investments, Lp | 419.093 | 10,25 | 6.479 | 11,48 | ||||
| 2025-11-14 | 13F | Hrt Financial Lp | 0 | -100,00 | 0 | |||||
| 2026-05-01 | 13F | International Assets Investment Management, Llc | 2.715 | 0,00 | 39 | -7,32 | ||||
| 2026-02-06 | 13F | CFO4Life Group, LLC | 12.000 | 0,00 | 186 | 1,09 | ||||
| 2026-02-09 | 13F | Huntington National Bank | 1 | 0,00 | 0 | |||||
| 2026-02-13 | 13F | Mariner, LLC | 11.598 | 179 | ||||||
| 2026-02-17 | 13F | Bank Of America Corp /de/ | 89.772 | -29,33 | 1.388 | -28,58 | ||||
| 2026-02-17 | 13F | Virtus Investment Advisers, Inc. | 36.444 | -18,58 | 563 | -17,69 | ||||
| 2025-11-14 | 13F | Citadel Advisors Llc | 0 | -100,00 | 0 | |||||
| 2026-02-12 | 13F | Steward Partners Investment Advisory, Llc | 8.987 | 0,00 | 139 | 0,73 | ||||
| 2026-02-12 | 13F | Principal Securities, Inc. | 0 | -100,00 | 0 | -100,00 | ||||
| 2026-02-17 | 13F | Northern Trust Corp | 24.040 | -9,86 | 372 | -8,85 | ||||
| 2026-02-13 | 13F | Umb Bank N A/mo | 600 | 9 | ||||||
| 2025-11-14 | 13F | Citadel Advisors Llc | Call | 0 | -100,00 | 0 | ||||
| 2026-02-13 | 13F | SRS Capital Advisors, Inc. | 1.752 | -28,31 | 27 | -27,03 | ||||
| 2026-02-20 | 13F | Sunbelt Securities, Inc. | 114.137 | 10,13 | 1.765 | 11,36 | ||||
| 2026-02-13 | 13F | MAI Capital Management | 0 | -100,00 | 0 | -100,00 | ||||
| 2026-02-13 | 13F | Sei Investments Co | 255.134 | -14,18 | 3.944 | -13,22 | ||||
| 2026-01-14 | 13F | Hennion & Walsh Asset Management, Inc. | 260.893 | -3,55 | 4.033 | -2,49 | ||||
| 2026-02-05 | 13F | AlphaCore Capital LLC | 31.697 | -39,33 | 490 | -38,60 | ||||
| 2026-02-11 | 13F | Franklin Resources Inc | 449.290 | 7,98 | 6.946 | 9,18 | ||||
| 2026-05-01 | 13F | Fifth Third Bancorp | 13.474 | 193 | ||||||
| 2026-02-13 | 13F | Morgan Stanley | 323.244 | 49,59 | 4.997 | 51,24 | ||||
| 2026-02-06 | 13F | EverSource Wealth Advisors, LLC | 4.000 | 0,00 | 62 | 0,00 | ||||
| 2026-02-02 | 13F | WJ Financial Advisors LLC | 17.391 | 269 | ||||||
| 2026-02-09 | 13F | Legal & General Group Plc | 379.906 | 18,46 | 5.873 | 19,78 | ||||
| 2026-02-17 | 13F | Quadrature Capital Ltd | 0 | -100,00 | 0 | |||||
| 2025-11-13 | 13F | Jump Financial, LLC | 0 | -100,00 | 0 | |||||
| 2026-04-20 | 13F | Ronald Blue Trust, Inc. | 0 | -100,00 | 0 | |||||
| 2026-04-29 | 13F | Garner Asset Management Corp | 87.594 | -10,17 | 1.253 | -16,85 | ||||
| 2026-04-21 | 13F | Wedbush Securities Inc | 54.120 | 4,53 | 1 | |||||
| 2026-02-11 | 13F | Greykasell Wealth Strategies, Inc. | 3.787 | 59 | ||||||
| 2026-02-12 | 13F | Commonwealth Equity Services, Llc | 157.089 | 0,64 | 2.429 | 121.300,00 | ||||
| 2026-02-13 | 13F/A | Virtus ETF Advisers LLC | 0 | -100,00 | 0 | |||||
| 2026-04-06 | 13F | GAMMA Investing LLC | 700 | -34,64 | 10 | -37,50 | ||||
| 2026-04-09 | 13F | Epiq Partners, Llc | 424.693 | 1,81 | 6.077 | -5,75 | ||||
| 2026-02-10 | 13F/A | Northwestern Mutual Wealth Management Co | 1.236 | 19 | ||||||
| 2026-02-13 | 13F | Wells Fargo & Company/mn | 17.483 | 73,86 | 270 | 76,47 | ||||
| 2025-11-06 | 13F | Ameritas Advisory Services, LLC | 0 | -100,00 | 0 | |||||
| 2026-04-07 | 13F | U.S. Capital Wealth Advisors, LLC | 16.936 | 0,06 | 242 | -7,28 | ||||
| 2026-02-12 | 13F | Advisors Asset Management, Inc. | 219.531 | 16,67 | 3.394 | 17,94 | ||||
| 2026-03-12 | 13F | Nalls Sherbakoff Group, Llc | 500 | 8 | ||||||
| 2026-02-17 | 13F | Price T Rowe Associates Inc /md/ | 17.342 | 0 | ||||||
| 2026-02-12 | 13F | BlackRock, Inc. | 387.306 | -1,21 | 5.988 | -0,12 | ||||
| 2026-02-12 | 13F | Jane Street Group, Llc | 40.920 | 99,38 | 633 | 101,92 | ||||
| 2026-02-10 | 13F | Acadian Asset Management Llc | 19 | 0,00 | 0 | |||||
| 2026-02-14 | 13F | Rockefeller Capital Management L.P. | 6.325 | 211,12 | 98 | 212,90 | ||||
| 2026-02-17 | 13F | Susquehanna International Group, Llp | Put | 18.700 | 289 | |||||
| 2026-02-17 | 13F | Susquehanna International Group, Llp | Call | 75.600 | 73,00 | 1.169 | 74,85 | |||
| 2025-11-05 | 13F | J.w. Cole Advisors, Inc. | 0 | -100,00 | 0 | -100,00 | ||||
| 2026-02-03 | 13F | NewEdge Wealth, LLC | 96.455 | 0,92 | 1.491 | 0,54 | ||||
| 2026-02-17 | 13F | Susquehanna International Group, Llp | 11.580 | 2,92 | 179 | 4,07 | ||||
| 2026-01-23 | 13F | Farther Finance Advisors, LLC | 0 | -100,00 | 0 | |||||
| 2026-02-17 | 13F | Citadel Advisors Llc | Put | 18.900 | 292 | |||||
| 2026-02-17 | 13F | Wiley Bros.-aintree Capital, Llc | 13.576 | 0,43 | 210 | 1,46 | ||||
| 2026-02-03 | 13F | Denali Advisors Llc | 88.548 | -13,44 | 1.369 | -12,53 | ||||
| 2026-02-10 | 13F | Lido Advisors, LLC | 41.782 | 0,00 | 639 | 0,00 | ||||
| 2026-04-15 | 13F | Valley National Advisers Inc | 673 | 0,00 | 0 | |||||
| 2025-11-14 | 13F | ExodusPoint Capital Management, LP | 0 | -100,00 | 0 | |||||
| 2026-02-18 | 13F | Mackenzie Financial Corp | 38.894 | 5,63 | 600 | 6,76 | ||||
| 2026-02-13 | 13F | Great West Life Assurance Co /can/ | 71.859 | 4,32 | 1 | 0,00 | ||||
| 2025-11-14 | 13F | Aquatic Capital Management LLC | 0 | -100,00 | 0 | |||||
| 2026-01-29 | 13F | UBS Group AG | 577.728 | 15,54 | 8.932 | 16,82 | ||||
| 2026-02-17 | 13F | Russell Investments Group, Ltd. | 2 | -99,94 | 0 | -100,00 | ||||
| 2026-04-28 | 13F | Flagship Harbor Advisors, Llc | 19.426 | -2,50 | 278 | -10,06 | ||||
| 2026-02-10 | 13F | Bnp Paribas Arbitrage, Sa | 12.250 | 596,81 | 189 | 626,92 | ||||
| 2026-02-17 | 13F | Millennium Management Llc | 0 | -100,00 | 0 | |||||
| 2026-02-17 | 13F | Advisory Services Network, LLC | 0 | -100,00 | 0 | -100,00 | ||||
| 2026-04-02 | 13F | Hilltop National Bank | 245 | 4 | ||||||
| 2026-02-10 | 13F | Quantbot Technologies LP | 13.868 | 214 | ||||||
| 2026-04-21 | 13F | Founders Capital Management | 1.140 | -56,82 | 16 | -60,00 | ||||
| 2026-04-28 | 13F | Abel Hall, LLC | 10.000 | 143 | ||||||
| 2026-02-12 | 13F | CIBC Private Wealth Group, LLC | 2.000 | 0,00 | 31 | 0,00 | ||||
| 2026-02-17 | 13F | Qube Research & Technologies Ltd | 0 | -100,00 | 0 | -100,00 | ||||
| 2026-02-13 | 13F | Motiv8 Investments LLC | 1.125 | 0 | ||||||
| 2026-02-17 | 13F | Running Point Capital Advisors, LLC | 21.072 | 2,66 | 326 | 3,83 | ||||
| 2025-11-14 | 13F | Cubist Systematic Strategies, LLC | 0 | -100,00 | 0 | -100,00 | ||||
| 2026-04-20 | 13F | State of Alaska, Department of Revenue | 2.501 | 0,00 | 0 | |||||
| 2026-02-02 | 13F | Danske Bank A/s | 2 | 100,00 | 0 | |||||
| 2026-01-30 | 13F | Pekin Hardy Strauss, Inc. | 0 | -100,00 | 0 | |||||
| 2026-01-12 | 13F | AllSquare Wealth Management LLC | 1.847 | 0,00 | 28 | -3,45 | ||||
| 2026-02-13 | 13F | Van Eck Associates Corp | 1.110.266 | -7,10 | 17 | -5,56 | ||||
| 2025-11-14 | 13F | Verition Fund Management LLC | 0 | -100,00 | 0 | |||||
| 2026-02-17 | 13F | Hbk Investments L P | Put | 54.600 | 844 | |||||
| 2026-04-30 | 13F | Cambridge Investment Research Advisors, Inc. | 24.590 | 0,36 | 0 | |||||
| 2026-01-28 | 13F | Chicago Partners Investment Group LLC | 31.299 | 2,29 | 474 | 0,00 | ||||
| 2026-02-17 | 13F | Captrust Financial Advisors | 17.450 | -49,32 | 270 | -48,86 | ||||
| 2026-04-27 | 13F | Truist Financial Corp | 21.730 | 311 | ||||||
| 2026-02-17 | 13F | Two Sigma Advisers, Lp | 380.397 | -24,24 | 5.881 | -23,41 | ||||
| 2026-02-17 | 13F | Aristotle Capital Boston, LLC | 869.253 | -9,64 | 13.439 | -8,64 | ||||
| 2026-02-11 | 13F | Next Capital Management LLC | 27.520 | 0,00 | 425 | 1,19 | ||||
| 2026-01-26 | 13F | Cwm, Llc | 2.194 | -7,31 | 0 | |||||
| 2026-02-17 | 13F | Intrepid Family Office Llc | 265.000 | 6,00 | 4.097 | 7,17 | ||||
| 2026-04-16 | 13F | BI Asset Management Fondsmaeglerselskab A/S | 48.517 | 2,91 | 1 | |||||
| 2026-04-23 | 13F | Muzinich & Co., Inc. | 538.843 | 0,84 | 7.711 | -6,66 | ||||
| 2025-12-09 | 13F/A | Tudor Investment Corp Et Al | 0 | -100,00 | 0 | |||||
| 2026-04-29 | 13F | Nicholas Hoffman & Company, LLC. | 10.000 | 143 | ||||||
| 2026-05-01 | 13F | Wealthspire Advisors, LLC | 25.584 | 1,99 | 366 | -5,43 | ||||
| 2026-02-17 | 13F | Ameriprise Financial Inc | 152.098 | 7,50 | 2.353 | 8,69 | ||||
| 2026-04-23 | 13F | Oppenheimer & Co Inc | 11.110 | 7,86 | 159 | -0,63 | ||||
| 2026-04-28 | 13F | Meridian Investment Counsel Inc. | 62.275 | 52,35 | 891 | 41,20 | ||||
| 2026-02-13 | 13F | Thornburg Investment Management Inc | 4.367.861 | -0,11 | 67.527 | 1,00 | ||||
| 2026-02-06 | 13F | HighTower Advisors, LLC | 0 | -100,00 | 0 | |||||
| 2025-11-14 | 13F | Bard Associates Inc | 0 | -100,00 | 0 | |||||
| 2026-04-22 | 13F | Apollon Wealth Management, LLC | 31.734 | 3,67 | 454 | -4,02 | ||||
| 2026-04-01 | 13F | Confluence Investment Management Llc | 63.966 | -7,75 | 915 | -14,57 | ||||
| 2026-02-23 | 13F | Virtu Financial LLC | 13.271 | 0 | ||||||
| 2026-02-17 | 13F | Raymond James Financial Inc | 344.821 | 2,15 | 5.331 | 3,27 | ||||
| 2026-02-11 | 13F | Simplex Trading, Llc | Put | 1.000 | 400,00 | 15 | ||||
| 2026-02-17 | 13F | D. E. Shaw & Co., Inc. | 14.611 | 226 | ||||||
| 2026-02-11 | 13F | Simplex Trading, Llc | Call | 5.900 | 1.080,00 | 91 | ||||
| 2026-02-19 | 13F | Invesco Ltd. | 0 | -100,00 | 0 | -100,00 | ||||
| 2026-02-17 | 13F | Brevan Howard Capital Management LP | 11.800 | -50,79 | 182 | -50,27 | ||||
| 2026-02-11 | 13F | LPL Financial LLC | 114.273 | 37,66 | 1.767 | 39,16 | ||||
| 2026-01-20 | 13F | Pullen Investment Management, LLC | 0 | -100,00 | 0 | |||||
| 2026-04-08 | 13F | Significant Wealth Partners LLC | 29.349 | 0,00 | 420 | -7,51 | ||||
| 2026-04-14 | 13F | Altrafin AG | 50.852 | 0,08 | 728 | -7,39 | ||||
| 2026-02-13 | 13F | Marshall Wace, Llp | 0 | -100,00 | 0 | -100,00 | ||||
| 2026-04-30 | 13F | Kestra Advisory Services, LLC | 0 | -100,00 | 0 | |||||
| 2026-02-05 | 13F | Allworth Financial LP | 7.482 | 0,00 | 116 | 0,88 | ||||
| 2026-04-10 | 13F | Country Trust Bank | 600 | 0,00 | 9 | -11,11 | ||||
| 2026-02-11 | 13F | Jpmorgan Chase & Co | 1.357.679 | 1,14 | 20.990 | 2,26 | ||||
| 2026-02-11 | 13F | Closed-End Fund Advisors, Inc. | 260.893 | 4.033 | ||||||
| 2026-02-09 | 13F | MQS Management LLC | 0 | -100,00 | 0 | |||||
| 2026-02-17 | 13F | Cetera Investment Advisers | 47.321 | 3,26 | 732 | 4,43 | ||||
| 2026-02-13 | 13F | Colony Group, LLC | 10.202 | 158 | ||||||
| 2025-11-17 | 13F | PharVision Advisers, LLC | 0 | -100,00 | 0 | -100,00 | ||||
| 2026-04-29 | 13F | Montag A & Associates Inc | 30.713 | 0,00 | 440 | -7,38 | ||||
| 2026-04-23 | 13F | CWM Advisors, LLC | 0 | -100,00 | 0 | |||||
| 2026-01-29 | 13F | Comerica Bank | 13.474 | 642,78 | 208 | 670,37 | ||||
| 2026-02-05 | 13F | Rossmore Private Capital | 0 | -100,00 | 0 | |||||
| 2026-02-18 | 13F | GWM Advisors LLC | 0 | -100,00 | 0 | -100,00 | ||||
| 2026-04-14 | 13F | Westend Capital Management LLC | 970 | 0,00 | 14 | -7,14 | ||||
| 2026-02-10 | 13F | Connor, Clark & Lunn Investment Management Ltd. | 32.934 | -51,85 | 509 | -51,29 | ||||
| 2026-03-24 | 13F/A | Barclays Plc | 0 | -100,00 | 0 | |||||
| 2025-11-14 | 13F | Quarry LP | 0 | -100,00 | 0 | |||||
| 2026-04-28 | 13F | Whittier Trust Co Of Nevada Inc | 1.000 | 0,00 | 15 | -6,67 | ||||
| 2026-02-17 | 13F | VARCOV Co. | 25.574 | 395 | ||||||
| 2026-02-17 | 13F | Trexquant Investment LP | 54.055 | -57,65 | 836 | -57,20 | ||||
| 2026-02-10 | 13F | Envestnet Asset Management Inc | 20.855 | 4,79 | 322 | 5,92 | ||||
| 2026-01-20 | 13F | Wall Street Access Asset Management, LLC | 1.689 | 26 | ||||||
| 2026-04-23 | 13F | Triad Investment Management | 375.442 | 200,80 | 5.472 | 183,67 | ||||
| 2026-04-27 | 13F | HB Wealth Management, LLC | 12.614 | 0,00 | 181 | -7,69 | ||||
| 2025-11-19 | 13F | Caitong International Asset Management Co., Ltd | 0 | -100,00 | 0 | |||||
| 2026-02-10 | 13F | COFG Advisors, LLC | 13.411 | 207 | ||||||
| 2026-04-28 | 13F | Golden State Equity Partners | 4.804 | 69 | ||||||
| 2026-02-06 | 13F | Global Retirement Partners, LLC | 4.262 | 0,00 | 66 | 0,00 | ||||
| 2026-02-06 | 13F | Pnc Financial Services Group, Inc. | 205 | 0,00 | 3 | 0,00 | ||||
| 2026-04-22 | 13F | Samalin Investment Counsel, LLC | 34.902 | -11,72 | 499 | -18,33 | ||||
| 2026-04-24 | 13F | Smithbridge Asset Management Inc/de | 0 | -100,00 | 0 | |||||
| 2025-12-16 | 13F | Garde Capital, Inc. | 0 | -100,00 | 0 | |||||
| 2026-04-24 | 13F | Private Advisor Group, LLC | 15.367 | 19,42 | 220 | 10,61 | ||||
| 2026-04-30 | 13F | Sumitomo Mitsui Trust Holdings, Inc. | 378.888 | 0,43 | 5.422 | -7,05 | ||||
| 2025-11-12 | 13F | Simplex Trading, Llc | 0 | -100,00 | 0 |
Other Listings
| US:SLRC | 15,85 $ |