Grundlæggende statistik
| Institutionelle aktier (lange) | 43.175.589 - 83,60% (ex 13D/G) - change of -3,41MM shares -7,31% MRQ |
| Institutionel værdi (lang) | $ 499.416 USD ($1000) |
Institutionelt ejerskab og aktionærer
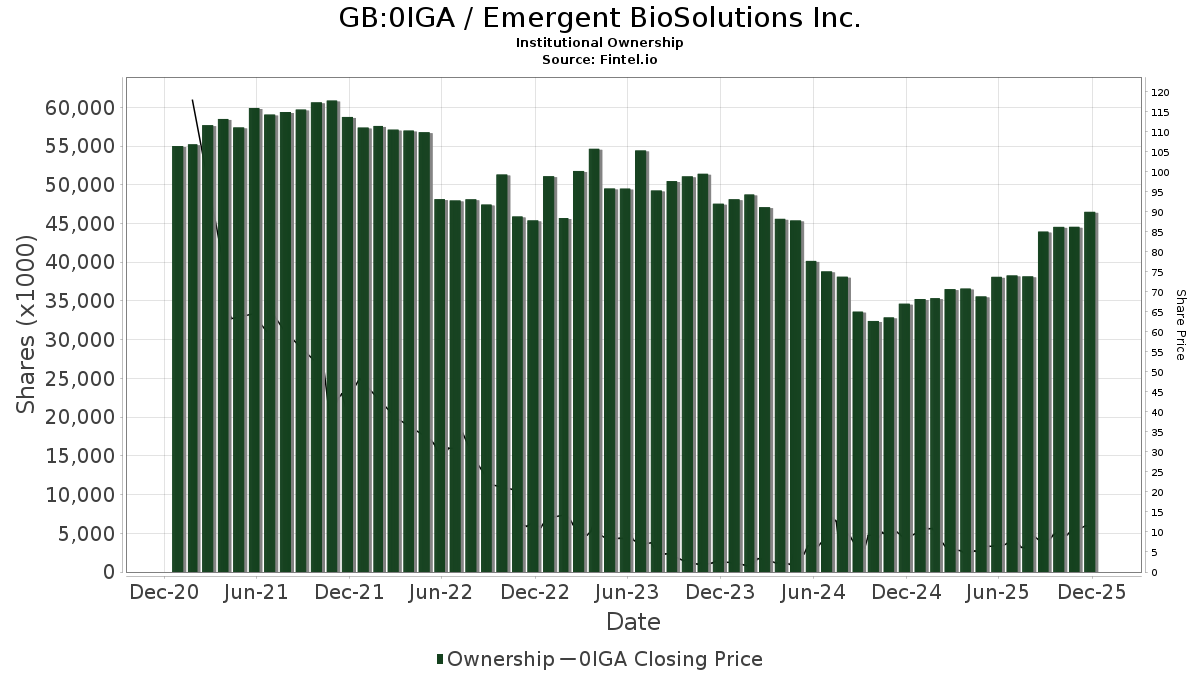
Emergent BioSolutions Inc. (GB:0IGA) har 188 institutionelle ejere og aktionærer, der har indsendt 13D/G- eller 13F-formularer til Securities Exchange Commission (SEC). Disse institutioner har i alt 43,175,589 aktier. Største aktionærer omfatter BlackRock, Inc., Oak Hill Advisors Lp, Vanguard Group Inc, State Street Corp, American Century Companies Inc, Dimensional Fund Advisors Lp, Charles Schwab Investment Management Inc, Palisade Capital Management Llc/nj, Geode Capital Management, Llc, and Morgan Stanley .
Emergent BioSolutions Inc. (LSE:0IGA) institutionel ejerskabsstruktur viser aktuelle positioner i virksomheden efter institutioner og fonde, samt seneste ændringer i positionsstørrelse. Større aktionærer kan omfatte individuelle investorer, investeringsforeninger, hedgefonde eller institutioner. Skema 13D angiver, at investoren besidder (eller besidder) mere end 5 % af virksomheden og har til hensigt (eller har til hensigt at) aktivt at forfølge en ændring i forretningsstrategi. Skema 13G indikerer en passiv investering på over 5%.
The share price as of May 1, 2026 is 8,71 / share. Previously, on May 6, 2025, the share price was 4,80 / share. This represents an increase of 81,66% over that period.
Fondens stemningsscore
Fund Sentiment Score (fka Ownership Accumulation Score) finder de aktier, der bliver mest købt af fonde. Det er resultatet af en sofistikeret, multi-faktor kvantitativ model, der identificerer virksomheder med de højeste niveauer af institutionel akkumulering. Scoringsmodellen bruger en kombination af den samlede stigning i oplyste ejere, ændringerne i porteføljeallokeringer i disse ejere og andre målinger. Tallet går fra 0 til 100, hvor højere tal indikerer et højere niveau af akkumulering for sine jævnaldrende, og 50 er gennemsnittet.
Opdateringsfrekvens: Dagligt
Se Ownership Explorer, som giver en liste over højest rangerende virksomheder.
AI+ Ask Fintel’s AI assistant about Emergent BioSolutions Inc..
Select a question to share a public post with an AI-crafted answer.
Thinking of good questions…
13F og NPORT arkivering
Detaljer om 13F-arkivering er gratis. Detaljer om NP-ansøgninger kræver et premium-medlemskab. Grønne rækker angiver nye positioner. Røde rækker angiver lukkede positioner. Klik på linket ikon for at se den fulde transaktionshistorik.
Opgrader
for at låse premium-data op og eksportere til Excel ![]() .
.
| Fil dato | Kilde | Investor | Type | Gennemsnitlig pris (Øst) |
Aktier | Δ Aktier (%) |
Rapporteret Værdi ($1000) |
Δ Værdi (%) |
Port Alloc (%) |
|
|---|---|---|---|---|---|---|---|---|---|---|
| 2026-01-14 | 13F | Aegis Wealth Management LLC | 0 | -100,00 | 0 | |||||
| 2026-04-08 | 13F | Wealth Enhancement Advisory Services, Llc | 18.579 | 42,74 | 153 | -11,11 | ||||
| 2026-02-13 | 13F | Barclays Plc | 154.892 | -14,02 | 1.914 | 20,53 | ||||
| 2026-04-06 | 13F | GAMMA Investing LLC | 423 | 17,83 | 4 | -25,00 | ||||
| 2026-04-16 | 13F | SG Americas Securities, LLC | 42.394 | 4,60 | 0 | |||||
| 2026-02-17 | 13F | Qube Research & Technologies Ltd | 0 | -100,00 | 0 | |||||
| 2026-02-11 | 13F | Simplex Trading, Llc | 0 | -100,00 | 0 | |||||
| 2026-02-17 | 13F | Trexquant Investment LP | 301.689 | -42,68 | 3.729 | -19,67 | ||||
| 2026-02-17 | 13F | Graham Capital Management, L.P. | 0 | -100,00 | 0 | |||||
| 2025-11-14 | 13F | XTX Topco Ltd | 0 | -100,00 | 0 | -100,00 | ||||
| 2026-02-09 | 13F | Geode Capital Management, Llc | 1.250.010 | -2,24 | 15.454 | 36,99 | ||||
| 2026-02-12 | 13F | Federated Hermes, Inc. | 434.774 | 8,35 | 5.374 | 51,82 | ||||
| 2026-04-30 | 13F | Nisa Investment Advisors, Llc | 500 | 0,00 | 4 | -33,33 | ||||
| 2026-02-12 | 13F | Commonwealth Equity Services, Llc | 0 | -100,00 | 0 | |||||
| 2026-02-13 | 13F | Citigroup Inc | 11.241 | 187,35 | 139 | 305,88 | ||||
| 2026-02-17 | 13F | Ancora Advisors, LLC | 170.469 | 2.107 | ||||||
| 2026-02-13 | 13F | Arrowstreet Capital, Limited Partnership | 54.835 | 62,68 | 678 | 127,95 | ||||
| 2026-02-11 | 13F | MCF Advisors LLC | 0 | -100,00 | 0 | |||||
| 2026-02-17 | 13F | Two Sigma Advisers, Lp | 45.400 | 5,09 | 561 | 47,24 | ||||
| 2026-02-12 | 13F | Hrt Financial Lp | 311.784 | 4 | ||||||
| 2026-02-06 | 13F | EverSource Wealth Advisors, LLC | 726 | 24,53 | 9 | 60,00 | ||||
| 2026-02-06 | 13F | Pnc Financial Services Group, Inc. | 246 | 4,24 | 3 | 50,00 | ||||
| 2026-02-17 | 13F | Susquehanna Portfolio Strategies, LLC | 156.443 | 0,00 | 1.934 | 40,17 | ||||
| 2026-04-13 | 13F | IFP Advisors, Inc | 137 | 174,00 | 1 | |||||
| 2026-02-13 | 13F | OMERS ADMINISTRATION Corp | 0 | -100,00 | 0 | |||||
| 2026-02-17 | 13F | Advisor Group Holdings, Inc. | 15.061 | -2,06 | 186 | 37,78 | ||||
| 2026-04-24 | 13F | Root Financial Partners, LLC | 274 | 2 | ||||||
| 2026-02-13 | 13F | Jacobs Levy Equity Management, Inc | 0 | -100,00 | 0 | -100,00 | ||||
| 2026-02-17 | 13F | Russell Investments Group, Ltd. | 269.965 | 64,90 | 3.337 | 131,19 | ||||
| 2026-02-13 | 13F | Advyzon Investment Management, LLC | 0 | -100,00 | 0 | |||||
| 2026-02-17 | 13F | Alliancebernstein L.p. | 52.060 | 172,85 | 643 | 282,74 | ||||
| 2026-02-13 | 13F | Landscape Capital Management, L.l.c. | 0 | -100,00 | 0 | |||||
| 2026-02-17 | 13F | Citadel Advisors Llc | Put | 73.300 | -15,16 | 906 | 18,77 | |||
| 2026-02-20 | 13F | Sunbelt Securities, Inc. | 3 | 0,00 | 0 | |||||
| 2026-02-17 | 13F | Citadel Advisors Llc | 232.019 | -31,69 | 2.868 | -4,27 | ||||
| 2025-11-13 | 13F | Hsbc Holdings Plc | 0 | -100,00 | 0 | |||||
| 2026-02-13 | 13F/A | Alberta Investment Management Corp | 0 | -100,00 | 0 | |||||
| 2026-04-16 | 13F | Capital Advisors, Ltd. LLC | 30 | 0,00 | 0 | |||||
| 2026-02-17 | 13F | Citadel Advisors Llc | Call | 93.900 | 30,78 | 1.161 | 83,25 | |||
| 2026-02-17 | 13F | Man Group plc | 0 | -100,00 | 0 | |||||
| 2025-11-14 | 13F | Wolverine Trading, Llc | 23.370 | 116,85 | 209 | 205,88 | ||||
| 2025-11-14 | 13F | Wolverine Trading, Llc | Call | 30.500 | 38,01 | 273 | 94,29 | |||
| 2026-02-17 | 13F | Price T Rowe Associates Inc /md/ | 38.983 | -3,61 | 0 | |||||
| 2025-11-14 | 13F | Wolverine Trading, Llc | Put | 39.500 | 123,16 | 353 | 215,18 | |||
| 2026-02-17 | 13F | Wellington Management Group Llp | 168.643 | -8,40 | 2.084 | 28,40 | ||||
| 2026-04-16 | 13F | Baron Wealth Management LLC | 15.120 | 40,19 | 125 | -6,02 | ||||
| 2026-01-26 | 13F | JNBA Financial Advisors | 0 | -100,00 | 0 | |||||
| 2026-01-27 | 13F | Atlantic Edge Private Wealth Management, LLC | 0 | -100,00 | 0 | |||||
| 2026-02-24 | 13F/A | Pacer Advisors, Inc. | 0 | -100,00 | 0 | -100,00 | ||||
| 2025-11-06 | 13F | Stratos Wealth Partners, LTD. | 0 | -100,00 | 0 | |||||
| 2026-02-02 | 13F | Truist Financial Corp | Call | 0 | -100,00 | 0 | -100,00 | |||
| 2026-02-12 | 13F | Campbell & CO Investment Adviser LLC | 100.504 | 125,30 | 1.242 | 216,03 | ||||
| 2026-02-10 | 13F | Bank of New York Mellon Corp | 244.512 | 59,46 | 3.022 | 123,52 | ||||
| 2026-04-23 | 13F | SJS Investment Consulting Inc. | 52 | 225,00 | 0 | |||||
| 2026-02-12 | 13F | Dimensional Fund Advisors Lp | 2.252.605 | 5,25 | 27.841 | 47,47 | ||||
| 2026-02-12 | 13F | Principal Securities, Inc. | 0 | -100,00 | 0 | -100,00 | ||||
| 2026-02-13 | 13F | Squarepoint Ops LLC | 178.295 | 3,18 | 2.204 | 44,55 | ||||
| 2026-02-17 | 13F | Susquehanna International Group, Llp | 377.712 | 35,40 | 4.669 | 89,76 | ||||
| 2026-04-24 | 13F | Bayban | 56 | 0 | ||||||
| 2026-02-11 | 13F | Los Angeles Capital Management Llc | 70.918 | -47,43 | 911 | -23,47 | ||||
| 2026-02-06 | 13F | Global Retirement Partners, LLC | 25 | 0,00 | 0 | |||||
| 2026-02-11 | 13F | Jpmorgan Chase & Co | 21.354 | -4,79 | 264 | 33,50 | ||||
| 2026-04-21 | 13F | One Wealth Advisors, LLC | 16.679 | 138 | ||||||
| 2026-02-17 | 13F | Oak Hill Advisors Lp | 3.613.338 | 0,00 | 44.661 | 169,59 | ||||
| 2026-02-17 | 13F | Kemnay Advisory Services Inc. | 8.660 | 107 | ||||||
| 2026-04-07 | 13F | CoreCap Advisors, LLC | 9 | -96,53 | 0 | -100,00 | ||||
| 2026-02-17 | 13F | Palisade Capital Management Llc/nj | 1.265.766 | -11,24 | 15.645 | 24,39 | ||||
| 2026-01-26 | 13F | Cwm, Llc | 18.009 | 5,52 | 0 | |||||
| 2026-04-30 | 13F | Nuveen, LLC | 106.047 | 0,63 | 880 | -32,41 | ||||
| 2026-02-13 | 13F | Wells Fargo & Company/mn | 69.211 | 32,83 | 855 | 86,27 | ||||
| 2026-02-17 | 13F | Susquehanna International Group, Llp | Put | 37.800 | -49,60 | 467 | -29,35 | |||
| 2026-02-17 | 13F | Susquehanna International Group, Llp | Call | 148.300 | -4,20 | 1.833 | 34,21 | |||
| 2026-02-06 | 13F | Prescott Group Capital Management, L.l.c. | 772.771 | 0,00 | 9.551 | 40,15 | ||||
| 2026-02-12 | 13F | Renaissance Technologies Llc | 577.147 | 11,37 | 7.134 | 56,08 | ||||
| 2026-02-13 | 13F | Morgan Stanley | 1.157.696 | 118,90 | 14.309 | 206,80 | ||||
| 2026-02-17 | 13F | Glenmede Trust Co Na | 16.234 | 32,33 | 201 | 238,98 | ||||
| 2026-04-29 | 13F | Skopos Labs, Inc. | 0 | -100,00 | 0 | |||||
| 2026-02-17 | 13F | Deerfield Management Company, L.p. (series C) | 0 | -100,00 | 0 | |||||
| 2025-11-14 | 13F | Atom Investors LP | 0 | -100,00 | 0 | |||||
| 2026-02-03 | 13F | Morse Asset Management, Inc | 229.308 | 5,22 | 2.834 | 47,45 | ||||
| 2026-02-02 | 13F | Strs Ohio | 0 | -100,00 | 0 | |||||
| 2026-02-13 | 13F | Rafferty Asset Management, LLC | 89.018 | -5,52 | 1.100 | 32,37 | ||||
| 2026-02-13 | 13F | L2 Asset Management, LLC | 10.601 | 4,14 | 131 | 47,19 | ||||
| 2026-02-17 | 13F | Schonfeld Strategic Advisors LLC | 22.910 | 283 | ||||||
| 2026-02-11 | 13F | O'shaughnessy Asset Management, Llc | 373.902 | 152,66 | 4.621 | 254,10 | ||||
| 2026-02-13 | 13F | State Street Corp | 2.696.375 | 10,25 | 33.327 | 54,50 | ||||
| 2026-02-17 | 13F | Creative Planning | 28.548 | 31,30 | 353 | 84,29 | ||||
| 2026-03-16 | 13F/A | Rockefeller Capital Management L.P. | 195 | 2 | ||||||
| 2026-02-11 | 13F | Winton Capital Group Ltd | 29.097 | 42,52 | 360 | 99,44 | ||||
| 2025-11-10 | 13F | Raiffeisen Bank International AG | 0 | -100,00 | 0 | -100,00 | ||||
| 2026-02-13 | 13F | Prudential Financial Inc | 89.935 | -34,90 | 1.112 | -8,78 | ||||
| 2026-02-12 | 13F | Steward Partners Investment Advisory, Llc | 100 | 0,00 | 1 | |||||
| 2026-04-15 | 13F | Fortitude Family Office, LLC | 108 | 1 | ||||||
| 2026-01-27 | 13F | TD Waterhouse Canada Inc. | 0 | -100,00 | 0 | |||||
| 2026-04-13 | 13F | E Fund Management Co., Ltd. | 10.710 | 89 | ||||||
| 2026-02-13 | 13F | Manufacturers Life Insurance Company, The | 0 | -100,00 | 0 | |||||
| 2026-01-30 | 13F | Us Bancorp \de\ | 2.192 | -6,60 | 27 | 35,00 | ||||
| 2026-01-28 | 13F | Universal- Beteiligungs- und Servicegesellschaft mbH | 96.700 | 0,00 | 1.195 | 40,26 | ||||
| 2026-02-11 | 13F | Group One Trading, L.p. | Put | 16.700 | 149,25 | 206 | 249,15 | |||
| 2026-02-11 | 13F | Group One Trading, L.p. | Call | 82.700 | -5,81 | 1.022 | 32,04 | |||
| 2026-04-16 | 13F | Evolve Private Wealth, Llc | 65.754 | 546 | ||||||
| 2026-02-11 | 13F | Group One Trading, L.p. | 7.040 | -92,69 | 87 | -89,75 | ||||
| 2026-02-17 | 13F | Aqr Capital Management Llc | 478.029 | -18,46 | 5.908 | 14,27 | ||||
| 2026-02-11 | 13F | Ameritas Investment Partners, Inc. | 4.560 | 56 | ||||||
| 2026-01-29 | 13F | Vanguard Group Inc | 3.553.999 | 0,38 | 43.927 | 40,67 | ||||
| 2026-02-17 | 13F | MIRAE ASSET GLOBAL ETFS HOLDINGS Ltd. | 29.443 | -2,52 | 363 | 36,09 | ||||
| 2025-11-17 | 13F | PDT Partners, LLC | 0 | -100,00 | 0 | |||||
| 2026-05-01 | 13F | Fifth Third Bancorp | 204 | 2 | ||||||
| 2026-02-17 | 13F | Jain Global LLC | 942.691 | 85,31 | 11.652 | 159,72 | ||||
| 2025-11-06 | 13F | ProShare Advisors LLC | 0 | -100,00 | 0 | -100,00 | ||||
| 2026-02-13 | 13F | Martingale Asset Management L P | 57.848 | 1,56 | 715 | 42,43 | ||||
| 2026-02-12 | 13F | New York State Common Retirement Fund | 522.004 | 0,00 | 6.452 | 40,12 | ||||
| 2026-02-13 | 13F | Ieq Capital, Llc | 31.862 | -7,13 | 394 | 30,13 | ||||
| 2026-02-12 | 13F | Gould Capital, LLC | 100 | 0,00 | 1 | |||||
| 2026-02-12 | 13F | Triumph Capital Management | 700 | 0,00 | 9 | 33,33 | ||||
| 2025-11-14 | 13F | Walleye Trading LLC | Call | 0 | -100,00 | 0 | ||||
| 2026-01-22 | 13F | Advantage Alpha Capital Partners LP | 0 | -100,00 | 0 | |||||
| 2026-02-13 | 13F | Stifel Financial Corp | 19.584 | -3,02 | 242 | 35,96 | ||||
| 2026-04-29 | 13F | Police & Firemen's Retirement System of New Jersey | 13.505 | 0,00 | 112 | -32,53 | ||||
| 2026-04-27 | 13F | Truist Financial Corp | 74.033 | -66,26 | 614 | -77,36 | ||||
| 2026-02-11 | 13F | Stirlingshire Investments, Inc. | 21.110 | 261 | ||||||
| 2026-02-17 | 13F | Hilltop Holdings Inc. | 0 | -100,00 | 0 | |||||
| 2026-04-07 | 13F | Signaturefd, Llc | 299 | 2 | ||||||
| 2026-02-09 | 13F | Huntington National Bank | 1 | 0,00 | 0 | |||||
| 2026-04-28 | 13F | SBI Securities Co., Ltd. | 4.942 | -22,28 | 41 | -47,44 | ||||
| 2025-11-12 | 13F | NewSquare Capital LLC | 0 | -100,00 | 0 | |||||
| 2026-02-13 | 13F | Walleye Capital LLC | 4 | -96,85 | 0 | -100,00 | ||||
| 2026-04-20 | 13F | SILVER OAK SECURITIES, Inc | 106.700 | 0,00 | 886 | -31,77 | ||||
| 2026-02-09 | 13F | Legal & General Group Plc | 12.894 | 162,45 | 159 | 269,77 | ||||
| 2026-04-13 | 13F | True Wealth Design, LLC | 311 | 52,45 | 3 | 0,00 | ||||
| 2026-02-17 | 13F | Raymond James Financial Inc | 28.281 | 350 | ||||||
| 2026-04-27 | 13F | Y-Intercept (Hong Kong) Ltd | 0 | -100,00 | 0 | |||||
| 2026-02-17 | 13F | Northern Trust Corp | 580.622 | -8,97 | 7.176 | 27,57 | ||||
| 2026-04-14 | 13F | Moisand Fitzgerald Tamayo, LLC | 1.136 | 0,00 | 9 | -35,71 | ||||
| 2026-02-13 | 13F | Segall Bryant & Hamill, Llc | 105.980 | 31,08 | 1.310 | 83,59 | ||||
| 2026-02-17 | 13F | Credit Agricole S A | 125.000 | 1.545 | ||||||
| 2026-04-28 | 13F | Abel Hall, LLC | 10.106 | -3,19 | 84 | -35,66 | ||||
| 2026-02-13 | 13F | Walleye Capital LLC | Call | 17.800 | -4,81 | 220 | 34,15 | |||
| 2026-02-13 | 13F | Walleye Capital LLC | Put | 700 | -82,50 | 9 | -77,14 | |||
| 2026-02-17 | 13F | California State Teachers Retirement System | 3.212 | -4,66 | 40 | 34,48 | ||||
| 2026-04-24 | 13F | Profund Advisors Llc | 38.069 | 14,99 | 316 | -22,98 | ||||
| 2026-02-04 | 13F | Dogwood Wealth Management LLC | 188 | 2 | ||||||
| 2026-02-02 | 13F | Avidian Wealth Solutions, LLC | 0 | -100,00 | 0 | |||||
| 2026-02-17 | 13F | Aristeia Capital Llc | 27.949 | 345 | ||||||
| 2026-02-17 | 13F | Coppell Advisory Solutions LLC | 161.307 | 1.961 | ||||||
| 2026-02-17 | 13F | EFG International AG | 1.920 | 24 | ||||||
| 2026-02-17 | 13F | Aquatic Capital Management LLC | 28.751 | 170,42 | 355 | 281,72 | ||||
| 2026-01-29 | 13F | UBS Group AG | 347.805 | -20,84 | 4.299 | 10,92 | ||||
| 2026-02-17 | 13F | Zacks Investment Management | 11.432 | 141 | ||||||
| 2026-02-11 | 13F | Deutsche Bank Ag\ | 181.744 | 1,08 | 2.246 | 41,70 | ||||
| 2026-02-17 | 13F | Brevan Howard Capital Management LP | 10.087 | -27,43 | 125 | 1,64 | ||||
| 2026-02-13 | 13F | Charles Schwab Investment Management Inc | 1.618.903 | 17,16 | 20.010 | 64,18 | ||||
| 2026-02-13 | 13F | Rhumbline Advisers | 68.665 | -15,08 | 849 | 18,93 | ||||
| 2026-04-21 | 13F | Financial Consulate, Inc | 88 | 0,00 | 1 | -100,00 | ||||
| 2026-02-12 | 13F | Wealthspire Advisors, LLC | 0 | -100,00 | 0 | |||||
| 2025-11-13 | 13F | Glenmede Investment Management, LP | 20.798 | 36,82 | 183 | 90,63 | ||||
| 2025-11-06 | 13F | CBIZ Investment Advisory Services, LLC | 0 | -100,00 | 0 | |||||
| 2026-04-24 | 13F | National Asset Management, Inc. | 0 | -100,00 | 0 | |||||
| 2026-04-24 | 13F | UMA Financial Services, Inc. | 158 | 0,00 | 1 | 0,00 | ||||
| 2025-11-06 | 13F | Ameritas Advisory Services, LLC | 0 | -100,00 | 0 | |||||
| 2026-02-13 | 13F | Great West Life Assurance Co /can/ | 3.645 | 0 | ||||||
| 2025-11-14 | 13F | National Bank Of Canada /fi/ | 0 | -100,00 | 0 | |||||
| 2026-04-24 | 13F | Raiffeisen Bank International AG | Call | 400 | 0,00 | 3 | -25,00 | |||
| 2026-02-13 | 13F | Ubs Asset Management Americas Inc | 294 | 4 | ||||||
| 2026-02-11 | 13F | Simplex Trading, Llc | Put | 3.500 | 84,21 | 43 | ||||
| 2026-02-17 | 13F | Fmr Llc | 118.311 | -37,13 | 1.462 | -11,87 | ||||
| 2026-02-17 | 13F | Wiley Bros.-aintree Capital, Llc | 17.000 | 210 | ||||||
| 2026-02-11 | 13F | Simplex Trading, Llc | Call | 108.400 | 125,83 | 1.340 | ||||
| 2026-02-10 | 13F | Goldman Sachs Group Inc | 740.100 | 19,18 | 9.148 | 67,01 | ||||
| 2026-02-02 | 13F | Wolverine Asset Management Llc | 174.933 | 0,00 | 2.162 | 40,21 | ||||
| 2026-04-07 | 13F | Farther Finance Advisors, LLC | 2.464 | -60,02 | 21 | -73,68 | ||||
| 2026-02-13 | 13F | JustInvest LLC | 18.255 | 1,94 | 226 | 43,31 | ||||
| 2026-04-27 | 13F | Sierra Summit Advisors Llc | 0 | -100,00 | 0 | |||||
| 2026-02-10 | 13F | Rothschild Investment Llc | 55 | 1 | ||||||
| 2026-02-17 | 13F | Susquehanna Fundamental Investments, Llc | 95.070 | 0,00 | 1.175 | 40,21 | ||||
| 2026-04-21 | 13F | Vise Technologies, Inc. | 10.582 | 0,00 | 131 | 0,00 | ||||
| 2026-02-13 | 13F | MAI Capital Management | 53 | 1 | ||||||
| 2026-04-28 | 13F | Golden State Equity Partners | 5 | 0 | ||||||
| 2026-02-17 | 13F | Two Sigma Investments, Lp | 258.500 | -1,08 | 3.195 | 38,67 | ||||
| 2026-04-13 | 13F | Massmutual Trust Co Fsb/adv | 410 | 0,00 | 3 | -40,00 | ||||
| 2026-02-03 | 13F | Strengthening Families & Communities, LLC | 9 | 0,00 | 0 | |||||
| 2026-02-17 | 13F | Jones Financial Companies Lllp | 1.028 | 0,00 | 13 | 33,33 | ||||
| 2026-02-19 | 13F | Invesco Ltd. | 206.002 | -45,83 | 2.546 | -24,09 | ||||
| 2026-02-13 | 13F | Mariner, LLC | 21.274 | 18,41 | 262 | 65,82 | ||||
| 2025-11-03 | 13F | GPS Wealth Strategies Group, LLC | 0 | -100,00 | 0 | |||||
| 2026-02-17 | 13F | Millennium Management Llc | 237.674 | 205,40 | 2.938 | 328,13 | ||||
| 2026-02-17 | 13F | Dark Forest Capital Management Lp | 0 | -100,00 | 0 | -100,00 | ||||
| 2026-02-17 | 13F | Royal Bank Of Canada | 2.160 | 26,54 | 26 | 85,71 | ||||
| 2026-02-10 | 13F | State of Wyoming | 0 | -100,00 | 0 | |||||
| 2026-02-12 | 13F | Jane Street Group, Llc | 395.457 | 4.888 | ||||||
| 2026-02-12 | 13F | Jane Street Group, Llc | Put | 51.600 | 0,39 | 638 | 40,62 | |||
| 2026-02-12 | 13F | Jane Street Group, Llc | Call | 181.000 | -63,68 | 2.237 | -49,10 | |||
| 2026-03-04 | 13F | SHP Wealth Management | 5 | 0 | ||||||
| 2026-02-06 | 13F | Keystone Financial Group | 29.088 | -6,99 | 360 | 30,55 | ||||
| 2026-02-10 | 13F | Bnp Paribas Arbitrage, Sa | 60.361 | 451,65 | 746 | 677,08 | ||||
| 2026-04-24 | 13F | James Investment Research Inc | 61.963 | 0,10 | 514 | -32,81 | ||||
| 2026-01-29 | 13F | Quest 10 Wealth Builders, Inc. | 102 | 0,00 | 1 | |||||
| 2025-11-14 | 13F | Walleye Trading LLC | Put | 0 | -100,00 | 0 | ||||
| 2026-02-11 | 13F | Allianz Asset Management GmbH | 290.701 | 3,89 | 3.593 | 45,64 | ||||
| 2026-02-17 | 13F | Cetera Investment Advisers | 219.483 | 1,62 | 2.713 | 42,36 | ||||
| 2026-02-17 | 13F | National Asset Management, Inc. | Call | 0 | -100,00 | 0 | ||||
| 2026-02-10 | 13F | Acadian Asset Management Llc | 1.110.682 | -5,69 | 14 | 30,00 | ||||
| 2026-02-12 | 13F | MetLife Investment Management, LLC | 31.419 | 18,86 | 388 | 66,52 | ||||
| 2026-02-13 | 13F | SRS Capital Advisors, Inc. | 36 | -98,64 | 0 | -100,00 | ||||
| 2026-02-17 | 13F | Ameriprise Financial Inc | 11.235 | -64,07 | 139 | -49,82 | ||||
| 2026-02-05 | 13F | Allworth Financial LP | 614 | 36,75 | 8 | 133,33 | ||||
| 2026-02-17 | 13F | Weiss Asset Management LP | 37.785 | 467 | ||||||
| 2026-02-11 | 13F | LPL Financial LLC | 80.100 | 149,03 | 990 | 249,82 | ||||
| 2026-01-12 | 13F | Rialto Wealth Management, LLC | 91 | 0,00 | 1 | |||||
| 2026-02-12 | 13F | Bank Of Montreal /can/ | 27.428 | 0,00 | 339 | 40,66 | ||||
| 2026-02-12 | 13F | Fuller & Thaler Asset Management, Inc. | 110.160 | -1,70 | 1.362 | 37,75 | ||||
| 2026-02-10 | 13F | Axq Capital, Lp | 13.176 | 163 | ||||||
| 2026-02-10 | 13F | Globeflex Capital L P | 241.298 | 0,00 | 2.982 | 40,13 | ||||
| 2026-04-30 | 13F | Costello Asset Management, INC | 400 | 0,00 | 3 | -25,00 | ||||
| 2026-02-05 | 13F | Amalgamated Bank | 1.639 | -11,07 | 0 | |||||
| 2026-01-26 | 13F | PFG Investments, LLC | 0 | -100,00 | 0 | |||||
| 2026-02-13 | 13F | Virtus ETF Advisers LLC | 19.500 | 241 | ||||||
| 2026-02-17 | 13F | D. E. Shaw & Co., Inc. | 723.217 | 125,18 | 8.939 | 215,61 | ||||
| 2025-11-12 | 13F | Headlands Technologies LLC | 0 | -100,00 | 0 | -100,00 | ||||
| 2026-04-28 | 13F | Harbor Capital Advisors, Inc. | 0 | -100,00 | 0 | |||||
| 2026-02-10 | 13F | Verus Capital Partners, Llc | 10.000 | 0,00 | 124 | 39,77 | ||||
| 2026-04-20 | 13F | Ritholtz Wealth Management | 65.268 | -40,08 | 542 | -59,81 | ||||
| 2026-02-11 | 13F | Franklin Resources Inc | 78.945 | 2,29 | 976 | 43,38 | ||||
| 2025-11-13 | 13F | EntryPoint Capital, LLC | 0 | -100,00 | 0 | |||||
| 2026-02-09 | 13F | Quest Partners LLC | 1.549 | -92,18 | 19 | -89,08 | ||||
| 2026-02-17 | 13F | Jump Financial, LLC | 42.142 | -86,58 | 521 | -81,22 | ||||
| 2026-04-22 | 13F | Sterling Capital Management LLC | 1.739 | -42,17 | 14 | -62,16 | ||||
| 2026-02-11 | 13F | Meeder Asset Management Inc | 1.581 | 20 | ||||||
| 2026-02-11 | 13F | Brandywine Global Investment Management, LLC | 130.310 | -3,77 | 1.611 | 34,84 | ||||
| 2026-04-20 | 13F | Assenagon Asset Management S.A. | 56.455 | -2,34 | 469 | -34,45 | ||||
| 2026-04-28 | 13F | Flagship Harbor Advisors, Llc | 0 | -100,00 | 0 | |||||
| 2026-04-30 | 13F | Torren Management, LLC | 137 | -95,43 | 1 | -97,30 | ||||
| 2026-02-06 | 13F | Covestor Ltd | 2.706 | -32,54 | 0 | |||||
| 2026-02-13 | 13F | First Trust Advisors Lp | 14.509 | 179 | ||||||
| 2026-02-17 | 13F | Public Employees Retirement System Of Ohio | 5.099 | -61,86 | 63 | -46,15 | ||||
| 2026-02-13 | 13F | Marshall Wace, Llp | 743.455 | -18,52 | 9.189 | 14,19 | ||||
| 2025-11-07 | 13F | Gsa Capital Partners Llp | 0 | -100,00 | 0 | |||||
| 2026-04-17 | 13F | Values First Advisors, Inc. | 307.880 | 0,93 | 2.555 | -32,23 | ||||
| 2026-01-23 | 13F | Optima Capital Llc | 55 | 1 | ||||||
| 2026-02-17 | 13F | Sherbrooke Park Advisers Llc | 0 | -100,00 | 0 | |||||
| 2026-02-17 | 13F | Herold Advisors, Inc. | 10.000 | 0,00 | 124 | 39,77 | ||||
| 2026-02-13 | 13F | American Century Companies Inc | 2.439.439 | 2,40 | 30.151 | 43,49 | ||||
| 2026-02-12 | 13F | BlackRock, Inc. | 4.254.397 | -0,20 | 52.584 | 39,85 | ||||
| 2026-02-10 | 13F | Connor, Clark & Lunn Investment Management Ltd. | 777.999 | -31,29 | 9.616 | -3,71 | ||||
| 2026-02-06 | 13F | Lsv Asset Management | 901.000 | 4,22 | 11 | 57,14 | ||||
| 2026-02-09 | 13F | Hartland & Co., LLC | 9 | -95,14 | 0 | -100,00 | ||||
| 2026-02-11 | 13F | Cerity Partners LLC | 18.415 | 3,20 | 228 | 44,59 | ||||
| 2026-01-21 | 13F | Palumbo Wealth Management LLC | 117.121 | 143,01 | 1.448 | 240,47 | ||||
| 2026-02-17 | 13F | Bank Of America Corp /de/ | 146.944 | 64,18 | 1.816 | 130,16 | ||||
| 2026-01-29 | 13F | Comerica Bank | 265 | 3 | ||||||
| 2026-02-17 | 13F | Tower Research Capital LLC (TRC) | 7.238 | 115,87 | 89 | 206,90 | ||||
| 2025-11-03 | 13F | Hussman Strategic Advisors, Inc. | 0 | -100,00 | 0 | |||||
| 2026-02-10 | 13F/A | Northwestern Mutual Wealth Management Co | 78 | 1 | ||||||
| 2026-02-13 | 13F | Caitong International Asset Management Co., Ltd | 409 | 5 | ||||||
| 2025-11-14 | 13F | Algert Global Llc | 0 | -100,00 | 0 | |||||
| 2026-04-28 | 13F | AdvisorShares Investments LLC | 0 | -100,00 | 0 | |||||
| 2026-02-10 | 13F | Intech Investment Management Llc | 29.494 | -13,22 | 365 | 21,74 | ||||
| 2026-03-26 | 13F | Leonteq Securities AG | 0 | -100,00 | 0 |