Grundlæggende statistik
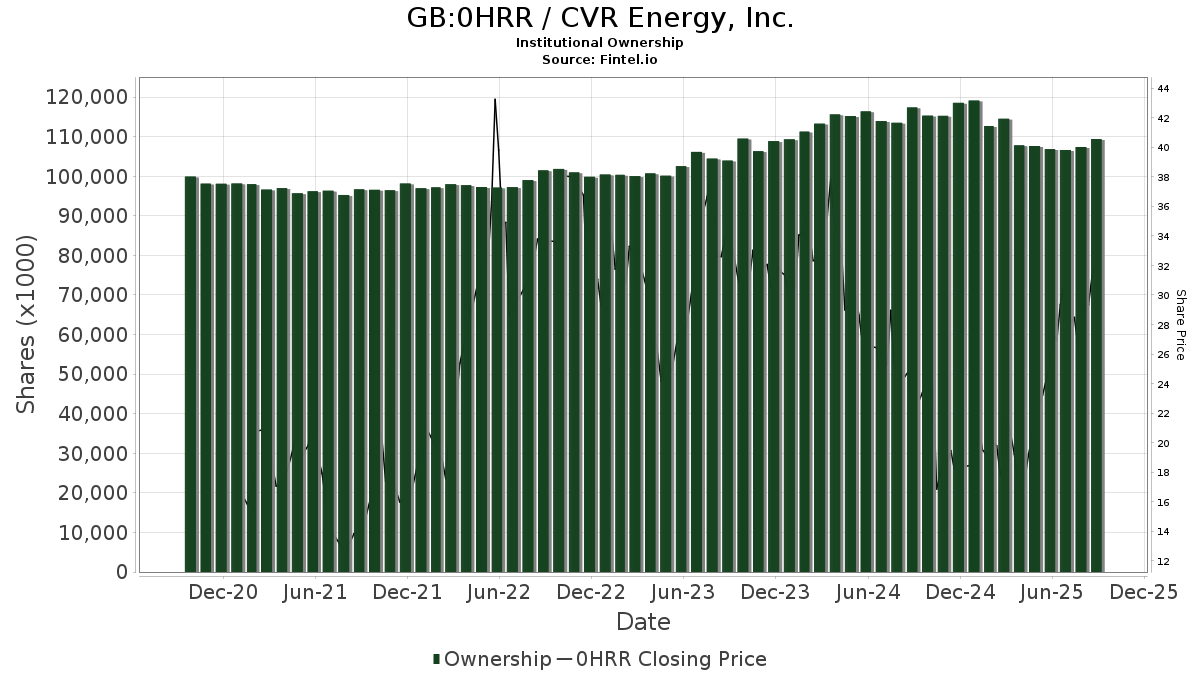
| Institutionelle aktier (lange) | 103.164.120 - 102,62% (ex 13D/G) - change of -5,99MM shares -5,49% MRQ |
| Institutionel værdi (lang) | $ 2.619.114 USD ($1000) |
Institutionelt ejerskab og aktionærer
CVR Energy, Inc. (GB:0HRR) har 223 institutionelle ejere og aktionærer, der har indsendt 13D/G- eller 13F-formularer til Securities Exchange Commission (SEC). Disse institutioner har i alt 103,164,120 aktier. Største aktionærer omfatter Icahn Carl C, BlackRock, Inc., Vanguard Group Inc, State Street Corp, Dimensional Fund Advisors Lp, Jacobs Levy Equity Management, Inc, Renaissance Technologies Llc, Two Sigma Investments, Lp, UBS Group AG, and Morgan Stanley .
CVR Energy, Inc. (LSE:0HRR) institutionel ejerskabsstruktur viser aktuelle positioner i virksomheden efter institutioner og fonde, samt seneste ændringer i positionsstørrelse. Større aktionærer kan omfatte individuelle investorer, investeringsforeninger, hedgefonde eller institutioner. Skema 13D angiver, at investoren besidder (eller besidder) mere end 5 % af virksomheden og har til hensigt (eller har til hensigt at) aktivt at forfølge en ændring i forretningsstrategi. Skema 13G indikerer en passiv investering på over 5%.
The share price as of April 23, 2026 is 31,39 / share. Previously, on April 30, 2025, the share price was 19,18 / share. This represents an increase of 63,62% over that period.
Fondens stemningsscore
Fund Sentiment Score (fka Ownership Accumulation Score) finder de aktier, der bliver mest købt af fonde. Det er resultatet af en sofistikeret, multi-faktor kvantitativ model, der identificerer virksomheder med de højeste niveauer af institutionel akkumulering. Scoringsmodellen bruger en kombination af den samlede stigning i oplyste ejere, ændringerne i porteføljeallokeringer i disse ejere og andre målinger. Tallet går fra 0 til 100, hvor højere tal indikerer et højere niveau af akkumulering for sine jævnaldrende, og 50 er gennemsnittet.
Opdateringsfrekvens: Dagligt
Se Ownership Explorer, som giver en liste over højest rangerende virksomheder.
AI+ Ask Fintel’s AI assistant about CVR Energy, Inc..
Select a question to share a public post with an AI-crafted answer.
Thinking of good questions…
13F og NPORT arkivering
Detaljer om 13F-arkivering er gratis. Detaljer om NP-ansøgninger kræver et premium-medlemskab. Grønne rækker angiver nye positioner. Røde rækker angiver lukkede positioner. Klik på linket ikon for at se den fulde transaktionshistorik.
Opgrader
for at låse premium-data op og eksportere til Excel ![]() .
.
| Fil dato | Kilde | Investor | Type | Gennemsnitlig pris (Øst) |
Aktier | Δ Aktier (%) |
Rapporteret Værdi ($1000) |
Δ Værdi (%) |
Port Alloc (%) |
|
|---|---|---|---|---|---|---|---|---|---|---|
| 2026-02-17 | 13F/A | RBF Capital, LLC | 20.000 | -50,00 | 509 | -65,18 | ||||
| 2026-02-17 | 13F | Jump Financial, LLC | 76.961 | -73,38 | 1.958 | -81,44 | ||||
| 2026-02-17 | 13F | Tower Research Capital LLC (TRC) | 844 | -84,08 | 21 | -89,12 | ||||
| 2026-02-10 | 13F | Rothschild Investment Llc | 65 | 0,00 | 2 | -50,00 | ||||
| 2026-02-11 | 13F | Inceptionr Llc | 0 | -100,00 | 0 | |||||
| 2026-02-12 | 13F | Skopos Labs, Inc. | 0 | -100,00 | 0 | |||||
| 2026-02-17 | 13F | Advisory Services Network, LLC | 0 | -100,00 | 0 | |||||
| 2026-02-13 | 13F | Quarry LP | 172 | -87,48 | 4 | -92,00 | ||||
| 2026-02-17 | 13F | Gotham Asset Management, LLC | 17.139 | 436 | ||||||
| 2026-02-17 | 13F | XTX Topco Ltd | 138.160 | 348,63 | 3.515 | 212,91 | ||||
| 2026-02-17 | 13F | Two Sigma Investments, Lp | 914.272 | 318,39 | 23.259 | 191,80 | ||||
| 2025-11-12 | 13F | Sciencast Management LP | 0 | -100,00 | 0 | -100,00 | ||||
| 2026-04-08 | 13F | DiNuzzo Private Wealth, Inc. | 2 | 0,00 | 0 | |||||
| 2026-04-15 | 13F | Gf Fund Management Co. Ltd. | 9.724 | 13,81 | 327 | 50,69 | ||||
| 2026-04-29 | 13F | Klp Kapitalforvaltning As | 11.000 | 13,40 | 370 | 50,41 | ||||
| 2026-02-10 | 13F | Bnp Paribas Arbitrage, Sa | 614.765 | -20,79 | 15.640 | -44,76 | ||||
| 2026-02-13 | 13F | Walleye Capital LLC | Call | 1.900 | 0,00 | 48 | -30,43 | |||
| 2026-04-28 | 13F | Flagship Harbor Advisors, Llc | 0 | -100,00 | 0 | |||||
| 2026-02-13 | 13F | Walleye Capital LLC | Put | 5.400 | -38,64 | 137 | -57,32 | |||
| 2026-02-13 | 13F | Walleye Capital LLC | 4.886 | 124 | ||||||
| 2026-02-13 | 13F | Rhumbline Advisers | 94.962 | -7,38 | 2.416 | -35,43 | ||||
| 2025-11-14 | 13F | Freestone Grove Partners LP | 0 | -100,00 | 0 | |||||
| 2026-02-13 | 13F | Bridgefront Capital, LLC | 18.309 | 466 | ||||||
| 2026-02-17 | 13F | Capstone Investment Advisors, Llc | 0 | -100,00 | 0 | -100,00 | ||||
| 2025-11-18 | 13F | Pictet Asset Management Holding SA | 0 | -100,00 | 0 | -100,00 | ||||
| 2026-02-13 | 13F | Toroso Investments, LLC | 0 | -100,00 | 0 | |||||
| 2026-02-26 | 13F | TD Capital Management LLC | 9 | 0 | ||||||
| 2026-02-09 | 13F | Quest Partners LLC | 16.562 | 2.300,29 | 421 | 1.584,00 | ||||
| 2026-04-28 | 13F | Harbor Capital Advisors, Inc. | 1.521 | 50,74 | 0 | |||||
| 2026-04-24 | 13F | Yousif Capital Management, Llc | 8.032 | 270 | ||||||
| 2026-02-17 | 13F | Advisor Group Holdings, Inc. | 13.645 | -7,68 | 347 | -25,54 | ||||
| 2026-02-12 | 13F | Dimensional Fund Advisors Lp | 1.643.049 | 0,09 | 41.798 | -30,20 | ||||
| 2026-02-13 | 13F | Neo Ivy Capital Management | 156.959 | 140,22 | 3.993 | 67,56 | ||||
| 2026-02-18 | 13F | Vident Advisory, LLC | 30.822 | 369,42 | 784 | 228,03 | ||||
| 2026-02-13 | 13F | Public Sector Pension Investment Board | 0 | -100,00 | 0 | |||||
| 2026-02-13 | 13F | Charles Schwab Investment Management Inc | 835.608 | -10,08 | 21.258 | -37,29 | ||||
| 2026-01-29 | 13F | Teachers Retirement System Of The State Of Kentucky | 7.557 | -20,49 | 0 | |||||
| 2025-11-14 | 13F | Ion Asset Management Ltd. | Call | 0 | -100,00 | 0 | -100,00 | |||
| 2026-01-28 | 13F | Arizona State Retirement System | 9.759 | -6,26 | 248 | -34,56 | ||||
| 2026-02-13 | 13F | Manufacturers Life Insurance Company, The | 0 | -100,00 | 0 | |||||
| 2026-02-09 | 13F | Jefferies Financial Group Inc. | Put | 0 | -100,00 | 0 | -100,00 | |||
| 2026-04-27 | 13F | Polaris Capital Management, LLC | 67.000 | 0,00 | 2.255 | 32,28 | ||||
| 2026-01-30 | 13F | Us Bancorp \de\ | 115 | -96,31 | 3 | -98,23 | ||||
| 2026-01-28 | 13F | Salomon & Ludwin, LLC | 192 | -6,34 | 5 | -42,86 | ||||
| 2026-02-10 | 13F | Nomura Asset Management Co Ltd | 1.300 | 0,00 | 33 | -29,79 | ||||
| 2026-02-17 | 13F | Voloridge Investment Management, Llc | 81.161 | 120,00 | 2.065 | 53,46 | ||||
| 2026-02-13 | 13F | Umb Bank N A/mo | 204 | -19,37 | 5 | -44,44 | ||||
| 2026-04-22 | 13F | Sterling Capital Management LLC | 201 | -2,43 | 7 | 20,00 | ||||
| 2026-02-06 | 13F | Covestor Ltd | 6 | 0,00 | 0 | |||||
| 2026-04-13 | 13F | IFP Advisors, Inc | 141 | 200,00 | 5 | 300,00 | ||||
| 2026-02-09 | 13F | Royce & Associates Lp | 16.567 | -66,83 | 421 | -76,88 | ||||
| 2026-02-17 | 13F | Fmr Llc | 98.124 | -47,96 | 2.496 | -63,72 | ||||
| 2026-01-30 | 13F | Rogco, Lp | 850 | 0,00 | 22 | -32,26 | ||||
| 2026-02-13 | 13F | American Century Companies Inc | 145.153 | -54,03 | 3.693 | -67,95 | ||||
| 2026-02-11 | 13F | Allianz Asset Management GmbH | 656.748 | 43,33 | 16.708 | -0,05 | ||||
| 2026-04-07 | 13F | Farther Finance Advisors, LLC | 760 | 38,94 | 24 | 84,62 | ||||
| 2026-02-12 | 13F | Quadrant Capital Group Llc | 6.693 | 0,00 | 170 | -30,33 | ||||
| 2026-02-17 | 13F | Trexquant Investment LP | 72.132 | 1.835 | ||||||
| 2026-02-13 | 13F | Pinnacle Wealth Planning Services, Inc. | 978 | 25 | ||||||
| 2026-02-13 | 13F | Thomist Capital Management, LP | 199.200 | 5.028 | ||||||
| 2026-02-17 | 13F | Occudo Quantitative Strategies Lp | 0 | -100,00 | 0 | |||||
| 2026-02-11 | 13F | CNB Bank | 250 | 0,00 | 6 | -33,33 | ||||
| 2026-02-17 | 13F | Aster Capital Management (DIFC) Ltd | 1.580 | 40 | ||||||
| 2026-02-13 | 13F | SRS Capital Advisors, Inc. | 53 | 1 | ||||||
| 2026-02-17 | 13F | Susquehanna Portfolio Strategies, LLC | 36.116 | 0,00 | 919 | -30,30 | ||||
| 2026-01-15 | 13F | Nisa Investment Advisors, Llc | 425 | -37,96 | 11 | -58,33 | ||||
| 2026-04-14 | 13F | Congress Asset Management Co /ma | 90.726 | 16,65 | 3.053 | 54,30 | ||||
| 2026-02-13 | 13F | Smartleaf Asset Management LLC | 186 | 1.140,00 | 5 | |||||
| 2026-02-17 | 13F | Canada Pension Plan Investment Board | 38.600 | 982 | ||||||
| 2026-02-17 | 13F | Public Employees Retirement System Of Ohio | 1.742 | -11,39 | 44 | -38,03 | ||||
| 2026-02-13 | 13F | Mariner, LLC | 0 | -100,00 | 0 | |||||
| 2026-02-18 | 13F | Garton & Associates Financial Advisors LLC | 775 | 20 | ||||||
| 2026-01-30 | 13F | Torren Management, LLC | 848 | 22 | ||||||
| 2026-02-02 | 13F | Wolverine Asset Management Llc | Put | 193.800 | -51,56 | 4.930 | -66,22 | |||
| 2026-02-12 | 13F | Federation des caisses Desjardins du Quebec | 30 | 0,00 | 1 | -100,00 | ||||
| 2026-02-12 | 13F | Voya Investment Management Llc | 0 | -100,00 | 0 | |||||
| 2026-04-23 | 13F | Marquette Asset Management, LLC | 73 | 0,00 | 2 | 100,00 | ||||
| 2026-02-13 | 13F | Victory Capital Management Inc | 102.498 | 380,56 | 2.608 | 235,09 | ||||
| 2025-11-14 | 13F | Texas Permanent School Fund | 0 | -100,00 | 0 | -100,00 | ||||
| 2025-11-03 | 13F | SummerHaven Investment Management, LLC | 0 | -100,00 | 0 | |||||
| 2026-02-12 | 13F | Steward Partners Investment Advisory, Llc | 46 | 0,00 | 1 | 0,00 | ||||
| 2026-02-11 | 13F | O'shaughnessy Asset Management, Llc | 0 | -100,00 | 0 | |||||
| 2026-02-11 | 13F | Los Angeles Capital Management Llc | 161 | 6 | ||||||
| 2026-02-17 | 13F | Clear Street Markets Llc | 0 | -100,00 | 0 | |||||
| 2026-02-17 | 13F | Schonfeld Strategic Advisors LLC | 0 | -100,00 | 0 | |||||
| 2026-02-17 | 13F | Optiver Holding B.V. | 0 | -100,00 | 0 | |||||
| 2026-04-29 | 13F | Police & Firemen's Retirement System of New Jersey | 8.557 | 0,00 | 288 | 32,26 | ||||
| 2026-02-13 | 13F | Financial Network Wealth Advisors LLC | 192 | 0,00 | 5 | -42,86 | ||||
| 2026-02-11 | 13F | SOUTH STATE Corp | 0 | -100,00 | 0 | |||||
| 2026-01-29 | 13F | IMC-Chicago, LLC | Put | 28.100 | 14,69 | 715 | -20,04 | |||
| 2026-02-12 | 13F | Campbell & CO Investment Adviser LLC | 230.914 | 1.610,60 | 5.874 | 1.093,90 | ||||
| 2026-04-16 | 13F | Capital Advisors, Ltd. LLC | 65 | 0,00 | 0 | |||||
| 2026-01-29 | 13F | IMC-Chicago, LLC | Call | 30.300 | -31,76 | 771 | -52,44 | |||
| 2026-02-10 | 13F | Goldman Sachs Group Inc | 528.509 | 49,21 | 13.445 | 4,06 | ||||
| 2026-02-09 | 13F | Hartland & Co., LLC | 0 | -100,00 | 0 | |||||
| 2026-02-11 | 13F | Group One Trading, L.p. | Call | 1.000 | -95,92 | 25 | -97,20 | |||
| 2026-02-06 | 13F | EverSource Wealth Advisors, LLC | 763 | 27,59 | 19 | -9,52 | ||||
| 2026-02-11 | 13F | Group One Trading, L.p. | Put | 20.600 | -32,24 | 524 | -52,71 | |||
| 2026-02-11 | 13F | Group One Trading, L.p. | 25.328 | 115,91 | 644 | 50,82 | ||||
| 2026-02-11 | 13F | Parallel Advisors, LLC | 139 | 0,00 | 4 | -40,00 | ||||
| 2026-02-13 | 13F | Gts Securities Llc | 0 | -100,00 | 0 | |||||
| 2026-02-09 | 13F | Jefferies Financial Group Inc. | 10.692 | 38,32 | 272 | -3,20 | ||||
| 2026-02-05 | 13F | Allworth Financial LP | 83 | 5,06 | 2 | 0,00 | ||||
| 2026-02-17 | 13F | Magnetar Financial LLC | 181.874 | 4.627 | ||||||
| 2026-02-17 | 13F | Virtus Investment Advisers, Inc. | 0 | -100,00 | 0 | |||||
| 2026-02-17 | 13F | Bayesian Capital Management, LP | 0 | -100,00 | 0 | |||||
| 2026-02-17 | 13F | Nomura Holdings Inc | 0 | -100,00 | 0 | -100,00 | ||||
| 2026-02-12 | 13F | Bank Of Montreal /can/ | 0 | -100,00 | 0 | |||||
| 2026-02-17 | 13F | ExodusPoint Capital Management, LP | 0 | -100,00 | 0 | -100,00 | ||||
| 2026-03-03 | 13F/A | Caitong International Asset Management Co., Ltd | 3.394 | 1.817,51 | 86 | 1.333,33 | ||||
| 2026-04-27 | 13F | Y-Intercept (Hong Kong) Ltd | 0 | -100,00 | 0 | |||||
| 2026-01-29 | 13F | Vanguard Group Inc | 3.705.809 | 2,97 | 94.276 | -28,19 | ||||
| 2026-04-21 | 13F | Gilpin Wealth Management, Llc | 5 | 0 | ||||||
| 2026-02-17 | 13F | Millennium Management Llc | 18.827 | -97,73 | 479 | -98,42 | ||||
| 2026-04-27 | 13F | Counterpoint Mutual Funds LLC | 16.517 | 556 | ||||||
| 2026-01-14 | 13F | Hennion & Walsh Asset Management, Inc. | 0 | -100,00 | 0 | |||||
| 2026-02-17 | 13F | Two Sigma Advisers, Lp | 314.000 | 2.862,26 | 7.988 | 1.969,43 | ||||
| 2026-01-27 | 13F | TD Waterhouse Canada Inc. | 380 | 0,00 | 10 | -30,77 | ||||
| 2026-02-17 | 13F | PDT Partners, LLC | 198.091 | 12,37 | 5.039 | -21,63 | ||||
| 2026-02-02 | 13F | Hussman Strategic Advisors, Inc. | 42.000 | 1.068 | ||||||
| 2026-01-29 | 13F | Comerica Bank | 6.573 | -19,94 | 167 | -44,15 | ||||
| 2026-02-17 | 13F | PharVision Advisers, LLC | 0 | -100,00 | 0 | |||||
| 2026-02-18 | 13F | GWM Advisors LLC | 13.394 | 5,59 | 341 | -26,41 | ||||
| 2026-02-11 | 13F | Illinois Municipal Retirement Fund | 17.741 | 3,86 | 451 | -27,61 | ||||
| 2026-02-17 | 13F | Voleon Capital Management Lp | 206.037 | -25,31 | 5.242 | -47,92 | ||||
| 2026-02-09 | 13F | Annis Gardner Whiting Capital Advisors, LLC | 28 | 0,00 | 1 | -100,00 | ||||
| 2026-02-13 | 13F | Rafferty Asset Management, LLC | 51.239 | 18,45 | 1.304 | -17,43 | ||||
| 2026-04-08 | 13F | Wealth Enhancement Advisory Services, Llc | 12.420 | 28,97 | 393 | 65,82 | ||||
| 2026-04-15 | 13F | Bayforest Capital Ltd | 0 | -100,00 | 0 | |||||
| 2026-04-29 | 13F | Oregon Public Employees Retirement Fund | 6.902 | 0,00 | 232 | 32,57 | ||||
| 2026-02-13 | 13F | Citigroup Inc | 385.147 | -1,74 | 9.798 | -31,48 | ||||
| 2026-02-11 | 13F | Simplex Trading, Llc | Put | 12.600 | 51,81 | 321 | ||||
| 2026-02-17 | 13F | Janus Henderson Group Plc | 13.150 | 0,00 | 334 | -30,27 | ||||
| 2026-02-12 | 13F | BlackRock, Inc. | 4.699.593 | 1,06 | 119.558 | -29,52 | ||||
| 2026-02-11 | 13F | Simplex Trading, Llc | 10.374 | -36,39 | 264 | |||||
| 2026-02-11 | 13F | Simplex Trading, Llc | Call | 1.100 | -95,26 | 28 | ||||
| 2026-02-17 | 13F | DV Trading LLC | 600 | 15 | ||||||
| 2026-02-09 | 13F | Kingsview Wealth Management, LLC | 0 | -100,00 | 0 | |||||
| 2026-01-09 | 13F | Pacifica Partners Inc. | 0 | -100,00 | 0 | -100,00 | ||||
| 2026-01-30 | 13F | Mitsubishi UFJ Trust & Banking Corp | 4.054 | 103 | ||||||
| 2026-02-09 | 13F | Geode Capital Management, Llc | 711.916 | -1,43 | 18.116 | -31,26 | ||||
| 2026-02-11 | 13F | Winton Capital Group Ltd | 14.759 | 375 | ||||||
| 2026-02-17 | 13F | Guggenheim Capital Llc | 12.796 | -59,48 | 326 | -71,79 | ||||
| 2026-02-17 | 13F | Algert Global Llc | 75.250 | 2 | ||||||
| 2025-11-14 | 13F | Ion Asset Management Ltd. | 33.385 | 20,52 | 1.218 | 63,80 | ||||
| 2025-11-21 | 13F | Nebula Research & Development LLC | 0 | -100,00 | 0 | |||||
| 2026-02-02 | 13F | Horizon Investments, LLC | 1.854 | 47 | ||||||
| 2026-02-11 | 13F | LPL Financial LLC | 24.301 | 9,28 | 618 | -23,80 | ||||
| 2026-02-12 | 13F | Renaissance Technologies Llc | 1.167.184 | 31,61 | 29.693 | -8,22 | ||||
| 2026-02-13 | 13F | Public Employees Retirement Association Of Colorado | 5.056 | 0,00 | 0 | |||||
| 2026-02-17 | 13F | Dark Forest Capital Management Lp | 58.673 | 1.493 | ||||||
| 2026-02-10 | 13F | Intech Investment Management Llc | 44.557 | 307,84 | 1.134 | 184,67 | ||||
| 2026-04-27 | 13F | Sound Income Strategies, LLC | 4 | -98,19 | 0 | -100,00 | ||||
| 2026-04-23 | 13F | MQS Management LLC | 0 | -100,00 | 0 | |||||
| 2026-02-12 | 13F | Advisors Asset Management, Inc. | 44.090 | -70,03 | 1.122 | -79,11 | ||||
| 2026-02-17 | 13F | Mirabella Financial Services Llp | 13.988 | 356 | ||||||
| 2025-11-13 | 13F | Norges Bank | 0 | -100,00 | 0 | -100,00 | ||||
| 2026-02-17 | 13F | Russell Investments Group, Ltd. | 181.957 | -7,93 | 4.629 | -35,80 | ||||
| 2026-02-17 | 13F | Holocene Advisors, LP | 0 | -100,00 | 0 | |||||
| 2026-02-13 | 13F | Morgan Stanley | 836.615 | -21,62 | 21.284 | -45,34 | ||||
| 2025-11-14 | 13F | Raymond James Financial Inc | 0 | -100,00 | 0 | -100,00 | ||||
| 2026-04-23 | 13F | Private Wealth Management Group, LLC | 139 | 0,00 | 5 | 33,33 | ||||
| 2026-02-17 | 13F | Amundi | 16.168 | 2,75 | 411 | -28,89 | ||||
| 2026-02-13 | 13F | Healthcare Of Ontario Pension Plan Trust Fund | 469.888 | 42,74 | 11.954 | -0,46 | ||||
| 2026-02-17 | 13F | Northern Trust Corp | 319.571 | -5,33 | 8.130 | -33,99 | ||||
| 2026-04-16 | 13F | SG Americas Securities, LLC | 22.064 | -23,52 | 1 | |||||
| 2026-02-13 | 13F | Barclays Plc | 54.747 | -6,28 | 1.393 | -34,68 | ||||
| 2025-11-04 | 13F | Pineridge Advisors LLC | 0 | -100,00 | 0 | |||||
| 2026-04-07 | 13F | CoreCap Advisors, LLC | 20 | 0,00 | 1 | |||||
| 2026-02-17 | 13F | Jones Financial Companies Lllp | 20.611 | 27,51 | 524 | -10,58 | ||||
| 2026-02-17 | 13F | Price T Rowe Associates Inc /md/ | 26.138 | -17,00 | 1 | -100,00 | ||||
| 2026-02-17 | 13F | Jain Global LLC | 22.729 | 84,86 | 578 | 29,02 | ||||
| 2026-02-13 | 13F | First Trust Advisors Lp | 33.450 | 18,20 | 851 | -17,64 | ||||
| 2026-02-10 | 13F | Bank of New York Mellon Corp | 194.324 | -4,46 | 4.944 | -33,38 | ||||
| 2026-02-17 | 13F | Citadel Advisors Llc | Call | 132.200 | -40,56 | 3.363 | -58,55 | |||
| 2026-02-17 | 13F | Twinbeech Capital Lp | 105.128 | 2.674 | ||||||
| 2026-02-17 | 13F | Citadel Advisors Llc | Put | 56.600 | -33,02 | 1.440 | -53,31 | |||
| 2026-02-17 | 13F | Citadel Advisors Llc | 563.013 | -48,30 | 14.323 | -63,95 | ||||
| 2026-02-06 | 13F | ProShare Advisors LLC | 0 | -100,00 | 0 | -100,00 | ||||
| 2026-02-11 | 13F | Fox Run Management, L.l.c. | 0 | -100,00 | 0 | |||||
| 2025-11-04 | 13F | IMC-Chicago, LLC | 0 | -100,00 | 0 | -100,00 | ||||
| 2026-04-21 | 13F | Financial Consulate, Inc | 0 | -100,00 | 0 | |||||
| 2026-02-13 | 13F | Walleye Trading LLC | Call | 1.300 | -96,51 | 33 | -97,57 | |||
| 2026-02-13 | 13F | Walleye Trading LLC | 248 | 6 | ||||||
| 2026-02-17 | 13F | Susquehanna International Group, Llp | 12.737 | -9,32 | 324 | -36,72 | ||||
| 2026-02-17 | 13F | Susquehanna International Group, Llp | Put | 44.600 | 4,69 | 1.135 | -27,03 | |||
| 2026-02-11 | 13F | Empowered Funds, LLC | 18.399 | 0,98 | 468 | -29,52 | ||||
| 2026-02-17 | 13F | Tudor Investment Corp Et Al | 524.214 | -13,93 | 13.336 | -39,97 | ||||
| 2026-02-18 | 13F | Zazove Associates Llc | Call | 0 | -100,00 | 0 | ||||
| 2026-02-17 | 13F | Oxford Asset Management Llp | 16.939 | 10,60 | 431 | 44,78 | ||||
| 2026-02-13 | 13F | Walleye Trading LLC | Put | 7.300 | 58,70 | 186 | 10,78 | |||
| 2026-02-13 | 13F | Ieq Capital, Llc | 0 | -100,00 | 0 | |||||
| 2026-02-02 | 13F | Fifth Third Bancorp | 104 | 9,47 | 3 | -33,33 | ||||
| 2026-02-09 | 13F | Cypress Capital Management LLC (WY) | 20 | -99,92 | 1 | -100,00 | ||||
| 2026-02-13 | 13F | Verition Fund Management LLC | 61.488 | -41,03 | 1.564 | -58,87 | ||||
| 2026-02-13 | 13F | C M Bidwell & Associates Ltd | 0 | -100,00 | 0 | |||||
| 2025-10-30 | 13F | Twin Peaks Wealth Advisors, LLC | 0 | -100,00 | 0 | -100,00 | ||||
| 2026-02-18 | 13F | State of Tennessee, Treasury Department | 7.938 | -7,32 | 181 | -42,31 | ||||
| 2026-02-17 | 13F | Susquehanna International Group, Llp | Call | 27.300 | -89,61 | 695 | -92,76 | |||
| 2026-02-13 | 13F | Sei Investments Co | 13.628 | -28,52 | 347 | -50,22 | ||||
| 2026-02-17 | 13F | Qube Research & Technologies Ltd | 275.860 | 7.018 | ||||||
| 2026-02-10 | 13F | Commonwealth Of Pennsylvania Public School Empls Retrmt Sys | 0 | -100,00 | 0 | |||||
| 2026-02-17 | 13F | Susquehanna Fundamental Investments, Llc | 220.134 | 0,00 | 5.600 | -30,26 | ||||
| 2026-02-17 | 13F | MIRAE ASSET GLOBAL ETFS HOLDINGS Ltd. | 14.392 | 0,10 | 366 | -30,15 | ||||
| 2025-11-14 | 13F | Caption Management, LLC | Call | 0 | -100,00 | 0 | -100,00 | |||
| 2026-01-29 | 13F | Dunhill Financial, LLC | 1 | 0 | ||||||
| 2025-11-13 | 13F | Total Investment Management Inc | 0 | -100,00 | 0 | -100,00 | ||||
| 2026-02-17 | 13F | Balyasny Asset Management Llc | 17.124 | 115,80 | 436 | 50,52 | ||||
| 2026-04-20 | 13F | Contravisory Investment Management, Inc. | 0 | -100,00 | 0 | |||||
| 2026-02-12 | 13F | Ankerstar Wealth, LLC | 2 | 0 | ||||||
| 2026-02-17 | 13F | Cetera Investment Advisers | 0 | -100,00 | 0 | -100,00 | ||||
| 2026-02-17 | 13F | California State Teachers Retirement System | 33.777 | 4,68 | 859 | -27,02 | ||||
| 2026-02-13 | 13F | BNP Paribas Asset Management Holding S.A. | 575 | 21,82 | 0 | |||||
| 2026-02-17 | 13F | Capital Fund Management S.a. | 0 | -100,00 | 0 | |||||
| 2026-04-23 | 13F | Farmers & Merchants Investments Inc | 20 | 0,00 | 1 | |||||
| 2026-02-17 | 13F | D. E. Shaw & Co., Inc. | 318.523 | 88,56 | 8.103 | 31,50 | ||||
| 2026-03-06 | 13F | Hsbc Holdings Plc | 11.615 | 292 | ||||||
| 2026-02-13 | 13F | Icon Advisers Inc/co | 165.000 | 50,00 | 4.198 | 4,61 | ||||
| 2026-02-13 | 13F | State Street Corp | 1.779.701 | 2,63 | 45.276 | -28,43 | ||||
| 2026-02-12 | 13F | DRW Securities, LLC | 10.319 | 263 | ||||||
| 2026-04-24 | 13F | Strs Ohio | 0 | -100,00 | 0 | |||||
| 2026-01-26 | 13F | Cwm, Llc | 8.461 | 0,06 | 0 | |||||
| 2026-02-17 | 13F | Capital Fund Management S.a. | Put | 0 | -100,00 | 0 | ||||
| 2026-02-13 | 13F | Jacobs Levy Equity Management, Inc | 1.281.917 | -6,04 | 32.612 | -34,47 | ||||
| 2026-04-24 | 13F | Root Financial Partners, LLC | 63 | 687,50 | 2 | |||||
| 2026-02-12 | 13F | CIBC Private Wealth Group, LLC | 7 | 0 | ||||||
| 2026-01-07 | 13F | Significant Wealth Partners LLC | 0 | -100,00 | 0 | |||||
| 2026-02-12 | 13F | Swiss National Bank | 69.400 | 1,76 | 1.766 | -29,03 | ||||
| 2026-02-17 | 13F | Quantinno Capital Management LP | 12.044 | 11,11 | 306 | -22,53 | ||||
| 2026-02-19 | 13F | Invesco Ltd. | 714.428 | 19,23 | 18.175 | -16,85 | ||||
| 2026-04-10 | 13F | Matrix Trust Co | 0 | -100,00 | 0 | |||||
| 2026-02-13 | 13F | Kennondale Capital Management LLC | 36.235 | 0,00 | 922 | -30,28 | ||||
| 2026-04-20 | 13F | State of Alaska, Department of Revenue | 14.967 | -2,53 | 1 | |||||
| 2026-02-06 | 13F | FourThought Financial Partners, LLC | 0 | -100,00 | 0 | |||||
| 2026-02-13 | 13F | Great West Life Assurance Co /can/ | 30.109 | 0,00 | 1 | -100,00 | ||||
| 2026-02-17 | 13F | VARCOV Co. | 21.144 | 538 | ||||||
| 2026-01-29 | 13F | UBS Group AG | 850.042 | 32,16 | 21.625 | -7,83 | ||||
| 2026-02-13 | 13F | Squarepoint Ops LLC | 378.006 | 9.616 | ||||||
| 2026-02-14 | 13F | Rockefeller Capital Management L.P. | 942 | 322,42 | 24 | 187,50 | ||||
| 2026-02-17 | 13F | Icahn Carl C | 70.418.471 | 0,00 | 1.791.446 | -30,26 | ||||
| 2026-01-23 | 13F | Assetmark, Inc | 12 | 100,00 | 0 | |||||
| 2026-02-05 | 13F | Thrivent Financial For Lutherans | 20.724 | -4,75 | 1 | |||||
| 2026-02-09 | 13F | Huntington National Bank | 43 | 0,00 | 1 | 0,00 | ||||
| 2026-02-13 | 13F | Edgestream Partners, L.P. | 51.317 | -69,68 | 1.306 | -78,86 | ||||
| 2026-01-21 | 13F | Future Financial Wealth Managment LLC | 0 | -100,00 | 0 | |||||
| 2026-02-12 | 13F | Nuveen, LLC | 153.748 | -42,12 | 3.911 | -59,63 | ||||
| 2026-02-13 | 13F | Parkside Financial Bank & Trust | 25 | 0,00 | 1 | |||||
| 2026-02-13 | 13F | Martingale Asset Management L P | 13.387 | 341 | ||||||
| 2026-04-27 | 13F | New York State Teachers Retirement System | 11.666 | 13,13 | 0 | |||||
| 2026-02-12 | 13F | New York State Common Retirement Fund | 14.950 | 0,00 | 380 | -30,28 | ||||
| 2025-11-14 | 13F | Engineers Gate Manager LP | 0 | -100,00 | 0 | -100,00 | ||||
| 2026-02-17 | 13F | Aristeia Capital Llc | 0 | -100,00 | 0 | |||||
| 2026-02-17 | 13F | Bank Of America Corp /de/ | 812.051 | 14,94 | 20.659 | -19,85 | ||||
| 2026-04-15 | 13F | Exchange Traded Concepts, Llc | 0 | -100,00 | 0 | |||||
| 2026-02-11 | 13F | Ameritas Investment Partners, Inc. | 2.585 | 0,00 | 66 | -30,85 | ||||
| 2025-11-14 | 13F | Wolverine Trading, Llc | Call | 7.300 | -16,09 | 269 | 13,56 | |||
| 2025-11-14 | 13F | Wolverine Trading, Llc | Put | 7.500 | 276 | |||||
| 2026-02-17 | 13F | Point72 Asset Management, L.P. | Call | 19.600 | 499 | |||||
| 2025-11-13 | 13F | Connor, Clark & Lunn Investment Management Ltd. | 0 | -100,00 | 0 | |||||
| 2026-02-17 | 13F | Point72 Asset Management, L.P. | 250.533 | 6.374 | ||||||
| 2026-02-17 | 13F | Point72 Asset Management, L.P. | Put | 10.400 | 265 | |||||
| 2026-04-07 | 13F | Signaturefd, Llc | 3 | 0,00 | 0 | |||||
| 2026-03-12 | 13F/A | Peak6 Llc | Call | 68.900 | -64,00 | 1.753 | -74,91 | |||
| 2026-02-06 | 13F | Bare Financial Services, Inc | 29 | 0,00 | 1 | -100,00 | ||||
| 2026-02-13 | 13F | Van Eck Associates Corp | 11.259 | 0 | ||||||
| 2025-11-14 | 13F | Wolverine Trading, Llc | 5.861 | 216 | ||||||
| 2026-02-11 | 13F | Deutsche Bank Ag\ | 154.546 | -48,75 | 3.932 | -64,27 | ||||
| 2026-04-06 | 13F | GAMMA Investing LLC | 2.329 | -10,42 | 78 | 18,18 | ||||
| 2026-02-17 | 13F | Brevan Howard Capital Management LP | 60.252 | 55,79 | 1.533 | 8,65 | ||||
| 2026-04-13 | 13F | True Wealth Design, LLC | 281 | -4,10 | 9 | 28,57 | ||||
| 2026-02-17 | 13F | Aqr Capital Management Llc | 113.767 | -0,63 | 2.894 | -30,70 | ||||
| 2026-02-13 | 13F | Ubs Asset Management Americas Inc | 51.653 | -1,85 | 1.314 | -31,53 | ||||
| 2026-02-12 | 13F | Commonwealth Equity Services, Llc | 13.787 | -7,97 | 351 | |||||
| 2026-02-17 | 13F | Weiss Asset Management LP | 68.640 | 1.746 | ||||||
| 2026-04-06 | 13F | Versant Capital Management, Inc | 407 | -11,14 | 14 | 18,18 | ||||
| 2026-01-29 | 13F | Camelot Portfolios, LLC | 15.888 | -33,94 | 404 | -53,93 | ||||
| 2026-02-17 | 13F | State Of Wisconsin Investment Board | 78.039 | 746,41 | 1.985 | 490,77 | ||||
| 2026-02-05 | 13F | Amalgamated Bank | 8.787 | -1,09 | 0 | |||||
| 2026-02-10 | 13F | Daiwa Securities Group Inc. | 5.143 | 5,63 | 0 | |||||
| 2026-02-17 | 13F | Creative Planning | 0 | -100,00 | 0 | |||||
| 2026-02-17 | 13F | Ameriprise Financial Inc | 97.186 | -13,24 | 2.472 | -39,50 | ||||
| 2026-02-05 | 13F | Bessemer Group Inc | 325 | 0,00 | 0 | |||||
| 2026-04-20 | 13F | Louisiana State Employees Retirement System | 13.400 | -2,90 | 451 | 28,21 | ||||
| 2026-04-20 | 13F | Jfs Wealth Advisors, Llc | 4 | -20,00 | 0 | |||||
| 2026-01-27 | 13F | Zurcher Kantonalbank (Zurich Cantonalbank) | 13.965 | 17,55 | 355 | -18,01 | ||||
| 2026-02-17 | 13F | Hotchkis & Wiley Capital Management Llc | 365.790 | -16,68 | 9.306 | -41,90 | ||||
| 2025-12-16 | 13F | Garde Capital, Inc. | 0 | -100,00 | 0 | |||||
| 2026-04-13 | 13F | Massmutual Trust Co Fsb/adv | 13 | -55,17 | 0 | |||||
| 2026-02-24 | 13F | Amanah Holdings Trust | 0 | -100,00 | 0 | |||||
| 2026-02-17 | 13F | Alliancebernstein L.p. | 56.563 | 15,57 | 1.439 | -19,44 | ||||
| 2026-02-17 | 13F | Shay Capital LLC | 7.914 | 201 | ||||||
| 2026-02-02 | 13F | Wolverine Asset Management Llc | 21.560 | 548 | ||||||
| 2026-02-10 | 13F | State of Wyoming | 7.452 | 12,33 | 190 | -21,90 | ||||
| 2026-02-13 | 13F | Entropy Technologies, LP | 0 | -100,00 | 0 | -100,00 | ||||
| 2026-02-06 | 13F | Gsa Capital Partners Llp | 51.991 | 136,02 | 1 | |||||
| 2026-02-13 | 13F | Wells Fargo & Company/mn | 37.807 | 25,49 | 962 | -12,56 | ||||
| 2026-02-06 | 13F | Pnc Financial Services Group, Inc. | 754 | -7,71 | 19 | -34,48 | ||||
| 2025-11-14 | 13F | Wood Tarver Financial Group, LLC | 0 | -100,00 | 0 | |||||
| 2026-02-02 | 13F | Principal Financial Group Inc | 144.305 | -1,09 | 3.671 | -31,02 | ||||
| 2026-02-17 | 13F | ION Fund Management Ltd | 33.385 | 849 | ||||||
| 2026-02-17 | 13F | Royal Bank Of Canada | 9.439 | -92,65 | 240 | -94,88 | ||||
| 2026-02-09 | 13F | Harbour Investments, Inc. | 721 | 60,58 | 18 | 12,50 | ||||
| 2026-02-10 | 13F | Quantbot Technologies LP | 0 | -100,00 | 0 | |||||
| 2026-02-06 | 13F | Larson Financial Group LLC | 878 | 0,00 | 22 | -31,25 | ||||
| 2025-11-14 | 13F | Cubist Systematic Strategies, LLC | Put | 22.900 | 835 | |||||
| 2025-11-14 | 13F | Cubist Systematic Strategies, LLC | Call | 25.200 | 919 | |||||
| 2026-02-09 | 13F | Legal & General Group Plc | 81.532 | -4,89 | 2.074 | -33,67 | ||||
| 2026-02-12 | 13F | Jane Street Group, Llc | 489.151 | 330,99 | 12.444 | 200,58 | ||||
| 2026-02-06 | 13F | Cullen/frost Bankers, Inc. | 0 | -100,00 | 0 | |||||
| 2026-02-11 | 13F | Jpmorgan Chase & Co | 356.887 | -6,11 | 9.079 | -34,53 | ||||
| 2025-11-13 | 13F | Baird Financial Group, Inc. | 0 | -100,00 | 0 | |||||
| 2026-02-12 | 13F | Jane Street Group, Llc | Put | 22.500 | -14,45 | 572 | -40,35 | |||
| 2026-02-13 | 13F | Prudential Financial Inc | 29.053 | -5,99 | 739 | -34,43 | ||||
| 2026-02-12 | 13F | Jane Street Group, Llc | Call | 51.900 | 8,12 | 1.320 | -24,61 | |||
| 2026-02-17 | 13F | IHT Wealth Management, LLC | 10.468 | -6,06 | 266 | -34,48 | ||||
| 2026-02-12 | 13F | MetLife Investment Management, LLC | 17.743 | 0,00 | 451 | -30,29 | ||||
| 2026-02-09 | 13F | Hantz Financial Services, Inc. | 419 | 210,37 | 0 | |||||
| 2026-04-28 | 13F | SBI Securities Co., Ltd. | 525 | -2,78 | 18 | 30,77 |