Grundlæggende statistik
| Institutionelle aktier (lange) | 18.127.682 - 60,39% (ex 13D/G) - change of -3,81MM shares -17,38% MRQ |
| Institutionel værdi (lang) | $ 957.392 USD ($1000) |
Institutionelt ejerskab og aktionærer
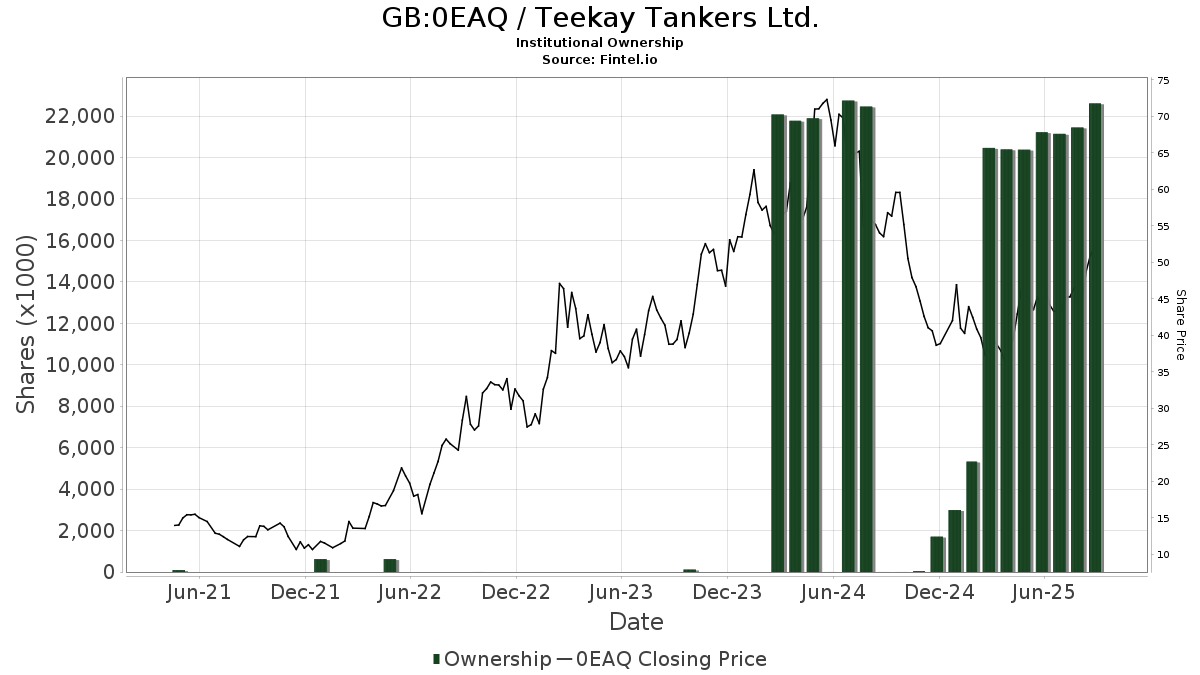
Teekay Tankers Ltd. (GB:0EAQ) har 220 institutionelle ejere og aktionærer, der har indsendt 13D/G- eller 13F-formularer til Securities Exchange Commission (SEC). Disse institutioner har i alt 18,127,682 aktier. Største aktionærer omfatter Dimensional Fund Advisors Lp, BlackRock, Inc., Fmr Llc, Mercuria Capital Strategies, LLC, American Century Companies Inc, Morgan Stanley, CastleKnight Management LP, Renaissance Technologies Llc, Summit Street Capital Management, LLC, and Jpmorgan Chase & Co .
Teekay Tankers Ltd. (LSE:0EAQ) institutionel ejerskabsstruktur viser aktuelle positioner i virksomheden efter institutioner og fonde, samt seneste ændringer i positionsstørrelse. Større aktionærer kan omfatte individuelle investorer, investeringsforeninger, hedgefonde eller institutioner. Skema 13D angiver, at investoren besidder (eller besidder) mere end 5 % af virksomheden og har til hensigt (eller har til hensigt at) aktivt at forfølge en ændring i forretningsstrategi. Skema 13G indikerer en passiv investering på over 5%.
The share price as of May 1, 2026 is 78,55 / share. Previously, on May 2, 2025, the share price was 44,02 / share. This represents an increase of 78,44% over that period.
Fondens stemningsscore
Fund Sentiment Score (fka Ownership Accumulation Score) finder de aktier, der bliver mest købt af fonde. Det er resultatet af en sofistikeret, multi-faktor kvantitativ model, der identificerer virksomheder med de højeste niveauer af institutionel akkumulering. Scoringsmodellen bruger en kombination af den samlede stigning i oplyste ejere, ændringerne i porteføljeallokeringer i disse ejere og andre målinger. Tallet går fra 0 til 100, hvor højere tal indikerer et højere niveau af akkumulering for sine jævnaldrende, og 50 er gennemsnittet.
Opdateringsfrekvens: Dagligt
Se Ownership Explorer, som giver en liste over højest rangerende virksomheder.
AI+ Ask Fintel’s AI assistant about Teekay Tankers Ltd..
Select a question to share a public post with an AI-crafted answer.
Thinking of good questions…
13F og NPORT arkivering
Detaljer om 13F-arkivering er gratis. Detaljer om NP-ansøgninger kræver et premium-medlemskab. Grønne rækker angiver nye positioner. Røde rækker angiver lukkede positioner. Klik på linket ikon for at se den fulde transaktionshistorik.
Opgrader
for at låse premium-data op og eksportere til Excel ![]() .
.
| Fil dato | Kilde | Investor | Type | Gennemsnitlig pris (Øst) |
Aktier | Δ Aktier (%) |
Rapporteret Værdi ($1000) |
Δ Værdi (%) |
Port Alloc (%) |
|
|---|---|---|---|---|---|---|---|---|---|---|
| 2026-02-17 | 13F | Quantedge Capital Pte Ltd | 107.818 | 470,47 | 5.760 | 503,04 | ||||
| 2026-02-18 | 13F/A | Fuller & Thaler Asset Management, Inc. | 321.066 | -0,25 | 17.151 | 5,41 | ||||
| 2026-02-17 | 13F | Prelude Capital Management, Llc | 4.440 | -41,42 | 237 | -38,12 | ||||
| 2026-02-13 | 13F | Hudson Bay Capital Management LP | 56.159 | -26,50 | 3.000 | -22,32 | ||||
| 2026-04-21 | 13F | Vise Technologies, Inc. | 5.064 | 0,00 | 271 | 0,00 | ||||
| 2026-02-17 | 13F | Qube Research & Technologies Ltd | 279.689 | 132,84 | 14.941 | 146,05 | ||||
| 2026-02-17 | 13F | Harvey Capital Management Inc | 9.985 | -16,69 | 533 | -11,90 | ||||
| 2026-04-21 | 13F | Robeco Institutional Asset Management B.V. | 17.560 | 1.287 | ||||||
| 2026-04-13 | 13F | Massmutual Trust Co Fsb/adv | 0 | -100,00 | 0 | |||||
| 2026-04-20 | 13F | State of Alaska, Department of Revenue | 1.081 | 0,00 | 0 | |||||
| 2026-02-09 | 13F | Royce & Associates Lp | 172.048 | -18,69 | 9.191 | -14,07 | ||||
| 2026-02-17 | 13F | Nomura Holdings Inc | 5.228 | 279 | ||||||
| 2026-04-24 | 13F | Essex Financial Services, Inc. | 8.089 | 0,21 | 593 | 37,59 | ||||
| 2026-04-28 | 13F | Unison Advisors LLC | 13.326 | 0,41 | 977 | 37,99 | ||||
| 2026-02-17 | 13F | Oxford Asset Management Llp | 4.533 | 242 | ||||||
| 2026-02-18 | 13F | Vident Advisory, LLC | 13.443 | 718 | ||||||
| 2026-02-17 | 13F | Ancora Advisors, LLC | 5.542 | -56,33 | 296 | -53,82 | ||||
| 2026-02-11 | 13F | Zions Bancorporation, National Association /ut/ | 414 | 22 | ||||||
| 2026-02-12 | 13F | Steward Partners Investment Advisory, Llc | 4.814 | 0,00 | 257 | 5,76 | ||||
| 2026-02-09 | 13F | Coldstream Capital Management Inc | 0 | -100,00 | 0 | |||||
| 2026-04-29 | 13F | Klp Kapitalforvaltning As | 55.000 | 37,50 | 4.033 | 88,76 | ||||
| 2026-02-13 | 13F | Arrowstreet Capital, Limited Partnership | 46.553 | -75,49 | 2.487 | -74,11 | ||||
| 2026-02-17 | 13F | Schonfeld Strategic Advisors LLC | 24.374 | 17,34 | 1.302 | 24,00 | ||||
| 2026-02-13 | 13F | Wexford Capital Lp | 52.818 | -70,09 | 2.822 | -68,39 | ||||
| 2026-02-13 | 13F | Barclays Plc | 66.975 | -0,47 | 3.578 | 5,17 | ||||
| 2026-02-13 | 13F | Victory Capital Management Inc | 46.747 | 0,25 | 2.497 | 5,94 | ||||
| 2025-11-20 | 13F | Maven Securities LTD | 0 | -100,00 | 0 | |||||
| 2026-02-11 | 13F | Franklin Resources Inc | 66.230 | -1,25 | 3.538 | 4,37 | ||||
| 2026-02-13 | 13F | Manufacturers Life Insurance Company, The | 0 | -100,00 | 0 | |||||
| 2026-04-24 | 13F | Root Financial Partners, LLC | 38 | 3 | ||||||
| 2026-02-09 | 13F | Geode Capital Management, Llc | 358.798 | -0,60 | 19.167 | 5,04 | ||||
| 2026-02-17 | 13F | Aster Capital Management (DIFC) Ltd | 1.067 | 2.948,57 | 57 | 5.500,00 | ||||
| 2026-02-17 | 13F | Credit Agricole S A | 17.826 | 952 | ||||||
| 2026-02-17 | 13F | Capstone Investment Advisors, Llc | 0 | -100,00 | 0 | -100,00 | ||||
| 2026-02-17 | 13F/A | Mercuria Capital Strategies, LLC | 1.228.294 | 65.615 | ||||||
| 2026-01-29 | 13F | Vanguard Group Inc | 212.892 | 3,05 | 11.373 | 8,91 | ||||
| 2026-02-06 | 13F | Tortoise Investment Management, LLC | 0 | -100,00 | 0 | |||||
| 2026-04-30 | 13F | Hsbc Holdings Plc | 3.027 | 221 | ||||||
| 2026-02-12 | 13F | Pinnacle Holdings, LLC | 0 | -100,00 | 0 | |||||
| 2026-02-13 | 13F | Estabrook Capital Management | 0 | -100,00 | 0 | |||||
| 2025-11-14 | 13F | Aventail Capital Group, LP | 0 | -100,00 | 0 | -100,00 | ||||
| 2025-11-12 | 13F | Integrated Advisors Network LLC | 0 | -100,00 | 0 | |||||
| 2026-02-11 | 13F | O'shaughnessy Asset Management, Llc | 19.823 | -2,70 | 1.059 | 2,82 | ||||
| 2026-02-17 | 13F | Millennium Management Llc | 146.378 | 203,55 | 7.820 | 220,85 | ||||
| 2026-02-17 | 13F | Kemnay Advisory Services Inc. | 623 | 33 | ||||||
| 2026-02-17 | 13F | Ameriprise Financial Inc | 368.544 | -41,58 | 19.685 | -38,27 | ||||
| 2026-02-13 | 13F | National Bank Of Canada /fi/ | 0 | -100,00 | 0 | |||||
| 2026-02-03 | 13F | Denali Advisors Llc | 90.172 | -2,26 | 4.817 | 3,28 | ||||
| 2026-02-18 | 13F | Garton & Associates Financial Advisors LLC | 79 | 4 | ||||||
| 2026-04-27 | 13F | Y-Intercept (Hong Kong) Ltd | 26.454 | -55,30 | 1.940 | -38,66 | ||||
| 2026-02-17 | 13F | Cetera Investment Advisers | 0 | -100,00 | 0 | |||||
| 2026-02-11 | 13F | Simplex Trading, Llc | 519 | -79,55 | 28 | |||||
| 2025-11-14 | 13F | State Of Wisconsin Investment Board | 0 | -100,00 | 0 | |||||
| 2026-04-27 | 13F | Td Private Client Wealth Llc | 784 | 0,00 | 57 | 39,02 | ||||
| 2026-02-17 | 13F | Fearnley Asset Management As | 25.203 | 17.890 | ||||||
| 2026-02-17 | 13F | T. Rowe Price Investment Management, Inc. | 101.978 | -72,93 | 5 | -73,68 | ||||
| 2026-02-17 | 13F | Aqr Capital Management Llc | 189.010 | 10,84 | 10.097 | 17,12 | ||||
| 2026-02-17 | 13F | Trexquant Investment LP | 96.467 | 146,84 | 5.153 | 160,91 | ||||
| 2026-04-24 | 13F | UMA Financial Services, Inc. | 50 | 0,00 | 4 | 50,00 | ||||
| 2026-02-17 | 13F | Fmr Llc | 1.410.427 | -33,10 | 75.345 | -29,31 | ||||
| 2026-02-09 | 13F | Huntington National Bank | 1 | 0,00 | 0 | |||||
| 2026-02-12 | 13F | Quadrant Capital Group Llc | 139 | 0,00 | 7 | 0,00 | ||||
| 2026-04-23 | 13F | Forum Financial Management, LP | 0 | -100,00 | 0 | |||||
| 2026-02-17 | 13F | Moore Capital Management, Lp | 90.000 | 4.808 | ||||||
| 2026-02-17 | 13F | XTX Topco Ltd | 22.436 | 1.199 | ||||||
| 2026-04-29 | 13F | Police & Firemen's Retirement System of New Jersey | 6.612 | 0,00 | 485 | 37,11 | ||||
| 2026-02-17 | 13F | Bank Of America Corp /de/ | 209.886 | 12,88 | 11.212 | 19,30 | ||||
| 2026-02-17 | 13F | Russell Investments Group, Ltd. | 92.038 | 15,32 | 4.912 | 21,76 | ||||
| 2026-02-17 | 13F | Raymond James Financial Inc | 10.366 | -64,21 | 554 | -62,23 | ||||
| 2026-02-10 | 13F | Goldman Sachs Group Inc | 139.574 | -4,59 | 7.456 | 0,82 | ||||
| 2026-02-11 | 13F | Los Angeles Capital Management Llc | 99 | 6 | ||||||
| 2026-02-09 | 13F | Hartland & Co., LLC | 0 | -100,00 | 0 | |||||
| 2026-02-13 | 13F | Charles Schwab Investment Management Inc | 96.859 | 1,65 | 5.174 | 7,43 | ||||
| 2026-04-22 | 13F | Sterling Capital Management LLC | 5.731 | -37,47 | 420 | -14,11 | ||||
| 2026-02-17 | 13F | Magnetar Financial LLC | 5.627 | 301 | ||||||
| 2026-01-15 | 13F | Allspring Global Investments Holdings, LLC | 10.725 | 9,61 | 573 | 15,79 | ||||
| 2026-02-09 | 13F | Harbour Investments, Inc. | 68 | -69,23 | 4 | -72,73 | ||||
| 2026-02-11 | 13F | Deutsche Bank Ag\ | 17.625 | 4,65 | 942 | 10,58 | ||||
| 2026-02-05 | 13F | Amalgamated Bank | 755 | -8,60 | 0 | |||||
| 2026-02-13 | 13F | Prudential Financial Inc | 10.540 | -13,00 | 563 | -8,01 | ||||
| 2026-02-10 | 13F | Connor, Clark & Lunn Investment Management Ltd. | 51.265 | -34,76 | 2.739 | 2.584,31 | ||||
| 2026-02-13 | 13F | Sei Investments Co | 41.515 | 329,98 | 2.218 | 354,30 | ||||
| 2026-02-17 | 13F | Engineers Gate Manager LP | 18.023 | 963 | ||||||
| 2025-11-14 | 13F | Centiva Capital, LP | 0 | -100,00 | 0 | |||||
| 2026-02-06 | 13F | Larson Financial Group LLC | 412 | 64,80 | 22 | 83,33 | ||||
| 2026-02-13 | 13F | Umb Bank N A/mo | 9 | 0,00 | 0 | |||||
| 2026-02-17 | 13F | Optiver Holding B.V. | 425 | 108,33 | 23 | 120,00 | ||||
| 2026-02-13 | 13F | Boston Partners | 8.059 | -17,19 | 431 | -12,42 | ||||
| 2026-02-17 | 13F | Jones Financial Companies Lllp | 204 | 117,02 | 11 | 150,00 | ||||
| 2025-11-04 | 13F | Allianz Asset Management GmbH | 0 | -100,00 | 0 | |||||
| 2026-04-24 | 13F | Kendall Capital Management | 19.842 | -0,72 | 1.455 | 36,27 | ||||
| 2026-02-17 | 13F | Greenland Capital Management LP | 0 | -100,00 | 0 | -100,00 | ||||
| 2026-02-09 | 13F | Systematic Financial Management Lp | 214.728 | -0,32 | 11.471 | 5,34 | ||||
| 2026-02-12 | 13F | Rossby Financial, LCC | 0 | -100,00 | 0 | |||||
| 2026-01-23 | 13F | Assetmark, Inc | 138 | -93,46 | 7 | -93,40 | ||||
| 2026-02-13 | 13F | First Trust Advisors Lp | 7.087 | 13,25 | 379 | 19,62 | ||||
| 2026-01-21 | 13F | Shariaportfolio, Inc. | 48.065 | -29,37 | 2.568 | -25,36 | ||||
| 2026-02-10 | 13F | Intech Investment Management Llc | 9.115 | -21,07 | 487 | -16,64 | ||||
| 2026-02-12 | 13F | Aviva Plc | 8.455 | -9,78 | 452 | -4,65 | ||||
| 2026-02-06 | 13F | Pnc Financial Services Group, Inc. | 1.827 | 10,39 | 98 | 16,87 | ||||
| 2026-02-17 | 13F | Perritt Capital Management Inc | 0 | -100,00 | 0 | |||||
| 2025-11-13 | 13F | Diametric Capital, LP | 0 | -100,00 | 0 | |||||
| 2026-01-29 | 13F | Cornerstone Investment Partners, LLC | 4.481 | 0,07 | 239 | 5,75 | ||||
| 2026-02-11 | 13F | Picton Mahoney Asset Management | 20 | 0,00 | 1 | |||||
| 2026-02-13 | 13F | Ieq Capital, Llc | 39.584 | 8,57 | 2.115 | 14,70 | ||||
| 2026-05-01 | 13F | U S Global Investors Inc | 5.383 | 42,86 | 395 | 96,02 | ||||
| 2026-02-17 | 13F | Public Employees Retirement System Of Ohio | 26.233 | -0,08 | 1.401 | 5,58 | ||||
| 2026-02-17 | 13F | Northern Trust Corp | 197.705 | -10,86 | 10.561 | -5,80 | ||||
| 2026-02-17 | 13F | Tudor Investment Corp Et Al | 112.882 | 6.030 | ||||||
| 2026-02-10 | 13F | Quantbot Technologies LP | 9.544 | 332,83 | 510 | 358,56 | ||||
| 2025-11-07 | 13F | Credit Industriel Et Commercial | 0 | -100,00 | 0 | |||||
| 2026-01-30 | 13F | Us Bancorp \de\ | 21 | 0,00 | 1 | 0,00 | ||||
| 2026-02-17 | 13F | IHT Wealth Management, LLC | 8.014 | 0,41 | 428 | 6,20 | ||||
| 2026-02-12 | 13F | Sagil Capital Llp | 0 | -100,00 | 0 | |||||
| 2026-04-06 | 13F | Versant Capital Management, Inc | 483 | 8,78 | 35 | 52,17 | ||||
| 2026-01-28 | 13F | Ruffer LLP | 69.863 | 3.738 | ||||||
| 2026-02-12 | 13F | Jane Street Group, Llc | Call | 151.100 | 725,68 | 8.072 | 772,54 | |||
| 2025-11-14 | 13F | Twinbeech Capital Lp | 0 | -100,00 | 0 | |||||
| 2025-11-14 | 13F | Dauntless Investment Group, LLC | 0 | -100,00 | 0 | -100,00 | ||||
| 2026-02-13 | 13F | State Street Corp | 399.832 | 0,78 | 21.359 | 6,51 | ||||
| 2026-04-23 | 13F | SJS Investment Consulting Inc. | 2 | 0 | ||||||
| 2026-02-13 | 13F | Mariner, LLC | 7.286 | 5,56 | 389 | 11,78 | ||||
| 2026-02-17 | 13F | Aquatic Capital Management LLC | 0 | -100,00 | 0 | -100,00 | ||||
| 2026-02-02 | 13F | Principal Financial Group Inc | 55.188 | -92,21 | 2.948 | -91,77 | ||||
| 2025-12-09 | 13F/A | Tudor Investment Corp Et Al | Put | 0 | -100,00 | 0 | ||||
| 2025-11-14 | 13F | Balyasny Asset Management Llc | 0 | -100,00 | 0 | |||||
| 2026-02-13 | 13F | Jacobs Levy Equity Management, Inc | 176.808 | -18,07 | 9.445 | -13,42 | ||||
| 2026-04-07 | 13F | Signaturefd, Llc | 649 | 45,52 | 48 | 104,35 | ||||
| 2026-02-10 | 13F | Bank of New York Mellon Corp | 64.350 | -0,70 | 3.438 | 4,95 | ||||
| 2026-02-17 | 13F | California State Teachers Retirement System | 1.480 | -1,33 | 79 | 5,33 | ||||
| 2026-02-18 | 13F | GWM Advisors LLC | 53 | 0,00 | 3 | 0,00 | ||||
| 2026-02-17 | 13F | Susquehanna International Group, Llp | 25.524 | 1.363 | ||||||
| 2026-02-13 | 13F | Verition Fund Management LLC | 17.200 | -86,70 | 919 | -85,95 | ||||
| 2026-02-06 | 13F | HighTower Advisors, LLC | 0 | -100,00 | 0 | |||||
| 2026-02-17 | 13F | Susquehanna International Group, Llp | Put | 98.500 | 140,24 | 5.262 | 153,91 | |||
| 2026-02-17 | 13F | Susquehanna International Group, Llp | Call | 28.300 | -78,51 | 1.512 | -77,30 | |||
| 2026-02-10 | 13F | Bnp Paribas Arbitrage, Sa | 6.491 | -42,02 | 347 | -38,76 | ||||
| 2026-02-13 | 13F | MAI Capital Management | 54 | -46,00 | 3 | -60,00 | ||||
| 2026-02-10 | 13F | Envestnet Asset Management Inc | 0 | -100,00 | 0 | |||||
| 2025-11-24 | 13F | CIBC Private Wealth Group, LLC | 0 | -100,00 | 0 | -100,00 | ||||
| 2026-04-13 | 13F | True Wealth Design, LLC | 230 | 0,00 | 17 | 33,33 | ||||
| 2025-11-14 | 13F | Virtu Financial LLC | 0 | -100,00 | 0 | |||||
| 2026-02-12 | 13F | Hrt Financial Lp | 94.518 | 5 | ||||||
| 2026-02-13 | 13F | SRS Capital Advisors, Inc. | 3 | -99,92 | 0 | -100,00 | ||||
| 2026-04-06 | 13F | GAMMA Investing LLC | 1.321 | 12,81 | 97 | 54,84 | ||||
| 2026-04-20 | 13F | CWA Asset Management Group, LLC | 0 | -100,00 | 0 | |||||
| 2026-02-17 | 13F | Bridgeway Capital Management Inc | 271.170 | -8,73 | 14.486 | -3,55 | ||||
| 2026-02-12 | 13F | BlackRock, Inc. | 1.697.882 | -0,88 | 90.701 | 4,75 | ||||
| 2026-02-13 | 13F | Smartleaf Asset Management LLC | 312 | 197,14 | 17 | 220,00 | ||||
| 2025-11-12 | 13F | Rsm Us Wealth Management Llc | 0 | -100,00 | 0 | |||||
| 2026-02-12 | 13F | Jane Street Group, Llc | 201.995 | 250,96 | 10.791 | 270,92 | ||||
| 2026-03-31 | 13F | Sankala Group LLC | 33 | 0,00 | 2 | 0,00 | ||||
| 2026-02-18 | 13F | EP Wealth Advisors, Inc. | 5.914 | 0,19 | 316 | 28,05 | ||||
| 2026-01-29 | 13F | UBS Group AG | Call | 284.165 | 15.180 | |||||
| 2026-01-29 | 13F | UBS Group AG | 143.975 | -17,54 | 7.691 | -12,86 | ||||
| 2025-11-14 | 13F | Wolverine Trading, Llc | Put | 8.100 | 5,19 | 415 | 27,69 | |||
| 2026-02-12 | 13F | Renaissance Technologies Llc | 557.100 | -32,89 | 29.760 | -29,08 | ||||
| 2026-04-28 | 13F | Harbor Capital Advisors, Inc. | 518 | 0 | ||||||
| 2026-02-10 | 13F | Rothschild Investment Llc | 71 | 102,86 | 4 | 200,00 | ||||
| 2026-02-12 | 13F | MetLife Investment Management, LLC | 13.243 | -6,27 | 707 | -0,98 | ||||
| 2025-11-06 | 13F | Abc Arbitrage Sa | 0 | -100,00 | 0 | |||||
| 2026-04-27 | 13F | Leonteq Securities AG | 386 | -40,16 | 28 | -17,65 | ||||
| 2026-02-10 | 13F | Acadian Asset Management Llc | 288.612 | 240,58 | 15 | 275,00 | ||||
| 2026-02-17 | 13F | Two Sigma Advisers, Lp | 19.038 | -1,87 | 1.017 | 3,78 | ||||
| 2025-11-14 | 13F | Wolverine Trading, Llc | 26.936 | 86,10 | 1.381 | 125,49 | ||||
| 2025-11-14 | 13F | Wolverine Trading, Llc | Call | 34.500 | -40,72 | 1.768 | -28,19 | |||
| 2026-02-11 | 13F | Parallel Advisors, LLC | 35 | 0,00 | 2 | 0,00 | ||||
| 2026-02-13 | 13F | Oceanic Investment Management LTD | 36.825 | -96,18 | 1.967 | 106,62 | ||||
| 2026-02-17 | 13F | Tower Research Capital LLC (TRC) | 2.007 | 53,09 | 107 | 62,12 | ||||
| 2026-02-11 | 13F | Cerity Partners LLC | 6.784 | 7,46 | 362 | 13,48 | ||||
| 2026-02-17 | 13F | Boothbay Fund Management, Llc | 15.172 | 1,43 | 810 | 7,14 | ||||
| 2026-02-17 | 13F | NEOS Investment Management LLC | 15.437 | 825 | ||||||
| 2026-05-01 | 13F | Gables Capital Management Inc. | 63 | 0,00 | 5 | 33,33 | ||||
| 2026-02-04 | 13F | Pacer Advisors, Inc. | 0 | -100,00 | 0 | |||||
| 2026-02-13 | 13F | Peak6 Llc | Put | 0 | -100,00 | 0 | ||||
| 2026-02-12 | 13F | Campbell & CO Investment Adviser LLC | 0 | -100,00 | 0 | |||||
| 2026-02-13 | 13F | Segall Bryant & Hamill, Llc | 20.560 | 1.098 | ||||||
| 2026-04-30 | 13F | Nuveen, LLC | 58.381 | -0,30 | 4.280 | 36,83 | ||||
| 2025-11-05 | 13F | Bessemer Group Inc | 0 | -100,00 | 0 | |||||
| 2026-03-03 | 13F/A | Caitong International Asset Management Co., Ltd | 1.401 | 216,97 | 75 | 236,36 | ||||
| 2026-01-16 | 13F | Empirical Financial Services, LLC d.b.a. Empirical Wealth Management | 13.264 | 708 | ||||||
| 2026-02-06 | 13F | EverSource Wealth Advisors, LLC | 426 | 86,03 | 23 | 100,00 | ||||
| 2026-02-10 | 13F/A | Northwestern Mutual Wealth Management Co | 85 | 5 | ||||||
| 2026-02-13 | 13F | Martingale Asset Management L P | 58.595 | -9,15 | 3.130 | -3,99 | ||||
| 2026-04-17 | 13F | IFC & Insurance Marketing, Inc. | 0 | -100,00 | 0 | |||||
| 2026-02-17 | 13F | Royal Bank Of Canada | 647 | -73,71 | 34 | -72,58 | ||||
| 2026-04-13 | 13F | Highland Capital Management, Llc | 10.161 | 43,68 | 745 | 97,61 | ||||
| 2026-02-13 | 13F | Dynamic Technology Lab Private Ltd | 0 | -100,00 | 0 | |||||
| 2026-02-11 | 13F | Jpmorgan Chase & Co | 417.483 | 6,13 | 22.302 | 12,16 | ||||
| 2026-02-13 | 13F | American Century Companies Inc | 1.013.604 | -5,92 | 54.147 | -0,58 | ||||
| 2026-02-19 | 13F | Invesco Ltd. | 42.599 | -19,32 | 2.276 | -14,73 | ||||
| 2026-04-28 | 13F | Abel Hall, LLC | 3.291 | 241 | ||||||
| 2026-02-12 | 13F | Dimensional Fund Advisors Lp | 1.835.312 | 2,01 | 98.042 | 7,80 | ||||
| 2026-02-13 | 13F | Rhumbline Advisers | 31.137 | -15,80 | 1.663 | -11,02 | ||||
| 2026-02-17 | 13F | Advisor Group Holdings, Inc. | 1.800 | -22,65 | 96 | -17,24 | ||||
| 2026-04-08 | 13F | Wealth Enhancement Advisory Services, Llc | 8.187 | 28,44 | 630 | 85,29 | ||||
| 2026-02-17 | 13F | Quantinno Capital Management LP | 6.625 | 13,93 | 354 | 20,48 | ||||
| 2026-02-13 | 13F | Parkside Financial Bank & Trust | 47 | -18,97 | 3 | 0,00 | ||||
| 2026-02-13 | 13F | Walleye Capital LLC | 7.935 | -38,55 | 424 | -35,12 | ||||
| 2025-11-05 | 13F | Gallacher Capital Management LLC | 0 | -100,00 | 0 | -100,00 | ||||
| 2026-02-12 | 13F | Federation des caisses Desjardins du Quebec | 125 | 0,00 | 7 | 0,00 | ||||
| 2025-11-14 | 13F | Polymer Capital Management (US) LLC | 0 | -100,00 | 0 | |||||
| 2026-01-26 | 13F | Cwm, Llc | 9.171 | 2,41 | 0 | |||||
| 2026-02-13 | 13F | Citigroup Inc | 6.040 | 10,36 | 323 | 16,67 | ||||
| 2026-02-13 | 13F | Peak6 Llc | Call | 0 | -100,00 | 0 | ||||
| 2026-04-10 | 13F | Matrix Trust Co | 425 | 3,91 | 0 | |||||
| 2026-02-11 | 13F | Empowered Funds, LLC | 158.170 | 5,37 | 8.449 | 11,36 | ||||
| 2026-02-13 | 13F | Peak6 Llc | 0 | -100,00 | 0 | |||||
| 2026-02-13 | 13F | Squarepoint Ops LLC | 96.863 | 5.174 | ||||||
| 2026-02-13 | 13F | Quarry LP | 146 | 274,36 | 8 | 600,00 | ||||
| 2026-02-13 | 13F | Marnell Management LLC | 23.073 | 1.233 | ||||||
| 2026-02-17 | 13F | Alliancebernstein L.p. | 24.620 | 0,00 | 1.315 | 5,71 | ||||
| 2026-04-16 | 13F | SG Americas Securities, LLC | 18.251 | 56,88 | 1 | |||||
| 2026-02-13 | 13F | Morgan Stanley | 752.168 | -10,27 | 40.181 | -5,18 | ||||
| 2025-11-12 | 13F | Globeflex Capital L P | 0 | -100,00 | 0 | -100,00 | ||||
| 2026-04-07 | 13F | Farther Finance Advisors, LLC | 4.211 | -17,37 | 307 | 12,87 | ||||
| 2026-01-30 | 13F | Glenorchy Capital Ltd | 36.937 | 0,54 | 1.973 | 6,25 | ||||
| 2026-02-11 | 13F | Fox Run Management, L.l.c. | 27.332 | 42,64 | 1.460 | 50,83 | ||||
| 2026-02-17 | 13F | Jump Financial, LLC | 12.596 | -58,97 | 673 | -56,67 | ||||
| 2026-02-09 | 13F | Legal & General Group Plc | 5.987 | 24,81 | 320 | 31,82 | ||||
| 2026-02-13 | 13F | Pinnacle Wealth Planning Services, Inc. | 2.406 | 129 | ||||||
| 2026-02-17 | 13F | Point72 Asset Management, L.P. | 117.107 | 6.256 | ||||||
| 2026-02-12 | 13F | New York State Common Retirement Fund | 29.102 | -8,49 | 1.555 | -3,30 | ||||
| 2026-04-23 | 13F | MQS Management LLC | 5.938 | -33,30 | 435 | -8,42 | ||||
| 2026-02-17 | 13F | CastleKnight Management LP | 575.767 | -11,32 | 30.757 | -6,29 | ||||
| 2026-02-17 | 13F | CastleKnight Management LP | Call | 100.000 | -66,67 | 5.342 | -64,77 | |||
| 2026-02-14 | 13F | Rockefeller Capital Management L.P. | 1.230 | 291,72 | 66 | 333,33 | ||||
| 2026-02-11 | 13F | Meeder Asset Management Inc | 1.925 | 0,00 | 103 | 5,15 | ||||
| 2026-02-17 | 13F | SummitTX Capital, L.P. | 0 | -100,00 | 0 | |||||
| 2026-02-12 | 13F | Jane Street Group, Llc | Put | 0 | -100,00 | 0 | -100,00 | |||
| 2026-02-13 | 13F | Strategic Global Advisors, LLC | 34.557 | 1,25 | 1.846 | 7,01 | ||||
| 2026-02-13 | 13F | Wells Fargo & Company/mn | 27.217 | 44,80 | 1.454 | 52,95 | ||||
| 2026-02-11 | 13F | Group One Trading, L.p. | 3.911 | 209 | ||||||
| 2026-04-13 | 13F | IFP Advisors, Inc | 157 | -9,25 | 12 | 22,22 | ||||
| 2026-02-17 | 13F | Summit Street Capital Management, LLC | 471.147 | -6,10 | 25.169 | -0,76 | ||||
| 2026-04-02 | 13F | Ares Financial Consulting, LLC | 868 | 63 | ||||||
| 2026-04-20 | 13F | Ronald Blue Trust, Inc. | 687 | -0,43 | 50 | 38,89 | ||||
| 2026-02-11 | 13F | CSM Advisors, LLC | 71.335 | 5,25 | 4 | 0,00 | ||||
| 2026-02-13 | 13F | Ubs Asset Management Americas Inc | 31 | 2 | ||||||
| 2026-02-11 | 13F | LPL Financial LLC | 10.926 | -1,26 | 584 | 4,29 | ||||
| 2026-02-10 | 13F | Ellevest, Inc. | 6.599 | -28,13 | 353 | -24,14 | ||||
| 2026-02-12 | 13F | Great Lakes Advisors, Llc | 57.472 | 0,00 | 3.070 | 5,68 | ||||
| 2026-02-17 | 13F | D. E. Shaw & Co., Inc. | 7.272 | 388 | ||||||
| 2026-02-13 | 13F | Financial Network Wealth Advisors LLC | 20 | 0,00 | 1 | 0,00 | ||||
| 2026-02-17 | 13F | Man Group plc | 98.534 | 5.264 | ||||||
| 2026-02-17 | 13F | Summit Global Investments | 13.203 | -3,37 | 1 | |||||
| 2026-02-17 | 13F | Voloridge Investment Management, Llc | 19.126 | 1.022 | ||||||
| 2026-04-27 | 13F | Ethic Inc. | 13.730 | -4,33 | 1.007 | 31,33 | ||||
| 2026-04-24 | 13F | ProShare Advisors LLC | 3.483 | -20,70 | 255 | 8,97 | ||||
| 2026-02-06 | 13F | Covestor Ltd | 17 | -10,53 | 0 | |||||
| 2026-02-12 | 13F | Voya Investment Management Llc | 4.389 | -2,29 | 234 | 3,08 | ||||
| 2025-11-07 | 13F | Sierra Ocean, Llc | 0 | -100,00 | 0 | |||||
| 2026-02-17 | 13F | Citadel Advisors Llc | Put | 17.400 | -57,97 | 930 | -55,59 | |||
| 2026-04-16 | 13F | Baron Wealth Management LLC | 3.916 | -2,95 | 287 | 33,49 | ||||
| 2026-04-28 | 13F | SBI Securities Co., Ltd. | 39 | 0,00 | 3 | 0,00 | ||||
| 2026-01-26 | 13F | Mirae Asset Global Investments Co., Ltd. | 516 | 28 | ||||||
| 2026-02-17 | 13F | Citadel Advisors Llc | Call | 11.000 | -71,28 | 588 | -69,68 | |||
| 2026-02-17 | 13F | Citadel Advisors Llc | 219.382 | 159,05 | 11.719 | 173,81 | ||||
| 2026-04-22 | 13F | Mindset Wealth Management, Llc | 5.813 | -47,12 | 426 | -27,43 | ||||
| 2026-02-17 | 13F | Price T Rowe Associates Inc /md/ | 14.407 | 10,04 | 1 | |||||
| 2026-02-13 | 13F | Marshall Wace, Llp | 0 | -100,00 | 0 | |||||
| 2026-02-06 | 13F | Global Retirement Partners, LLC | 2.326 | 12,69 | 124 | 19,23 | ||||
| 2026-02-11 | 13F | Ameritas Investment Partners, Inc. | 2.007 | 107 | ||||||
| 2026-04-30 | 13F | Nisa Investment Advisors, Llc | 310 | 0,00 | 23 | 37,50 | ||||
| 2026-02-13 | 13F | Toroso Investments, LLC | 12.495 | -15,05 | 667 | -10,23 | ||||
| 2026-02-10 | 13F | State of Wyoming | 7.263 | 0,11 | 388 | 5,74 | ||||
| 2026-04-10 | 13F | Linden Thomas Advisory Services, LLC | 38.427 | 95,83 | 2.817 | 168,80 | ||||
| 2026-02-17 | 13F | Hartree Partners, LP | 0 | -100,00 | 0 | |||||
| 2026-02-17 | 13F | Dark Forest Capital Management Lp | 5.633 | 301 | ||||||
| 2026-04-23 | 13F | Global Trust Asset Management, LLC | 625 | 46 | ||||||
| 2026-04-24 | 13F | Strs Ohio | 12.200 | -12,86 | 895 | 19,68 | ||||
| 2026-02-06 | 13F | Gsa Capital Partners Llp | 26.788 | 3,69 | 1 | 0,00 | ||||
| 2026-02-17 | 13F | MIRAE ASSET GLOBAL ETFS HOLDINGS Ltd. | 11.159 | -0,04 | 596 | 5,67 | ||||
| 2026-04-30 | 13F | Sequoia Financial Advisors, LLC | 3.687 | 270 | ||||||
| 2026-02-05 | 13F | Allworth Financial LP | 72 | 28,57 | 4 | 50,00 | ||||
| 2026-04-15 | 13F | Exchange Traded Concepts, Llc | 3.357 | -27,01 | 246 | 0,41 | ||||
| 2026-02-20 | 13F | Sunbelt Securities, Inc. | 5 | -99,60 | 0 | -100,00 | ||||
| 2026-02-11 | 13F | Capital Analysts, Inc. | 69 | 0,00 | 0 | |||||
| 2026-04-20 | 13F | Longview Financial Advisors, Inc. | 239 | 18 | ||||||
| 2026-02-12 | 13F | State Board Of Administration Of Florida Retirement System | 6.727 | 0,00 | 359 | 5,59 |